Extending
Pathways
Temasek Review 2012
←
→
Page content transcription
If your browser does not render page correctly, please read the page content below

Extending Pathways Temasek Review 2012


Extending Pathways
Temasek was born barely a decade
after Singapore’s independence.
There were no models to emulate,
no pathways to follow. We knew only
that we must stay relevant to survive,
and build for the next generation.
We learnt and reinvented ourselves
over the years, always seeking to
understand, quietly working to deliver
results, even as we stepped into the
unknown. Sometimes, we wandered
into cul-de-sacs. At other times,
we paid the price for being pioneers.
Each step an adventure and a learning;
each footfall a commitment and
an aspiration.
We stepped forward, shoulder to
shoulder with Singapore in our early
years. Ten years ago, we ventured forth
into an emerging Asia. Today, we continue
to extend our pathways.
Our people and their families featured in
this Temasek Review symbolise the past,
present and future of the pathways we
create as Temasek. They reflect the
many who contributed to Temasek in our
38 year journey as an investor, a forward
looking institution and a trusted steward.

                                             1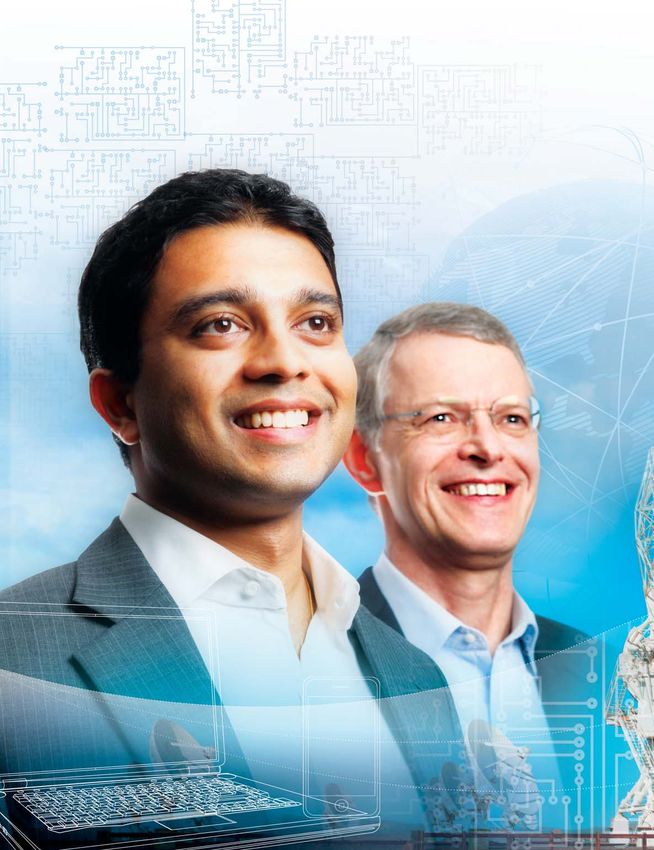
Contents

Temasek Charter                                           5

Year in Review                                            6

From Our Chairman                                         8

Portfolio Highlights                                     14
Portfolio by Geography, Sector, Liquidity and Currency    16
Portfolio Value since Inception                           18
Total Shareholder Return                                  19

Group Financial Summary                                  20
Statement by Auditors                                     22
Statement by Directors                                    23
Group Financial Highlights                                24
Group Income Statements                                   26
Group Balance Sheets                                      27
Group Cash Flow Statements                                28
Group Statements of Changes in Equity                     29

Financing Framework                                      30

                   Scan the QR code with
                   your smartphone
                   Explore Temasek Review 2012 at
                   www.temasekreview.com.sg

2         Temasek Review 2012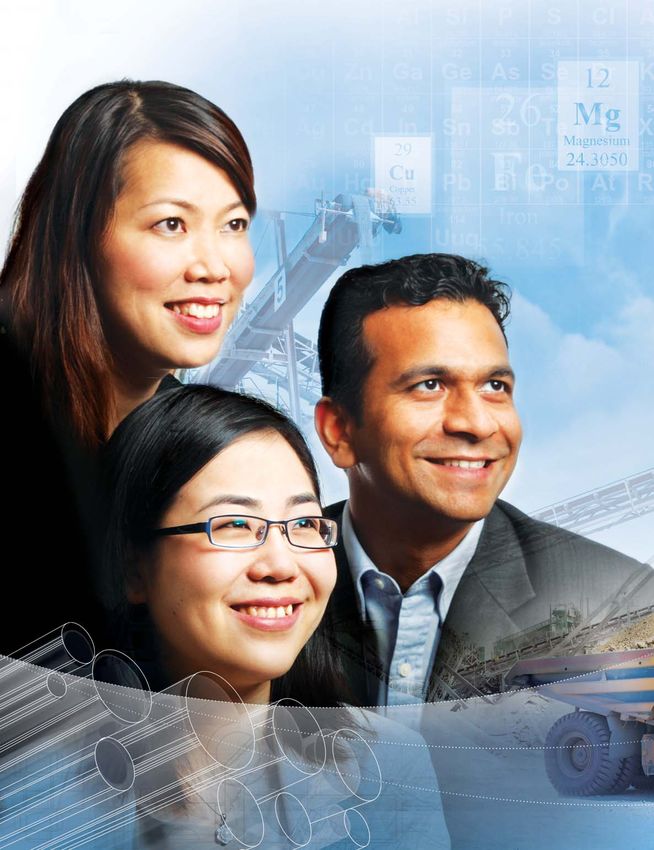
Contents

Extending Our Portfolio       32
Investment Framework           34
Wealth Added Framework         38
Investment Highlights          39

Shaping Our Institution       42
Governance Framework           44
Board of Directors             52
Senior Management              54
Risk Framework                 57
MERITT Values                  62
Compensation Framework         63
The Temasek Heartbeat          66

Broadening Our Perspectives   68
Engaging Friends               70
Temasek International Panel    72
Temasek Advisory Panel         73

Exercising Stewardship        74
Making a Difference            76
Enriching Lives                83

Major Investments             86

Our Contact Points            94

                                           3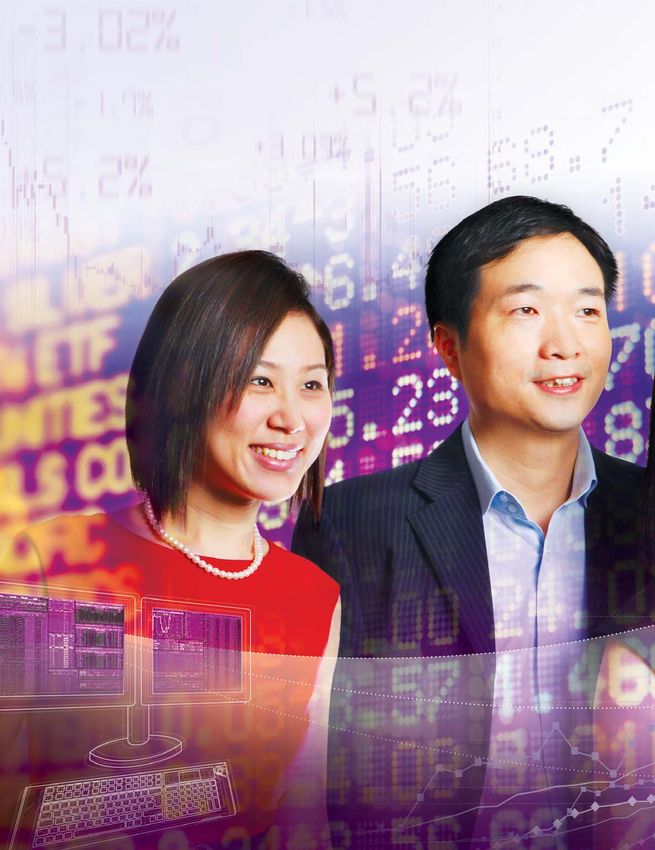
“Over 100 years ago, this was a mud-flat, swamp.
 Today, this is a modern city.
 Ten years from now, this will be a metropolis. Never fear.”
 Lee Kuan Yew
 Founding Prime Minister, Republic of Singapore
 Speech at the Sree Narayana Mission in Sembawang
 12 September 1965

 4         Temasek Review 2012

Temasek Charter

Temasek is an active investor and shareholder.
We deliver sustainable value over the long term.

Temasek is a forward looking institution.
We act with integrity and are committed to the pursuit of excellence.

Temasek is a trusted steward.
We strive for the advancement of our communities across generations.

                                                                        5
Year in Review
(as at 31 March)

Our portfolio remained resilient in a volatile year. We continued to build our people and
capabilities as an investor and shareholder, as an institution, and as a steward.

Portfolio Value                               Portfolio Value (S$b)
Our portfolio grew by
S$121 billion since March 2002.

                                                                                                  193    198
                                                                                185         186
                                                                          164

S$198b
                                                                  129                 130
                                                           103
                                                      90
                                                 61
Portfolio value

                                                 03   04   05     06      07    08    09    10    11         12

Total Shareholder Return                      Rolling S$ Total Shareholder Return (%)
Three-year annualised
compounded return to
our shareholder was 15%.                              20   18             18
                                                16                16            17          16
                                                                                      13          15         15
                                                16

1.50%
                                                                                10                 9         10
                                                                          8
                                                           5       6                  6     6
                                                       3
One-year return
                                                 03   04   05     06      07    08    09    10    11         12
                                                 10-year        20-year

Returns to Temasek                            10-year Annualised S$ Returns to Temasek (%)
Post-2002 investments
contributed significantly
to our total returns.                                                                                   18

18%                                                                              11

Returns on post-2002 investments
                                              O Investments made after 31 March 2002
                                              O Investments held as at 31 March 2002

6        Temasek Review 2012
Year in Review

Investment Activities          Investments & Divestments (S$b)
We invested S$139 billion
and divested S$87 billion
                                                            32
over the decade.                                 21                                 22
                                            13        16                      13
                                                                  9     10
                                       3
                                  0

S$7b                              0    1
                                            5
                                                 13
                                                       5
                                                            17    16
                                                                        6     9
                                                                                    15
Net investments for the year
                                 03   04    05   06   07    08    09    10    11    12
                               O Investments O Divestments

Group Financial Highlights     Group Shareholder Equity (S$b)
Group shareholder equity
was S$158 billion.                                                      150   155   158
                                                            144
                                                      114         118               146
                                                                        128   134
                                                 91         120   120
                                       65   71        93
                                 55              84
                                       65   71
                                 55

S$11b
Group net profit                  03    04   05   06    07   08    09    10    11    12
                               O Fair value reserve
                               O Shareholder equity before fair value reserve

Our People                     Staff Composition (%)
Our diverse team of over 400
is the heartbeat of Temasek.

                                                                              67    65

19                                                          67    66    65
                                 95    92   81   74    70

Nationalities
                                 03    04   05   06    07   08    09    10    11    12
                               O Singapore O Other countries

                                                                                          7
From Our Chairman

                               The global economy remains vulnerable to further shocks,
                               with more challenges in Europe over the next 12–24 months.
                               Further out in this decade, both Asia and the USA will have
                               their own sets of challenges.

                               Meanwhile, the steady global recovery of 2010 faltered with the Arab Spring
                               unrest of early 2011, followed by the Eurozone debt spasm of late 2011.
                               Amidst this volatility, our portfolio remained resilient. We closed the year
                               ended 31 March 2012 with a steady S$198 billion portfolio, including a
                               comfortable net cash position.

                               Portfolio Highlights
                               Total Shareholder Return (TSR) measures returns to our shareholder as if it
                               held our portfolio directly. This includes dividends to our shareholder and
                               excludes capital injections from our shareholder.
                               Our TSR in Singapore dollar denomination was 1.50% for the year.
                               Three-year TSR was 15% compounded annually, with longer term
                               10-year and 20-year TSRs at 10% and 15% respectively. TSR since inception
                               in 1974 was 17%.
                               Group shareholder equity last financial year was at a record S$158 billion,
10%                            including fair value reserve of S$12 billion, while group net profit was a
                               healthy S$11 billion.
Ten-year TSR
                               Investing for Our Future Generations
                               In the 10 years since March 2002, we invested almost S$140 billion,
                               and divested just under S$90 billion as an active investor in Asia.
17%                            In the process, we reshaped our portfolio from one largely focused on
TSR since inception            Singapore to one riding on the twin transformations of Asia and Singapore,
                               growing it from S$77 billion at end March 2002 to S$198 billion a
                               decade later.

8        Temasek Review 2012
From Our Chairman
Investments made since March 2002 delivered over 18% annualised returns
to Temasek over the last 10 years, while blue chip investments we held as at
end March 2002, such as SingTel and Singapore Airlines, delivered a steady
11% annualised returns to Temasek over the same period.
S$198b
Portfolio value
Based on a theoretical simulation of key holdings, had we kept our portfolio
as at 31 March 2002 unchanged, and not stepped out actively into Asia,
it would have grown to a lower S$165 billion in March 2012.
Last year, we invested a total of S$22 billion, and divested S$15 billion,
with net investments of S$7 billion.
S$158b
Group shareholder
As at end March 2012, our exposure to Asia based on the underlying assets equity
of our investments was 72%, down from 77% a year ago. This included our
Singapore exposure, steady at around one third over the last five years.
In Singapore, we partnered leading international financial institutions to
establish Clifford Capital to undertake project financing in the region.
We collaborated with the Singapore Ministry of Finance to sponsor
Heliconia Capital Management, to seed growth capital for Singapore-based
small and medium-sized enterprises.
A major investment in the year was the 60:40 joint venture between
Malaysia’s Khazanah Nasional Berhad and Temasek to develop land
parcels in Singapore. These commercial land parcels were a swap from
the Singapore Government in return for Singapore railway land previously
used by Malayan Railway1.
Separately, Temasek partnered Khazanah to develop two wellness-related
projects in the southern Malaysian state of Johor, with a gross development
value of approximately RM3 billion.
Temasek’s stakes in our joint ventures with Khazanah were funded by
a capital injection from the Singapore Government. The projects should
complete within a three to five year time frame.
1
Keretapi Tanah Melayu Berhad, commonly known as KTM or Malayan Railway, ceased
train services into downtown Singapore on 1 July 2011, and relocated its service terminal
to northern Singapore, under a Malaysia–Singapore agreement.
9From Our Chairman continued
The banking sector in China remains a good proxy to the growing Chinese
economy and expanding middle income population.
During the year ended March 2012, we added to our stake in China
Construction Bank. Post 31 March 2012, we rebalanced our overall
banking exposure, including an investment of over S$3 billion in
Industrial and Commercial Bank of China.
In total, our exposure to the financial services sector fell from 36% to 31%,
mostly reflecting the fall in market valuations.
Australia and New Zealand increased to 14% of our portfolio, while our
exposure to North America and Europe increased from over 8% a year ago
to above 11%, largely through investments in the energy and resources
sector. Our nascent 1% exposure to Latin America grew more than 20%.
Investments in the USA energy and resources sector last year included
S$2 billion in FTS International, a shale energy production service provider,
and over S$1 billion in The Mosaic Company, a fertiliser producer.
These were followed by a S$300 million investment in May this year
in Cheniere Energy, the first American company to obtain all relevant
regulatory approvals for the export of liquefied natural gas to USA Free
Trade Agreement partners, including Singapore.
Other investments post March 2012 in this sector included Kunlun Energy
of China, and Ivanhoe Mines, an international mining company with assets
in Asia and Australia.
S$22b Over the last few years, we cautiously broadened our exposure beyond
equities. As at 31 March 2012, we had a gross notional S$600 million of
Investments put and call options, reflecting our longer term interest in their underlying
equities, and some S$1.3 billion investment in credit funds.
Expanding Our Stakeholder Base
S$15b We have expanded our stakeholder base methodically over the years as part
of our intent to foster good governance and long term institutional discipline.
Divestments
In 2004, our 30th anniversary year, we initiated the publication of our annual
Temasek Review to share our key financial and portfolio performance.
Credit ratings by Standard & Poor’s and Moody’s in 2004 were a prelude
to our maiden 10-year Temasek Bond in 2005.
10 Temasek Review 2012From Our Chairman
To date, we have issued S$10 billion of triple-A rated Temasek Bonds in
Singapore dollars, US dollars and British pounds sterling, with tenors of
up to 40 years.
We launched our US$5 billion Euro-commercial Paper (ECP) Programme in
2011 to enhance our short end funding options. This has been assigned the
highest short term ratings.
Our Temasek Bond and ECP Programmes underpin our financing framework,
providing a flexible balance of long and short term funding options.
Our annual Temasek Review, international credit ratings and Temasek Bonds
are more than just public markers of our credit quality. They expand our
stakeholder engagement to include the Singapore public and international 18%
investors, and help foster financial discipline over the long term. Ten-year annualised
On the community front, Temasek dedicated two endowments, returns to Temasek
of S$35 million each, to honour the late Dr Balaji Sadasivan and from investments
Dr Ee Peng Liang. These support training and capability building in made since
healthcare and social services respectively, and were funded from a portion March 2002
of our excess returns above our risk-adjusted hurdles in previous years.
The non-profit philanthropic organisations supported through our community
endowments via Temasek Trust further extend our stakeholder base.
Preparing for Volatility Ahead
The global contagion risks from Europe over the next 12–24 months are
not insignificant. Other medium term risks include a tepid recovery in the
USA and its substantial debt burden as well as structural challenges in
Asia. These may trim the growth potential of Asia, and heighten volatility
in this decade. Growth in general will be more tentative.
The steroids of liquidity in Europe, the USA and elsewhere in recent
years have provided symptomatic relief for the years of profligacy and
overspending. These bought time for serious reforms to be effected,
failing which the systemic risks will continue to snowball.
In the near term, inflationary pressures are expected to be low to
moderate due to overcapacity, except in growth markets where inflation
is anticipated to be structurally higher. Over the longer term, there are
significant risks of inflation arising from the expansionary policy responses
in the major economies.
11From Our Chairman continued
Overall, our investment themes remain relevant:
• Transforming Economies
• Growing Middle Income Populations
• Deepening Comparative Advantages
• Emerging Champions
Long term growth potential in Asia remains healthy, despite risks along the
way. Sectorally, we began shading our preferences over the last two years
towards technology, energy and resources as well as consumer and other
middle income needs.
Strengthening the Institution for the Future
During the year, we reviewed and updated our Temasek Charter to distil our
roles as an active investor and shareholder, a forward looking institution and
a trusted steward.
Temasek was built through the strength of character and commitment
of generations of Board and management since 1974. Our core assets
have been our people, passion and purpose to build a Temasek for our
future generations.
We strengthened our bench to include several well respected industry
leaders, while key Temasek stalwarts have moved to Temasek-linked
platforms to help extend our capacity and reach in the different markets.
We bade farewell to other colleagues, some of whom were selected by
the boards of operating companies for CEO and other leadership roles.
Younger colleagues at all levels add to our verve and vitality as an institution,
as we continue to nurture them as leaders.
Growth in general will
be more tentative. Apart from renewing and expanding our team, we continue to build our
systems and capabilities for the future.
Over the last two years, we have been developing a long term expected
returns model relevant to Temasek as an owner investor. Built bottom
Inflationary pressures up from our assessment of the longer term global outlook, the model
are expected to be simulates the range and likelihood of returns expected over a 20 year
low to moderate, horizon. Further development of the model will continue as we add
except in growth capabilities to analyse the effects of changes in our portfolio character
markets. and mix, and sensitivities to shifts in economic conditions.
We continue to refine our simulation tools for investment risk evaluation,
while new tools such as T-Mint have been developed to track macro signals
and lead indicators, as we prepare for a more volatile decade ahead.
12 Temasek Review 2012From Our Chairman
Recognising Friends and Fellow Board Members
Changes to our Board included the retirement of Simon Israel and
Hsieh Fu Hua last year from both their Board and executive roles.
I thank them for their service and appreciate their continued engagement
in their personal capacities as Chairmen of SingTel and Fullerton Fund
Management Company respectively.
On 31 May 2012, Kwa Chong Seng retired as Deputy Chairman after
15 years on our Board. I am deeply grateful to him for his invaluable
insights, and his contributions working closely with management as we
transformed and repositioned Temasek for the future. I am very pleased
that he continues to play an active role as the Chairman of NOL.
We warmly welcomed two new members to our Board: Cheng Wai Keung
and Lim Boon Heng. Wai Keung joined in September last year, bringing
Our core assets
a wealth of experience in shipping, property investment and hospitality
have been our people,
management. Boon Heng, who joined us in June this year, combines
passion and purpose
a rare suite of deep personal experience in shipping, union leadership
to build a Temasek
and government.
for our future
I sincerely appreciate the board members, management and staff, past and generations.
present, of Temasek and our portfolio companies, for their contributions.
They helped to build Temasek and our portfolio companies as sustainable
institutions and outstanding businesses.
In addition, I extend my personal thanks to past and present members of
the Temasek International Panel (TIP), the Temasek Advisory Panel, and
TIP emeritus members. They have been most generous in sharing their
deep insights and rich experiences in an increasingly connected and
complex world.
Finally, I thank all our stakeholders – our shareholder, bondholders, business
partners, advisors, investors, regulators, philanthropic organisations, friends,
vendors and the broader public. Their trust in us through the years gave us
the courage and encouragement to create and extend pathways. It is for
them and our future generations that we do things today as an investor,
as an institution and as a steward, always with tomorrow in mind.
S DHANABALAN
Chairman
July 2012
13Portfolio Highlights
Portfolio by Geography,
Sector, Liquidity and Currency 16
Portfolio Value since Inception 18
Total Shareholder Return 19
“Making investments
that will benefit
both my generation
and the next.”
Shane Xu, Associate Director, Investment
Photo (left to right):
Camila de Almeida, Associate, Brazil;
Ricardo Hallack, Director, Brazil;
Renato Fairbanks Ribeiro, Associate Director, Brazil.
15Portfolio Highlights
(as at 31 March)
Temasek has a net portfolio of S$198 billion, comprising mostly equities. It has an
underlying exposure that is balanced between mature economies and growth regions.
Global Exposure1
42% 30% 25% 3%
Asia ex-Singapore Singapore Australia & Latin America,
New Zealand, Africa, Central Asia
North America & the Middle East
& Europe
1
Distribution based on underlying assets.
16 Temasek Review 2012Portfolio Highlights
Geography1 (%) 2012 2011
Asia ex-Singapore 42 45
Singapore 30 32
Australia & New Zealand 14 12
North America & Europe 11 8
Africa, Central Asia & the Middle East 2 2
Latin America 1 1
Sector1 (%) 2012 2011
Financial Services 31 36
Telecommunications, Media & Technology 24 22
Transportation & Industrials 21 23
Life Sciences, Consumer & Real Estate 12 11
Energy & Resources 6 3
Others 6 5
Liquidity (%) 2012 2011
Listed large blocs (≥20% share) 37 39
Liquid & sub-20% listed assets 36 39
Unlisted assets 27 22
Currency2 (%) 2012 2011
Singapore dollars 65 65
Hong Kong dollars 12 15
US dollars 7 4
British pounds sterling 6 6
Indonesian rupiah 2 3
Indian rupees 2 3
Others 6 4
2
Distribution based on currency of denomination.
17Portfolio Value since Inception
Temasek was incorporated in 1974 with an initial portfolio valued
at S$354 million.
Comprising 35 companies and other investments, these were mostly
startups1 ranging from a bank to a sugar refiner. Companies such as
Singapore Airlines and DBS Bank have since grown to become international
and regional brands, while others such as NatSteel2 have been divested.
In the 1990s, four statutory entities, SingTel, PSA, Singapore Power and
MediaCorp, were corporatised and acquired by Temasek. This was part
of the policy intent by the Singapore Government to devolve itself from
the provision of commercial services, or to further liberalise the market.
Some, like port operator PSA and telecommunications provider SingTel,
have transformed into global and regional players. Others such as
Singapore Power have been restructured into several operating businesses,
including three power generation companies which were sold a decade
later in the late 2000s.
From a portfolio of S$77 billion in March 2002, Temasek began actively
investing in Asia and beyond. The portfolio has grown to a record
S$198 billion in March 2012, with a net cash position.
Temasek Portfolio Value since Inception
Temasek steps up investments in Asia Global
(in S$ billion) Financial
Crisis
200
SARS
Epidemic
150
Dotcom Peak
100
Listing of SingTel
50
0
74 3 75 4 76 77 78 79 80 81 82 83 84 85 86 87 88 89 90 91 92 94 5 95 96 97 98 99 00 01 02 03 04 05 06 07 08 09 10 11 12
December 5 March 5 Financial Year
OMarket value OShareholder equity Shareholder equity before fair value reserve 6
1
See the list of companies in the initial portfolio on page 96.
2
Formed to produce iron and steel in Singapore, NatSteel Ltd (formerly known as National Iron & Steel Mills Ltd) was first
divested in 1986. Temasek reinvested in NatSteel in 1998 in support of their investment in Brazil. Temasek divested
Natsteel in 2002 when NatSteel initiated a sale process.
3
Incorporation of Temasek on 25 June 1974.
4
Financial year 75 began on 25 June 1974 and ended 31 December 1975.
5
Financial year-end was changed from 31 December before 1993 to 31 March from 1994 onwards.
6
FRS39 Financial Instruments: Recognition and Measurement, introduced during year ended 31 March 2006, requires
available-for-sale financial assets to be measured at fair value.
18 Temasek Review 2012Portfolio Highlights
Total Shareholder Return
Total Shareholder Return (TSR) measures compounded annual
returns to our shareholder as if it held our portfolio directly.
It includes dividends to our shareholder and excludes capital
injections from our shareholder.
For the financial year ended 31 March 2012, our one-year TSR in
Singapore dollar denomination7 was 1.50%, while our three-year TSR
was 14.86%.
Longer term TSR for 10, 20 and 30 years was 10%, 15% and 15%
respectively. TSR since inception was 17% compounded over 38 years.
The average risk-adjusted hurdle rates for Temasek were about 9% through
the years. Annualised core inflation in Singapore was under 2%8 over the
past 10 years.
S$ Total Shareholder Return vs Risk-adjusted Hurdle Rate (%) (as at 31 March 2012)
Period (in years)
17
Since Inception (1974)
9
15
30
9
15
20
9
10
10
9
3
5
9
15
3
9
3
2
8
1
1
8
O Total Shareholder Return in S$ terms O Risk-adjusted hurdle rate
7
TSR in US$ terms was 2%, 22%, 14%, 16%, 17%, and 19% for 1, 3, 10, 20, 30 and 38-year periods respectively.
8
As of the year ended March 2012, annualised core inflation in Singapore was 2.5%, 1.3%, 1.8% and 1.7% for 1, 3, 10 and
20-year periods respectively (computed using data from the Monetary Authority of Singapore).
19Group Financial
Summary
Statement by Auditors 22
Statement by Directors 23
Group Financial Highlights 24
Group Income Statements 26
Group Balance Sheets 27
Group Cash Flow Statements 28
Group Statements
of Changes in Equity 29
Financing
Framework 30
“It’s all about doing the right thing,
even when no one is watching.”
Chong Hui Min, Associate Director, Investor Relations
Photo:
Law Heng Dean,
Associate Director, Strategic Relations,
and his son, Tao Yu.
21Statement by Auditors
We are the auditors of Temasek Holdings (Private) Limited (“Temasek”). We have audited
the statutory consolidated financial statements of Temasek and its subsidiary companies
(the “Group”) for the financial years ended 31 March 2008, 2009, 2010, 2011 and 2012 and
have issued unqualified audit reports1. The audited statutory consolidated financial statements
of the Group for the financial years ended 31 March 2004, 2005, 2006 and 2007 were audited
by PricewaterhouseCoopers LLP2 whose auditors’ reports3 were also unqualified.
Under the Singapore Companies Act, Chapter 50, Temasek is an exempt private company and
is not required to publish its audited statutory consolidated financial statements.
Management is responsible for the preparation and presentation of the Group Financial
Summary for the financial years ended 31 March 2004 to 2012 set out from pages 24 to 29.
The Group Financial Summary consists of the Group Financial Highlights, Group Income
Statements, Group Balance Sheets and Group Cash Flow Statements as at and for the financial
years ended 31 March 2004 to 2012 and Group Statements of Changes in Equity for the
financial years ended 31 March 2011 and 2012, which is prepared and presented based on the
audited statutory consolidated financial statements. The Group Financial Summary does not
contain all the disclosures required by Singapore Financial Reporting Standards applied in the
preparation of the audited statutory consolidated financial statements of the Group. Reading
the Group Financial Summary, therefore, is not a substitute for reading the audited statutory
consolidated financial statements of the Group.
Our responsibility is to express an opinion on the Group Financial Summary based on our
procedures, which were conducted in accordance with Singapore Standard on Auditing
(SSA) 810 – Engagements to Report on Summary Financial Statements.
In our opinion, the Group Financial Summary is summarised and presented consistently, in all
material respects, with the audited statutory consolidated financial statements of the Group.
KPMG LLP
Public Accountants and Certified Public Accountants
Singapore
27 June 2012
1
Dated 16 July 2008, 15 July 2009, 1 July 2010, 29 June 2011 and 27 June 2012 respectively.
2
PricewaterhouseCoopers LLP was converted from a partnership to a limited liability partnership on
1 January 2009.
3
Dated 24 June 2004, 15 July 2005, 13 July 2006 and 5 July 2007 respectively.
22 Temasek Review 2012Group Financial Summary
Statement by Directors
Our auditors, KPMG LLP, have expressed unqualified opinions on the audited statutory
consolidated financial statements of Temasek Holdings (Private) Limited and its subsidiary
companies (the “Group”) for the financial years ended 31 March 2008 to 2012. Our auditors
for the financial years ended 31 March 2004 to 2007, PricewaterhouseCoopers LLP 2, have
expressed unqualified opinions on the audited statutory consolidated financial statements
of the Group for the financial years ended 31 March 2004 to 2007.
On behalf of the directors
S DHANABALAN
Chairman
27 June 2012
HO CHING
Executive Director & Chief Executive Officer
27 June 2012
23Group Financial Highlights1
(for year ended 31 March)
Profit Margin2 (%) VA/Employment Cost 3
24.2
20.7
18.2
16.8 16.1
14.5
12.2
9.0
5.3 3.2 3.0 3.4 2.9
2.6 2.7 2.5 2.2 2.6
04 05 06 07 08 09 10 11 12 04 05 06 07 08 09 10 11 12
Net Debt to Capital4 (%) EBITDA Interest Coverage 5
21.8
19.9
16.6
14.6
12.6 13.5
12.2 11.9 11.5
10.7 10.7
9.3 9.4 9.7
8.1 7.7 8.3
5.0
04 05 06 07 08 09 10 11 12 04 05 06 07 08 09 10 11 12
Return on Average Equity 6 (%) Return on Average Assets7 (%)
15.9
14.1
12.4
11.1
8.9 9.2 9.5
8.3
6.8 7.1 6.6 6.8 6.3
4.7 5.3
3.4 4.3 3.5
04 05 06 07 08 09 10 11 12 04 05 06 07 08 09 10 11 12
1
The Group Financial Summary, including highlights as set out from pages 24 to 29, is prepared and presented based on the
audited statutory consolidated financial statements of the Group for the financial years ended 31 March 2004 to 2012.
2
Profit before share of results of associated companies, partnerships and joint ventures, expressed as a percentage
of revenue.
3
Gross value added per dollar of employment cost.
4
Net debt expressed as a percentage of the sum of shareholder equity, non-controlling interests and net debt.
5
Profit before income tax, finance expenses, depreciation, amortisation and impairment loss on property, plant and
equipment and intangibles divided by finance expenses.
6
Profit attributable to equity holder of the Company expressed as a percentage of average shareholder equity.
7
Total profit, add back finance expenses, expressed as a percentage of average total assets.
24 Temasek Review 2012Group Financial Summary
Group Income Statements (in S$ billion)
For year ended 31 Mar 2004 2005 2006 2007 2008 2009 2010 2011 2012
Revenue 56.5 67.5 79.8 74.6 83.3 79.6 76.7 83.5 83.5
Profit before
income tax 11.8 12.2 19.0 14.3 25.5 10.4 8.5 17.8 14.8
Profit attributable
to equity holder of
the Company 7.4 7.5 12.8 9.1 18.2 6.2 4.6 12.7 10.7
Group Balance Sheets (in S$ billion)
As at 31 Mar 2004 2005 2006 2007 2008 2009 2010 2011 2012
Total assets 180.8 199.1 213.7 242.4 295.5 247.9 284.8 297.9 302.6
Shareholder equity
before fair value
reserve 64.5 70.9 83.6 92.9 120.2 119.9 127.8 134.6 146.4
Fair value reserve 8
– – 7.0 21.1 23.9 (1.5) 21.9 20.9 11.8
Shareholder equity 64.5 70.9 90.6 114.0 144.1 118.4 149.7 155.5 158.2
Net debt 9 21.9 26.9 16.7 23.6 33.8 22.1 17.8 9.5 16.1
8
Prior to the financial year ended 31 March 2006, long term investments were stated at cost less allowance for diminution
in value. With the introduction of FRS39 Financial Instruments: Recognition and Measurement during the financial year
ended 31 March 2006, available-for-sale financial assets (AFS) were required to be measured at fair value. At each reporting
date, AFS are remeasured at their fair value. Changes in fair value, other than impairment losses, are recognised in other
comprehensive income and presented in the fair value reserve in equity until the AFS are disposed. Impairment losses are
recognised in the income statement.
9
Total debt less cash and cash equivalents.
25Group Income Statements
In S$ million
For year ended 31 Mar 2004 2005 2006 2007 2008 2009 2010 2011 2012
Revenue 56,468 67,520 79,822 74,563 83,284 79,615 76,658 83,519 83,548
Cost of sales (37,659) (43,780) (53,309) (49,282) (53,290) (57,477) (50,679) (52,992) (56,306)
Gross profit 18,809 23,740 26,513 25,281 29,994 22,138 25,979 30,527 27,242
Other operating
income 5,874 4,099 9,391 8,370 15,870 16,198 4,518 4,855 6,285
Expenses:
Selling & Distribution (3,559) (3,939) (4,086) (4,278) (5,197) (5,042) (5,318) (5,758) (5,669)
Administrative (5,722) (7,003) (8,040) (8,104) (8,619) (8,068) (8,723) (7,322) (7,960)
Finance (1,724) (2,120) (2,415) (2,611) (3,207) (2,727) (2,432) (2,598) (2,586)
Other operating
expenses (4,164) (5,009) (4,805) (5,053) (8,681) (15,333) (9,937) (6,260) (7,138)
Profit before
share of results of
associated companies,
partnerships and
joint ventures 9,514 9,768 16,558 13,605 20,160 7,166 4,087 13,444 10,174
Share of results of
associated companies
and partnerships 1,472 1,410 1,163 (830) 3,187 1,333 2,374 2,604 3,009
Share of results of
joint ventures 787 1,037 1,263 1,566 2,182 1,870 2,013 1,727 1,580
Profit before
income tax 11,773 12,215 18,984 14,341 25,529 10,369 8,474 17,775 14,763
Income tax expense (2,050) (1,837) (2,518) (1,381) (3,055) (1,280) (1,682) (1,953) (1,395)
Profit from continuing
operations 9,723 10,378 16,466 12,960 22,474 9,089 6,792 15,822 13,368
Profit from
discontinued
operations – 31 67 16 – – – – –
Total profit 9,723 10,409 16,533 12,976 22,474 9,089 6,792 15,822 13,368
Profit attributable to:
Equity holder of
the Company 7,365 7,521 12,827 9,112 18,240 6,183 4,593 12,668 10,730
Non-controlling
interests 2,358 2,888 3,706 3,864 4,234 2,906 2,199 3,154 2,638
Total profit 9,723 10,409 16,533 12,976 22,474 9,089 6,792 15,822 13,368
26 Temasek Review 2012Group Financial Summary
Group Balance Sheets
In S$ million
As at 31 Mar 2004 2005 2006 2007 2008 2009 2010 2011 2012
Shareholder equity
before fair value
reserve 64,522 70,890 83,555 92,946 120,209 119,850 127,772 134,580 146,401
Fair value reserve 1
– – 7,075 21,012 23,849 (1,452) 21,971 20,900 11,765
Shareholder equity 64,522 70,890 90,630 113,958 144,058 118,398 149,743 155,480 158,166
Non-controlling
interests 23,862 25,325 25,412 24,447 25,786 22,555 23,409 24,062 23,495
88,384 96,215 116,042 138,405 169,844 140,953 173,152 179,542 181,661
Property, plant
and equipment 61,558 69,268 65,552 65,486 75,302 68,206 67,974 66,778 67,791
Intangibles 13,543 14,714 14,481 14,805 21,382 19,891 19,147 18,857 17,923
Investments
in associated
companies,
partnerships and
joint ventures 15,664 16,976 27,137 34,965 39,513 41,105 44,610 42,054 49,474
Financial assets 11,675 13,829 27,529 52,341 73,850 40,234 64,181 65,296 60,704
Investment
properties 8,159 7,848 1,817 3,632 5,035 5,331 6,535 7,144 7,854
Properties under
development 370 453 518 158 626 759 187 176 433
Other non-current
assets 6,488 8,266 9,972 10,446 9,393 9,505 10,241 11,302 10,650
Deferred tax assets 1,645 2,138 1,735 1,628 1,849 1,960 1,809 1,745 1,496
Net current
assets/(liabilities) 15,874 14,713 12,574 8,308 (3,130) 11,809 21,904 27,648 32,816
Current assets 61,695 65,614 64,987 58,979 68,568 60,958 70,109 84,559 86,311
Current
liabilities (45,821) (50,901) (52,413) (50,671) (71,698) (49,149) (48,205) (56,911) (53,495)
134,976 148,205 161,315 191,769 223,820 198,800 236,588 241,000 249,141
Non-current
liabilities (46,592) (51,990) (45,273) (53,364) (53,976) (57,847) (63,436) (61,458) (67,480)
88,384 96,215 116,042 138,405 169,844 140,953 173,152 179,542 181,661
1
Prior to the financial year ended 31 March 2006, long term investments were stated at cost less allowance for diminution
in value. With the introduction of FRS39 Financial Instruments: Recognition and Measurement during the financial year
ended 31 March 2006, available-for-sale financial assets (AFS) were required to be measured at fair value. At each reporting
date, AFS are remeasured at their fair value. Changes in fair value, other than impairment losses, are recognised in other
comprehensive income and presented in the fair value reserve in equity until the AFS are disposed. Impairment losses are
recognised in the income statement.
27Group Cash Flow Statements In S$ million For year ended 31 Mar 2004 2005 2006 2007 2008 2009 2010 2011 2012 Operating cash flow before working capital changes 13,936 16,854 18,661 17,557 21,213 14,072 16,428 20,177 16,835 Change in working capital (2,535) (4,353) 2,577 2,508 (287) 1,484 (4,155) (2,902) (1,655) Cash generated from operations 11,401 12,501 21,238 20,065 20,926 15,556 12,273 17,275 15,180 Income tax paid (1,151) (1,480) (1,558) (1,592) (1,942) (1,826) (1,260) (1,250) (2,022) Net cash inflow from operating activities 10,250 11,021 19,680 18,473 18,984 13,730 11,013 16,025 13,158 Net cash (outflow)/ inflow from investing activities (7,701) (4,765) (16,509) (23,344) (30,431) 95 (5,285) (4,888) (14,762) Net cash inflow/ (outflow) from financing activities 6,770 (4,793) (238) 2,259 13,277 (6,398) (196) (1,697) (1,415) Net increase/ (decrease) in cash and cash equivalents held 9,319 1,463 2,933 (2,612) 1,830 7,427 5,532 9,440 (3,019) 28 Temasek Review 2012
Group Financial Summary

Group Statements of Changes in Equity

In S$ million

                                                           Attributable to Equity Holder
                                                                        of the Company
                                                          Share
                                                         Capital               Currency       Non-
                                                      and Other    Revenue Translation controlling
                                                       Reserves     Reserve     Reserve   Interests            Total
Opening balance at 1 Apr 2011                            69,353       90,121      (3,994)   24,062          179,542
Total profit                                                       –       10,730         –       2,638       13,368
Others, net1                                               (5,225)        (2,496)     (323)     (3,205)     (11,249)
Closing balance at 31 Mar 2012                             64,128        98,355     (4,317)     23,495      181,661

Opening balance at 1 Apr 2010                              70,718         81,656    (2,631)     23,409      173,152
Total profit                                                       –       12,668         –       3,154       15,822
Others, net   1
                                                            (1,365)       (4,203)   (1,363)      (2,501)         (9,432)
Closing balance at 31 Mar 2011                             69,353         90,121    (3,994)     24,062      179,542

1
    Comprise movements during the financial year including but not limited to:
    – Issuance of ordinary shares;
    – Change in fair value of financial assets;
    – Dividends to shareholder;
    – Share of associated companies’ and joint ventures’ reserves; and
    – Currency translation differences.

                                                                                                                     29
Financing Framework
Our annual Temasek Review, credit ratings by international
agencies, and Temasek Bonds are public markers of our credit
quality and financial discipline.
We have been rated AAA/Aaa since 2004 by Standard & Poor’s Ratings
Services (S&P) and Moody’s Investors Service (Moody’s) respectively.
Our US$10 billion Global Guaranteed Medium Term Note (MTN) Programme
was launched in 2005.
As at 31 March 2012, there were 11 outstanding Temasek Bonds in
Singapore dollars, US dollars and British pounds sterling, issued with
tenors of up to 40 years. They totalled nearly S$10 billion1, with a
weighted average maturity of about 15 years.
We established our US$5 billion Euro-commercial Paper (ECP) Programme
last year to enhance our short end funding flexibility. Our total outstanding
ECP as of 31 March 2012 was over S$1 billion2, with a weighted average
maturity of about four months.
Our MTN Programme and all outstanding Temasek Bonds have been
assigned long term ratings of AAA/Aaa by S&P and Moody’s respectively.
Our ECP Programme has been assigned the highest short term ratings of
A-1+ by S&P and P-1 by Moody’s.
Our MTN and ECP Programmes provide us a cost effective, efficient and
flexible balance between long and short term funding.
Temasek Credit Ratings
Standard & Poor’s Moody’s
Ratings Services Investors Service
Corporate Credit Rating AAA Aaa
MTN Programme AAA Aaa
Temasek Bonds AAA Aaa
ECP Programme A-1+ P-1
1
Approximately US$8 billion as at 31 March 2012.
2
Approximately US$1 billion as at 31 March 2012.
30 Temasek Review 2012Financing Framework
Temasek Bonds – Issue Profile
Yield at
Tenor Coupon Issuance Issue Maturity
Bond Series Currency Billions (years) (%) (%) Date Date
T2015-US$ USD 1.75 10 4.5000 4.5750 21 Sep 05 21 Sep 15
T2019-US$ USD 1.5 10 4.3000 4.3280 26 Oct 09 25 Oct 19
T2039-US$ USD 0.5 30 5.3750 5.4410 23 Nov 09 23 Nov 39
T2020-S$ SGD 1.0 10 3.2650 3.2650 19 Feb 10 19 Feb 20
T2025-S$ SGD 0.5 15 3.7850 3.7850 5 Mar 10 5 Mar 25
T2029-S$ SGD 0.3 20 4.0000 4.0000 7 Dec 09 7 Dec 29
T2035-S$ SGD 0.5 25 4.0475 4.0475 5 Mar 10 5 Mar 35
T2039-S$ SGD 0.3 30 4.2000 4.2000 7 Dec 09 7 Dec 39
T2050-S$ SGD 1.0 40 4.2000 4.2000 2 Aug 10 2 Aug 50
T2022-£ GBP 0.2 12 4.6250 4.6620 26 Jul 10 26 Jul 22
T2040-£ GBP 0.5 30 5.1250 5.1550 26 Jul 10 26 Jul 40
Temasek Bonds – Issue Size and Coupon
6
5.3750%
5
4.5000% 4.6250% 5.1250%
4.3000%
4
4.0475% 4.2000% 4.2000%
4.0000%
Coupon (%)
3.7850%
3 3
Issue Size (S$b) 3
3.2650%
2.2
2 1.9 2
1 1.0 0.9 1.0 1.0 1
0.3
0.4 0.5 0.5
0.3 0.6
0 0
2012 2015 2019 2020 2022 2025 2029 2035 2039 2040 2050
Year of Maturity
USD Bond O SGD Bond GBP Bond
3
Exchange rates as at 31 March 2012.
31Extending
Our Portfolio
Investment Framework 34
Wealth Added Framework 38
Investment Highlights 39
“We seek to protect and create
value across generations.”
Klaus Lucke, Managing Director, Risk Management
Photo (left to right):
Zyn Toh, Associate Director, Investment;
Eric Yi, Associate Director, China;
Camie Yu, Associate Director, Investment.
33Investment Framework
Temasek was formed in 1974 to manage investments
commercially, including the possibility of investing overseas.
In the early years, Temasek and our portfolio companies grew in tandem
with a transforming Singapore.
Over the last 10 years, we actively extended our investment scope to grow
with an emerging Asia, much like a reprise of our growth with Singapore,
except on a much larger canvas of some four billion people.
Four themes guide our investments:
• Transforming Economies
• Growing Middle Income Populations
• Deepening Comparative Advantages
• Emerging Champions
Our portfolio balance is now approximately 70:30 between Asia and other
regions. Our underlying exposure to Singapore has been about one third
over the last five years, compared to a predominantly Singapore portfolio
before 2002. Part of this is due to the success of our portfolio companies
in regionalising or globalising their own businesses, such as SingTel in Asia,
and PSA in Asia and Europe.
New investments made since 2002, when we stepped up our exposure
in Asia, delivered annualised returns of over 18% to Temasek, while
investments held as at March 2002 delivered 11% annualised over the
last 10 years.
Portfolio Market Value1 10-year Annualised S$ Returns to Temasek1
S$198b
S$107b O Investments
made after 18%
31 March 2002
S$91b O Investments
held as at 11%
31 March 2002
1
As at 31 March 2012.
34 Temasek Review 2012Extending Our Portfolio
Investing for the Future
We aim to deliver sustainable returns over the long term.
We track total returns to our shareholder over various time periods, as well We focus on intrinsic
as our returns above internal risk-adjusted hurdles. These are reported in value and have the
our Temasek Review, along with other portfolio and financial highlights. flexibility of taking
concentrated
As an investor, we focus on intrinsic value and have the flexibility
positions.
of taking concentrated positions.
As a shareholder, we engage our portfolio companies to share strategic
perspectives, foster robust governance and encourage a strong culture of
co-ownership, excellence and integrity. The boards and management of We maintain full
our portfolio companies are responsible for their strategies as well as day flexibility to shift the
to day operations and commercial decisions. weight of our portfolio.
We maintain full flexibility to shift the weight of our portfolio at any time,
and may stay liquid in anticipation of opportunities ahead.
From time to time, we co-invest with like-minded partners to share
opportunities and perspectives.
Over the next 10 years, as the world addresses its imbalances, we will
extend our capabilities and continue our role as an active investor, with
particular interest in energy, resources, technology, consumer and other
middle income needs.
Value Creation Framework
Evaluating our investments Managing our portfolio Maximising our value
• Test against intrinsic value • Risk-adjusted returns • Test against intrinsic value
• Maintain flexible stance • Sound governance • Buy/sell
• Optimise leverage • Capable leadership • Trade/swap
• Create optionality • Operational excellence • Rationalise/restructure
• Mitigate risks • Human capital • Develop optionalities
• Competitive strategy • Co-invest
• Monitor
35Investment Framework continued
Simulation of Returns over 20 Years
Based on our projections of various global economic and market
parameters, we have simulated the relative likelihood of annual returns
over the next 20 years for an equities portfolio mimicking a Temasek
thematic portfolio mix1. This is known as Annual Returns.
The Annual Returns likelihood distribution curve shows that a Temasek
thematic portfolio has a higher likelihood of higher returns in any given year
compared to a generic global equity portfolio.
The Annual Returns for a predominantly equities portfolio, whether for a
generic global equity portfolio or for a Temasek thematic portfolio, can vary
widely with positive and negative outcomes year to year, though with a bias
towards positive returns annually.
The same methodology may also be applied to simulate the likelihood of
returns at the end of 20 years. This is known as Geometric Returns, or
Annualised Compounded Returns. It provides a sense of the long term
returns of a Temasek thematic portfolio compared to a generic global
equity portfolio.
Compared to the range of year to year Annual Returns over 20 years, the
Geometric Returns at the end of 20 years has a much tighter range of likely
outcomes. The simulations also show a much higher likelihood of a positive
annualised compounded return at the end of 20 years, with a moderate
likelihood of a negative outcome.
These simulations are not definitive, but are indicative of the potential
outcomes over 20 years for an underlying economic scenario where the
portfolio mix is not actively changed.
This simulation tool is being developed further to help assess the long term
impact of changing the portfolio character or mix. It can be used to simulate
the effects of alternative economic scenarios as well.
1
The Temasek thematic portfolio assumes the same country and sector mix in broad terms
as Temasek portfolio as at 31 March 2012.
2
Horizontal axis: same scale; vertical axis: different scale.
36 Temasek Review 2012Extending Our Portfolio
Illustrative Likelihood of Annual Returns over 20 Years
Lower likelihood of
lower positive returns
Less likelihood of
Relative Likelihood 2
negative returns
Greater likelihood
of higher returns
– ve 0 + ve
Annual Portfolio Returns (%) 2
Global equity portfolio
Thematic portfolio
Illustrative Likelihood of Geometric Returns or Annualised Compounded 20-year Returns
Relative Likelihood2
– ve 0 + ve
Annualised 20-year Portfolio Returns (%)2
Global equity portfolio
Thematic portfolio
37Wealth Added Framework
We aim to deliver sustainable returns above our internal
risk-adjusted hurdle.
This drives our investment strategy, capital allocation, performance
management and incentive framework.
Wealth Added (WA), or excess returns, measures our returns above a
risk-adjusted cost of capital hurdle that takes into account the capital we
use and the risk premiums associated with our investments.
Investments in riskier sectors or geographies will be measured against
higher risk-adjusted hurdles.
When we deliver returns above our risk-adjusted hurdle, we have a positive
bonus pool to distribute, part of which is deferred to future years. When we
deliver returns below our risk-adjusted hurdle, we share a negative bonus
pool. This means a clawback of deferred bonuses from prior years.
To compute WA for our shareholder, we use the opening market value of
our portfolio at the start of a financial year, as the capital employed. This is
adjusted for any net capital movements such as dividends to shareholder or
capital received.
We also account for the changes in our recurring operating costs taken
in perpetuity.
Delivering Sustainable Returns over the Long Term
Investment
Strategy
Wealth Added
Incentive Delivering Capital
Framework Sustainable Returns Allocation
over the Long Term
Performance
Management
38 Temasek Review 2012Extending Our Portfolio
Investment Highlights
Over the last 10 years, Temasek actively extended its
portfolio to the rest of Asia, from one which was predominantly
in Singapore.
We invested S$139 billion and divested S$87 billion over the same period.
As at 31 March 2012, our exposure to Asia ex-Singapore was 42%, tapping
on the dynamic transformation of the region, while Singapore exposure
remained a steady one third of our portfolio.
Last financial year, we invested S$22 billion and divested S$15 billion,
resulting in net new investments of S$7 billion, compared to around
S$4 billion in each of the previous two years.
Our investments in the major Chinese banks are long term proxies
to the broader growing Chinese economy and its expanding middle
income population.
In November last year, we increased our H-share1 stake in S$139b
China Construction Bank (CCB)2 to 9.4%. Post March 2012, we Investments
invested in Industrial and Commercial Bank of China (ICBC)3 and since 2002
rebalanced our stakes in CCB4 and Bank of China (BOC)5.
Other investments in China included S$190 million in Citic Securities,
the largest securities firm in China. In April 2012, we invested in
Kunlun Energy, a Hong Kong listed subsidiary of PetroChina involved
in the crude oil and natural gas sector in China.
S$87b
Divestments
Elsewhere in Asia during the year, we invested S$180 million in Godrej since 2002
Consumer Products, a leading consumer company in India, and S$70 million
in exchangeable bonds issued by Hoang Anh Gia Lai Corporation in Vietnam.
1
Hong Kong listed shares are commonly known as H-shares, while shares listed in
Shanghai are known as A-shares.
2
The 9.4% H-share stake in CCB was about 9.1% of its total shares outstanding,
including the Shanghai listed A-shares.
3
Our 6.0% H-share stake in ICBC in May 2012 was about 1.5% of its total shares
outstanding, including the Shanghai listed A-shares.
4
Our 7.4% H-share stake in CCB in May 2012 was about 7.2% of its total shares
outstanding, including the Shanghai listed A-shares.
5
Our 3.7% H-share stake in BOC in May 2012 was about 1.1% of its total shares
outstanding, including the Shanghai listed A-shares.
39Investment Highlights continued
In June 2011, we partnered with Khazanah Nasional Berhad to form a 40:60
joint venture, M+S Pte Ltd, to develop landmark projects in Singapore’s
Marina South and Ophir-Rochor. Separately, Pulau Indah Ventures Sdn Bhd,
a 50:50 joint venture between Temasek and Khazanah, will develop two
wellness-related projects in Iskandar Malaysia, Johor.
In Singapore, we invested an additional S$280 million in Olam, a global
supply chain manager and processor of agricultural products and food
ingredients, and participated in the rights issue of Tiger Airways.
We made net investments of S$4 billion in the energy and resources
sector last year. This helped to increase our exposure to North America
from 5% to 7%.
In the energy sector, we invested in convertible notes of Clean Energy
Fuels, the largest alternative transportation fuel provider in North America,
in August 2011. This was followed in May 2012 with an investment of
almost S$300 million in Cheniere Energy, the first USA company with
approval to export natural gas to the USA’s Free Trade Agreement partners
such as Singapore and Korea.
We converted over S$600 million of previously issued subscription receipts
of Inmet Mining into common shares in May 2011. Another resources
investment was S$1.3 billion in The Mosaic Company, a leading potash
and phosphate producer with assets in the USA and Canada.
Investments in biotechnologies included S$60 million in Portola
Pharmaceuticals, a late-stage drug development company.
During the year ended March 2012, new investments in Latin America
included a S$126 million commitment to Integradora de Servicios Petroleros
Oro Negro, an offshore oil and gas services company in Mexico, as well as
S$20 million in Hidrovias do Brasil, a fluvial navigation and port company in
Brazil and Uruguay. We added another S$20 million to our earlier investment
in Amyris Biotechnologies. In May 2012, we made a S$160 million
S$4b investment in the eighth largest bank in Mexico, Banco del Bajio.
Our partnership with the Oppenheimer family to set up Tana Africa Capital,
Net investments in
extended our interest in the consumer and agriculture sectors to Africa.
energy and resources
Last year, key divestments included Avago Technologies, PT Chandra Asri
Petrochemical, Hutchison Port Holdings Trust, ICICI Bank, Invida Group and
Kaisa Group Holding.
40 Temasek Review 2012Extending Our Portfolio
We issued two Zero Coupon Temasek Exchangeable Bonds. One is a
S$790 million issue due October 2014, exchangeable for ordinary shares
of Standard Chartered PLC, and the other a S$500 million issue due
December 2013, exchangeable for ordinary shares of Li & Fung Limited.
Over the last few years, we methodically laid the ground to extend our
exposure beyond equities. As at end March 2012, we had a S$600 million
gross notional exposure to put and call options that reflected our longer
term interest in their underlying equities. We also added some S$1.3 billion
in funds which focused on credit opportunities. We do not engage in any
naked short positions as a matter of policy.
Investment Outlook
Urbanisation and other middle income needs underpin the long term
prospects of Asia and other growth markets, even as the mature economies
Middle income needs
seek a new balance.
underpin the long term
The OECD estimated that China and India will account for more than prospects of Asia and
50% of global middle income consumption by 20501. The economic drivers other growth markets.
for commodities, energy and resources will complement the demand for
consumer goods and services, including technology and biotechnology
products and services.
However, we see headwinds over the next 12–24 months, principally from
the growing European sovereign and Eurozone risks. Geopolitical risks will
be heightened by economic stress and austerity measures. Monetary easing
in the developed economies continues to add to longer term risks of inflation
in Asia and Latin America.
Beyond near term European stress, we see structural challenges in key
growth economies like China and India over a five to 10 year horizon.
Excessive borrowing in the USA may come home to roost further out,
perhaps in the next decade.
Overall, we remain optimistic on the longer term potential of Asia and
other growth markets, provided structural imbalances and policy risks
are contained. Notwithstanding their near term challenges, Europe and
the USA continue to have the depth and breadth of market opportunities
in the years ahead.
We retain the full flexibility to either step up our investment pace or remain
appropriately liquid, depending on the risks and opportunities ahead.
1
The Emerging Middle Class in Developing Countries, by Homi Kharas, Working Paper
No. 285, OECD Development Centre, January 2010.
41Shaping Our
Institution
Governance Framework 44
Board of Directors 52
Senior Management 54
Risk Framework 57
MERITT Values 62
Compensation Framework 63
The Temasek Heartbeat 66
“Ownership is a mindset;
investing is a skill set.”
Jeffrey Fang, Associate Director, Corporate Affairs
Photo:
Lim Ming Pey, Director, Leadership
Development & Compensation,
with her daughter, Chua Rei Anne
and son, Chua Rei Shin.
43Governance Framework
Temasek is a commercial investment company governed by the
provisions of the Singapore Companies Act.
We own and manage our assets with full commercial discretion and
flexibility under the guidance of our Board, including investment, divestment
and business decisions.
Temasek is also one of the three key Singapore companies with additional
safeguards enshrined in the Singapore Constitution to separately protect our
past reserves.
Under Singapore’s Constitution and laws, neither the President of Singapore
nor the Government is involved in our investment, divestment or other
business decisions, except in relation to the protection of Temasek’s
past reserves.
Our governance framework emphasises substance over form, and long term
over short term. It provides for accountability and a robust balance between
empowerment and compliance.
We espouse the principles of commercial discipline, built on our set of
MERITT values, namely: meritocracy, excellence, respect, integrity,
We declare dividends teamwork and trust.
annually to our
shareholder and Our commitment to deliver sustainable long term value is supported by an
pay taxes. incentive philosophy to align our staff as co-owners over the medium and
long term.
Relating to Our Shareholder
Temasek is a Singapore exempt private company1 incorporated on
25 June 1974 and wholly owned by the Minister for Finance2. Subject to
the President’s concurrence, our shareholder has the right to appoint,
remove or renew Board members.
We provide annual statutory financial statements audited by an international
audit firm, as well as periodic updates to our shareholder. While exempted
from disclosing any financial information publicly, we have chosen to publish
our Group Financial Summary and portfolio performance in our annual
Temasek Review since 2004.
1
Under the Singapore Companies Act (Chapter 50), an exempt private company has no
more than 20 shareholders and no corporate shareholder, and is exempted from filing its
audited financials with the public registry.
2
Under the Singapore Minister for Finance (Incorporation) Act (Chapter 183), the Minister
for Finance is a body corporate.
44 Temasek Review 2012Shaping Our Institution
We declare dividends annually, balancing distributions to our shareholder
and retention of returns for reinvestments to generate future returns. As a
commercial investment company, we pay taxes to the Singapore Government. We own and manage
our assets with full
Relating to the President commercial discretion
and flexibility.
The President of Singapore has an independent custodial role to safeguard
Singapore’s critical assets and past reserves.
Temasek3 is designated a Fifth Schedule Company4 under the Singapore
Constitution, with a constitutional responsibility to separately safeguard
our past reserves5.
Reserves accumulated by Temasek before the term of the current
Government form our past reserves. Current reserves are primarily profits
accumulated after a newly elected government is sworn into power.
The midnight before the current Singapore Cabinet was sworn in
on 21 May 2011 marked the cut-off between Temasek’s past and
current reserves.
Our Chairman and CEO certify our Statement of Reserves and Statement
of Past Reserves to the President at prescribed intervals as part of our
responsibility to protect our past reserves.
In addition to its normal fiduciary duties, our Board is accountable to the
President to ensure that every disposal of investment is transacted at fair
market value.
We are required by the Singapore Constitution to seek the President’s
approval before a draw occurs on Temasek’s past reserves.
Protecting Past Reserves
There is no draw
on past reserves
when total reserves
exceed past reserves.
Past Total
Reserves Reserves
3
Temasek Holdings (Private) Limited.
4
Other Fifth Schedule entities include Government of Singapore Investment Corporation
Pte Ltd, which manages the reserves of the Singapore Government, and selected
statutory boards involved in managing critical assets, such as the Central Provident
Fund (CPF) Board and the Monetary Authority of Singapore.
5
Temasek does not manage the CPF savings, foreign exchange reserves of Singapore,
or the reserves of any other Fifth Schedule entity. Each Fifth Schedule entity is managed
independently, and is separately accountable to the President through its own board and
CEO for the protection of its own past reserves.
45You can also read