FALL 2020 - National Bank of Commerce
←
→
Page content transcription
If your browser does not render page correctly, please read the page content below

FALL 2020
 O V E R V I E W

REGIONAL ECONOMIC
INDICATORS FORUM
The Regional Economic Indicators
Forum (REIF), sponsored by the
National Bank of Commerce, focuses
on the current economic performance
of a 15-county region that includes
Northeastern Minnesota and
Northwestern Wisconsin. As part of this forum, the College of
St. Scholastica (CSS), University of Minnesota-Duluth (UMD) and
University of Wisconsin-Superior (UWS) collect and monitor data
related to county-level economic performance, business and
consumer confidence, and regional stock performance.

THE GOAL OF THE FORUM IS TO
• S upport business owners in their business decisions by
    gathering key local economic indicators and trend information
• Develop specific economic indicators for this region that are
    not readily available to decision makers
• Develop tools to study our region’s progress in economic growth,
    prepare baseline measures that allow for comparison and assess
    future progress
• Track the region’s participation in the “new economy” and
    development in the high-tech arena
• Collect and monitor data related to county-level economic
    performance, business and consumer confidence and regional
    stock performance
• Bring professionals together with business owners for
    discussion about the local economy and related critical issues
    in a collaborative, non-political environment
•C   reate a business recruitment and retention tool by publishing
    the information
SPEAKER
     RON WIRTZ
Director of Regional Outreach at the
Federal Reserve Bank of Minneapolis

 Ron Wirtz is the Regional Outreach Director for the Federal Reserve Bank
 of Minneapolis. Ron’s primary responsibilities involve tracking current
 business conditions across the six-state Ninth Federal Reserve District,
 which includes Michigan’s Upper Peninsula, northwest Wisconsin,
 Minnesota, the Dakotas and Montana. Ron tracks activity in employment
 and wages—which are central to the Federal Reserve’s dual mandate of
 promoting stable prices and maximum employment – along with
 construction, real estate, tourism and consumer spending. Part of Ron’s
 work includes extensive outreach to business and community leaders,
 and he gives frequent speeches on Ninth District regional economies.

 Ron is a contributor to the Beige Book, which is a report of current
 business conditions published by the Federal Reserve System every six
 weeks. Previous to this position, Ron was the editor of the Fedgazette,
 a regional business and economics journal published by the Minneapolis
 Fed. Here, he conducted in-depth research on such topics as labor
 markets and job growth, health care consolidation, the Bakken oil boom,
 income mobility, disability, and public pensions.

                                          ©2020 REIF — NATIONAL BANK OF COMMERCE | PAGE 2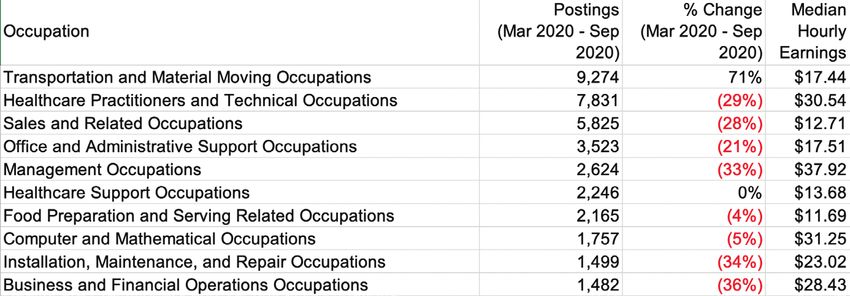
EXECUTIVE SUMMARY

  Twice each year, students from the University of Minnesota-Duluth (UMD), the University of
  Wisconsin-Superior (UWS), and the College of St. Scholastica (CSS) join efforts to conduct research on
  the economic performance of the 15-county region surrounding the Twin Ports (the REIF region).
  This summary provides information on the results of the three schools’ research, including a special
  focus on the workforce of the Twin Ports region, a glimpse into local consumer confidence, an analysis
  of regional stock performance, and survey results on business confidence and hiring practices.

  UMD’s research team analyzed recent data on the region’s labor force, unemployment rates, and job
  postings to learn more about the impacts from COVID-19 on the area’s economic performance. Prior to
  the COVID-19 outbreak, the region was experiencing fairly normal seasonal fluctuations in its
  unemployment rate, ranging between 3% and 6%. In April of 2020, the unemployment rate spiked to
  13.5%. Since the initial spike, unemployment rates have declined consistently, most recently falling
  to 7.8% in August 2020. However, some of the decline in unemployment rates can be explained by a
  decline in the size of the labor force since April. While there is significant variation among the counties’
  rates, it does not appear that either state is seeing significantly higher unemployment rates than the
  other. While most businesses are reducing the number of job postings due to the economic downturn,
  transportation and material moving occupations have seen an increase in the number of postings
  between March and September (71%).

  Two UWS student research teams conducted research for the forum. The first team, consisting of 19
  students, surveyed randomly chosen households in the 15-county REIF region to determine the
  consumer confidence indicators, especially as it relates to the current pandemic. Surveys were
  collected via telephone (142 in fall 2020) and via email to previous REIF participants (67 in fall 2020).
  Using survey responses, three indices were computed: Index of Consumer Sentiment (ICS), Index of
  Current Conditions (ICC), and Index of Consumer Expectations (ICE). Survey results in fall 2020 show
  that compared to spring 2020, the general public and REIF participants overall had a strong negative
  outlook about the current condition of the regional economy. The downward sentiments and
  expectations about the future of the economy are likely connected to the COVID-19 health and
  related economic crisis.

  The second UWS research team tracked the equity performance of companies of local interest in the
  15-county region to create a Regional Equity Index (REI). The selection of the firms for the Regional
  Equity Index (REI) is based on the firms’ substantial presence in the REIF region as indicated by the
  number of employees hired locally or by the significance of the firms’ regional activities to the REIF
  regional economy. Using these selection criteria, fifteen firms are included in the index. The findings
  show that the REI outperforms the benchmark index and that investors have mixed expectations for the
  majority of the stocks. Between October 2018 and October 2020, the REI has trended somewhat with
  the market in a downward direction, but it has significantly outperformed relative to the S&P 400 during
  the period. According to the Value Line® short-term expectations of future performance, most of the
  fifteen stocks in the REI are expected to outperform or mirror the overall stock market. Long term, three
  of the stocks are expected to outperform the market, seven are expected to mirror the market, and five
  are expected to underperform the market.

PAGE 3 | ©2020 REIF — NATIONAL BANK OF COMMERCE

The research team at CSS distributed surveys to local Chambers of Commerce members to develop
a better understanding of business confidence in the regional economy. In total, 74 businesses
completed the survey. In a downturn from previous years, 30% of respondents reported improved
business activity during the last six months as compared to 38% in March 2020, and 45% reported
decreased activity (up from 15%). Employers are having less difficulty finding qualified candidates,
but willing candidates are still in short supply. Looking forward, 34% were confident that business
activity would improve in the next six months (down from 51% last spring), and 25% expected
decreases in activity (up from 12% last spring). Expectation of increasing profits fell from last spring,
with only 21% predicting increasing profits and 36% expecting decreases in profits.

                              STUDENT PRESENTERS
                   Nathan Brand is a senior at UMD double majoring in Economics and Financial
                   Markets. Nathan has been working as an Undergraduate Research Assistant at the Bureau
                   of Business and Economic Research (BBER) since fall of his sophomore year. Beyond the
                   BBER, Nathan is involved in UMD’s Financial Markets Program and Investment Club, and
                   he serves as President of the Economics Club. Nathan interned remotely at Wells Fargo and
                   will be joining full time post-graduation. Long term he would like to work for the Federal
                   Reserve, specifically analyzing monetary policy.
                   Grant Garding is a University of Wisconsin-Superior (UWS) junior double majoring in
                   Economics and Finance. He is a member of the Stimulus Club on campus as well as the
                   SBE Event Planning Committee. He joined the REIF team in order to further his experience
                   and knowledge of the local economy. After graduation, Grant is interested in working as
                   a financial or credit analyst.

                   Michael Huttner is a senior at the University of Wisconsin-Superior (UWS) who is
                   majoring in Economics and History. Michael has been working with the UWS REIF team
                   since fall of 2018. He was awarded a UWS Summer Undergraduate Research Fellowship
                   in 2019 to research the “Economics of Community Engagement: Non-Profit vs. For-Profit
                   Hospitals.” Michael is seeking future employment after his graduation in spring 2021.

                   Krista Heller is a senior at The College of Saint Scholastica (CSS), pursuing a major in
                   Accounting and a minor in Data Analytics. She joined the REIF to further her knowledge of
                   data analytics and the local economy and is serving as CSS’s head student researcher this
                   fall. Krista currently works for the college’s Stender School of Business and Technology and
                   worked as a community volunteer income tax preparer last spring. She graduates this fall
                   and plans to work in public accounting.

      Student presentations can be viewed at https://bit.ly/2I2ChQ1

                                                              ©2020 REIF — NATIONAL BANK OF COMMERCE | PAGE 4
UNIVERSITY OF MINNESOTA - DULUTH
                 HEALTH OF THE REGIONAL ECONOMY
  Monica Haynes, M.S., Director of the Bureau of Business and Economic Research (BBER)
  Student Researcher: Nathan Brand

  To provide greater insight into the recent changes to the regional economy as a result of COVID-19, UMD
  was asked to analyze secondary data for the 15-county REIF region. Specifically, UMD analyzed labor force,
  unemployment rates by county and by industry, as well as job postings by occupation. For reference, the
  labor force includes everyone in the region (16 years and older) who is employed or unemployed and
  actively seeking work. Unemployment rates measure the percentage of people unemployed who are looking
  for work. Job postings measure each unique job posting that we have gathered within the 15-county region.
  Labor force and unemployment data was collected from Local Area Unemployment Statistics (LAUS), while
  job posting data was collected from Economic Modeling Systems, Inc. (EMSI).

  Figure 1 shows the unemployment rate for the 15-county region (red line) from August 2018 to August 2020
  along with the size of the labor force (blue area). As shown in the figure, prior to the COVID-19 outbreak, the
  region was experiencing fairly normal seasonal fluctuations in its unemployment rate, ranging between 3%
  and 6%. In April of 2020, the unemployment rate spiked to 13.5% in response to the COVID-19 pandemic
  and the state’s corresponding lockdown. Since the initial spike in April, unemployment rates have declined
  consistently, most recently falling to 7.8% in August 2020.

  During the same two-year period, the labor force of the 15-county region declined by roughly 1.5%, from
  nearly 242,000 in August of 2018 to just over 238,200 in August of 2020. This decline in the size of the labor
  force is partially responsible for the sharp decline in unemployment rates that have occurred since April.
  Many discouraged workers may have given up searching for jobs, thus they have exited the labor force.

  Since the initial spike in April 2020, unemployment rates have declined consistently, most
  recently falling to 7.8% in August 2020.

  Figure 2 shows unemployment rates for each county in the 15-county REIF region, as of August 2020.
  As shown in the figure, Iron County, Wisconsin, had the highest unemployment rate at 10.6%, while Pine
  County, Minnesota, had the lowest unemployment rate at 4.5%. While there is significant variation among
  the counties’ rates, it does not appear that either state is seeing significantly higher unemployment rates
  than the other.

  Finally, Table 1 shows the top ten occupations with the most job postings in the REIF region between March
  and September 2020 along with the number of unique job postings during the six-month period, the
  percentage change in the number of postings from March to September, and the median hourly wage of
  each occupation. Transportation and material moving occupations have seen the largest number of postings
  overall during the six-month period, and they are the only listed occupation that has seen an increase in
  the number of postings during the six months (71%). According to IBISWorld, the recent increase in
  transportation jobs is the result of increased ecommerce combined with increased regulation in the trucking
  industry. Of the most-posted jobs, management, computer and mathematical, and healthcare practitioner
  occupations had the highest hourly wages with each having median earnings over $30 dollars/hour.

PAGE 5 | ©2020 REIF — NATIONAL BANK OF COMMERCE
Unemployment Rate and Labor Force

250                                                                                                13.5%                    14%

                                                                                                                            12%
245
                                                                                                                            10%
                                                                                                                    7.8%
                                                                                                                            8%
240
                                                                                                                            6%

        3.5%                                                                                                                4%
235
                                                                                                                            2%

230                                                                                                                      0%
 August 2018     November      February     May 2019     August 2019    November       February      May 2020   August 2020
                   2018          2019                                     2019           2020
                                        Labor Force (Thousands)          Unemployment Rate

FIGURE 1. Unemployment rates spiked in April 2020 due to the COVID-19 pandemic, while the labor force shrunk
Source: LAUS, 2020

                                     Unemployment Rates by County

              Iron, WI                                                                                           10.6%
        Douglas, WI                                                                                8.6%
          Itasca, MN                                                                               8.6%
     Saint Louis, MN                                                                        7.9%
         Carlton, MN                                                                       7.8%
          Burnett, WI                                                                   7.4%
        Ashland, WI                                                                     7.4%
           Aitkin, MN                                                                  7.3%
         Sawyer, WI                                                                   7.2%
    Koochiching, MN                                                                 7.0%
         Bayfield, WI                                                              6.9%
            Lake, MN                                                             6.7%
           Cook, MN                                                           6.2%
      Washburn, WI                                                     5.4%
            Pine, MN                                          4.5%

FIGURE 2. While there is a large range in unemployment rates among counties, neither state is seeing significantly higher
unemployment rates than the other Source: LAUS, 2020

                            Top Job Postings (March - September 2020)

TABLE 1. Of the top ten jobs, only transportation-related occupations saw an increase in the number of postings between March
and September Source: EMSI, 2020
                                                                       ©2020 REIF — NATIONAL BANK OF COMMERCE | PAGE 6
UNIVERSITY OF WISCONSIN - SUPERIOR
               CONSUMER CONFIDENCE INDICATORS
  Rubana Mahjabeen, Ph.D., Associate Professor of Economics, Praopan Pratoomchat, Ph.D., Assistant
  Professor of Economics
  Student Researchers: Munkhtulga Amarsanaa, Joseph Cummings, Grant Garding, Lindsay Hagfors, Ulrik
  Lager, Thao Le, Ryan Lovaas, Ririko Miura, Samuel Myszka, Kento Nomura, AJ Olson, Chiyono Owa, Mackenzie
  Reykdal, Jade Roatch, Ramesh Shrestha, Ismael Tounkara, Augusto Vladusic, Ryan Volz and Sam Waylee Jr.

  To equip decision-makers with tools enabling them to anticipate the forthcoming fluctuations in the
  economy, economists developed consumer confidence indicators. These are composed of three indices: Index
  of Consumer Sentiment (ICS), Index of Current Conditions (ICC), and Index of Consumer Expectations (ICE).
  Generally speaking, the ICS is designed to gauge consumers’ attitudes towards the business environment,
  personal finances, and consumption spending. The ICC is designed to gauge the current state of the
  economy. The ICE is used for business cycle forecasting, as it reflects the consumers’ outlook on future
  economic and financial conditions. In order to construct these indicators, the University of Wisconsin-
  Superior student research team surveyed households in the 15-county REIF region. Among randomly chosen
  households, 142 responded in fall 2020 via telephone surveys, while among previous REIF participants, 67
  responded in fall 2020 via email surveys. For details on the methodology and survey questions click here.

  Data was collected during September and October 2020 when the regional economy was experiencing a
  surge in the coronavirus cases. The results of the 15-county regional consumer confidence indices based on
  phone and email surveys are presented in Figure 3 and 4 respectively. These results show that in fall 2020 for
  both randomly chosen households and REIF participants all three indices are facing a downward trend. Both
  groups thought the current state of the economy is weak, and they had strong negative sentiment about
  the regional business conditions. As shown in Figure 3, this is the first time ICS and ICC have fallen below
  the base year (fall 2013) value. Among the three indices, ICE is experiencing less downward pressure, which
  shows that consumers are somewhat less pessimistic about the future of the economy. Compared to fall
  2019, both random households and REIF participants displayed negative sentiments about personal finance
  and consumption spending. Regarding future expectations, REIF participants (Figure 4) —as opposed to the
  random public—are more concerned about the future economic conditions (Figure 3) of the REIF region.

  When compared to the year-to-year changes in national consumer confidence indicators reported by the
  University of Michigan, the direction of index changes match with our findings on the regional consumer
  confidence indicators (Table 2). However, national indices show a larger downturn as opposed to those
  of the REIF region. The negative trends of the regional and national indices captured the health and
  economic struggle households have been experiencing due to the COVID-19 pandemic.

  Compared to fall 2019, both random households and REIF participants displayed negative
  sentiments about personal finance and consumption spending.

  The research focus for the fall 2020 REIF was the pandemic. In questions regarding consumer confidence
  during the pandemic, the majority of the respondents of both consumer groups feels uncomfortable visiting
  stores and is spending less than the pre-pandemic levels. While there is a rise in remote working, some
  households are experiencing reductions in pay and/or working hours at their jobs in the REIF region.

PAGE 7 | ©2020 REIF — NATIONAL BANK OF COMMERCE
PUBLIC SURVEY (RANDOM SAMPLE)
Consumer Confidence Indicators—Random
P UBLI C S URV E Y ( RANDO M S AMP LE )
ICS ICC ICE
108
ICS ICC ICE
106
108
104
100.78
102 106
100
99.33
98 104 97.18
96
F13
F14
F15
F16
F17
F18
F19
F20
S14
S15
S16
S17
S18
S19
S20
102
FIGURE 3. Among REIF households, the ICC100
and ICS are strongly positive, while the ICE is slightly down.
Source: UWS Consumer Confidence Survey F1 3 S 1 4 F1 4 S 1 5 F1 5 S 1 6 F1 6 S 1 7 F1 7 S 1 8 F1 8
SURVEY OF REIF PARTICIPANTS
Consumer( NConfidence
O N - R A N D O MIndicators—Non-Random
SAMPLE)
P UBLI C S URV E Y ( RANDO
ICSM S AMP
ICCLE ) ICE
107 ICS ICC ICE
105 91.30
103
101
99 89.79
97
95
93
88.77
91
89
87
F14 S15 F15 S16 F16 S17 F17 S18 F18 S19 F19 S20 F20
FIGURE 4. REIF participants showed a positive outlook on personal finances, business conditions, and consumption spending.
Source: UWS Consumer Confidence Survey
S14 F1 4 S15 F1 5 S16 F1 6 S17 F1 7 S18 F1 8 S19 F1 9 F2 0
Consumer Confidence Indicators
Random Public Past REIF National Consumer
Indicators Phone Survey Participants Confidence Indicators
(Fall 2019-Fall 2020) (Spring 2019-Spring 2020) (Oct 2019- Oct 2020)
Index of Consumer
-2.84 -6.23 -15.00
Sentiment
Index of Current
-5.07 -7.76 -25.00
Conditions
Index of Consumer
-1.33 -5.11 -6.40
Expectations
TABLE 2. National indices show a larger downturn compared to the consumer indices for the REIF region.
Source: UWS Consumer Confidence Survey and Survey of Consumers by the University of Michigan.
©2020 REIF — NATIONAL BANK OF COMMERCE | PAGE 8UNIVERSITY OF WISCONSIN - SUPERIOR
REGIONAL EQUITY INDEX
Sakib Mahmud, Ph.D., Associate Professor of Sustainable Management and Economics,
David Koslowsky, Ph.D., Assistant Professor of Finance
Student Researchers: Michael Huttner, Sajid Chowdhury, Ramesh Shrestha, and Pontus Tavemark
For this portion of the research, UWS provides information and a financial analysis on the equity
performance of companies of local interest in the REIF region. In all, 15 companies in the REIF region were
selected to construct the Regional Equity Index (REI). Selection criteria of the companies are based on the
companies’ significant presence in the REIF region, as indicated by the number of local employees, or the
companies’ significance of operations in the REIF region. Currently, the list of companies in the REI includes
Allete, Armstrong World Industries, Ascena Retail Group, Calumet, Canadian National Railway, Charter
Communications, Cleveland-Cliffs, Enbridge Energy Partners, Husky Energy, Louisiana-Pacific, Marriott
International, Morgan Stanley, Polymet, UnitedHealth, and U.S. Steel.
This ongoing research project tracks the companies’ equity performance, creates an index of these local
stocks to measure economic activity in the region, examines measures of future performance, and makes
comparisons to industry averages and market indices. This edition of the REIF research extends the
timeframe to 10/01/2020.
Of note, the REI outperforms the benchmark index, and investors are expecting a majority of the stocks to
mirror the market. Figure 5 below illustrates the growth trend of a $100 investment in the REI on January
2009 that is held until March 2, 2020. This is compared to the trend of $100 invested in the S&P 400 and the
Crude Oil Futures over the same time period. Figure 6 shows that the REI trends somewhat with the market
toward a downward direction, but the REI has significantly outperformed relative to the S&P 400 during
the period between October 1, 2018 (the ninth report-ending period) and October 1, 2020 (the eleventh
report-ending period). Comparing the REI and the S&P 400 values since the last report (March 2, 2020),
the REI is down 4.79%; whereas, the S&P 400 is up by 3.58%. Considering the Crude Oil Futures, the REI has
continued to show significant movement in step with changes in oil prices, which indicates that the REI is
more sensitive to fluctuations in commodities pricing than the diversified S&P 400.
Industries in the communications, industrial, health care, and financial sectors have fared
better compared to materials and energy industries, suggesting a K-shaped recovery.
Figure 6 shows the COVID-19 impacts on the market performance of our REI. Both the REI and the Mid-Cap
400 experienced a significant fall in values between March and May 2020 followed by a gradual recovery
between June 2020 and October 2020. In Figure 6, the blue REI 15 line represents all 15 REIF companies.
The orange REI 7 line represents the seven companies that fall under materials and energy industry
categories—United States Steel, Cliff Natural Resources, Polymet, Louisiana-Pacific, Calumet, Enbridge,
and Husky. The purple REI 8 line represents the other eight REIF companies from other industries category.
Figure Y shows that the REI 7 has underperformed the REI 8 over the last two years. Between March and
October 2020, the REI 7 had a bigger dip in response to COVID-19 and has recovered more slowly than REI 8,
suggesting that industries in the communications, industrial, health care, and financial sectors fared better
compared to materials and energy industries, for an overall K-shaped recovery. A K-shaped recovery occurs
when, following a recession, different parts of the economy recover at different rates, times, or magnitudes.
PAGE 9 | ©2020 REIF — NATIONAL BANK OF COMMERCEThe Value Line® Measures indicate that short-term expectations of future performance for the majority of
stocks in the REI are that the stocks will either outperform or mirror the overall stock market. Over the shorter
term in the next three to six months, only Charter Communications, United Health, and Canadian National
Railway are expected to outperform the market. Allete, Armstrong World Industries, Enbridge, Louisiana-
Pacific, and Morgan Stanley are expected to mirror the market. Cleveland-Cliffs, Marriott International,
Polymet, Husky Energy, and U.S. Steel are expected to underperform the market. Over the longer-term,
Louisiana-Pacific, Morgan Stanley, Husky Energy, and United Health are expected to outperform the market.
In next year, Allete, Calumet, Armstrong World Industries, Canadian National Railway, Charter
Communications, Enbridge, and Polymet are expected to mirror the market. Cleveland-Cliffs, Marriott
International, and U.S. Steel are expected to underperform the market in the long-term. The Morning Star®
Measures show that the REI’s Price-to-Earnings ratio is higher than last year, implying that investors are
expecting higher earnings growth. However, a high Price-to-Earnings ratio can be the result of a high price
or the result of low earnings per share. Of the companies that had data about the Forward Price-to-Earnings
ratios, the earnings of the majority of them are expected to grow. The Short Interest ratio shows that
investors have higher short-term expectations of performance of the fifteen REI index stocks. The majority
of the stocks have a short interest ratio of less than five—an indication that investors believe stock prices will
rise for these companies. Overall, investor sentiment is bullish as indicated by the average short interest ratio
of 3.39 for the REI index stocks.
REIF, S&P 400 AND OIL Futures
REIF, MIDCAP, AND OIL Futures (January 2009 to date)
400
300
200
100
0
09
10
11
12
13
14
15
16
17
18
19
20
20
20
20
20
20
20
20
20
20
20
20
20
REIF INDEX MID CAP OIL RETURNS
FIGURE 5. T he REI has trended downward somewhat in recent years but has still outperformed relative to the S&P 400 over the long term.
Source: UWS REI Analysis using Yahoo Finance data
REIF INDEX, REIF MATERIALS & ENERGY AND OTHER INDUSTRIES INDEX
REIF INDEX, REIF MATERIALS & ENERGY INDEX , AND REIF OTHER INDUSTRIES INDEX
REI15 (ALL) Returns REI7 (MATERIALS & ENERGY) Returns REI8 (OTHERS) Returns
300
200
100
18
19
20
20
20
20
FIGURE 6. Industries in the communications, industrial, health care, and financial sectors fared better compared to materials and energy
industries, for an overall K-shaped recovery. Source: UWS REI Analysis using Yahoo Finance data
©2020 REIF — NATIONAL BANK OF COMMERCE | PAGE 10THE COLLEGE OF ST. SCHOLASTICA
BUSINESS CONFIDENCE INDICATORS
Erica Henkel, CPA, MAcc, Assistant Professor of Finance and Economics
Student Researchers: Krista Heller and Nicholas Anderson
The College of St. Scholastica’s research team distributed business confidence surveys to regional Chambers
of Commerce located throughout the 15-county REIF region. The survey’s purpose was to develop a better
understanding of local businesses and their confidence in the economy. The survey asked each business
to indicate its sector, number of employees, recent and projected changes in business activity, and factors
inhibiting growth. In addition, the survey asked targeted questions regarding reasons for unfilled job
positions, changes to hiring practices, and frequency of financial planning activities.
In total, 74 businesses completed the survey. According to the results, the most common sectors were
professional and business services (n=14), education and health services (n=13), leisure and hospitality
(n=12), and trade, transportation, and utilities (n=14). More than half of those surveyed had fewer than
20 employees, while 8% of respondents reported 100 or more employees.
Businesses were asked to evaluate their general business activity over the previous six months. In a
downturn from previous years, 30% of respondents reported improved business activity during the last six
months as compared to 38% in March 2020, and 45% reported decreased activity, which is up from 15%
(Figure 7). Employers are having less difficulty finding qualified candidates, but willing candidates are still
in short supply.
After evaluating the previous six months, businesses were then asked to forecast activity for the next six
months based on the same criteria. Of those businesses, 34% were confident that business activity would
improve in the next six months (down from 51% last spring), and 25% expect decreases in activity (up
from 12% last spring), as shown in Figure 8. Expectation of increasing profits fell from last spring, with
only 21% predicting increasing profits and 36% expecting decreases in profits. About half of businesses
expect worker hours to stay the same in the next six months, with expectations of the other respondents
evenly split on whether work hours will increase or decrease. COVID-19 is the single biggest factor limiting
business growth, followed by lack of demand, and shortage of qualified labor (Figure 9).
According to local businesses, COVID-19 is the single biggest factor limiting business growth,
followed by lack of demand, and shortage of qualified labor.
Regarding unfilled positions at areas businesses, 30% agreed that a lack of qualified candidates was a
cause of unfilled positions at their businesses, down from 40% last spring. Similar to last spring, businesses
reported that they faced a lack of willing or interested candidates. This is important because it reflects an
overall lack of interested applicants in the workforce. In all, 45% of businesses reported making no changes
to hiring practices to prevent or alleviate hiring difficulties, while 30% of businesses reported increasing
wages and/or benefits to help alleviate hiring difficulties (down from nearly 50% last spring). Over 40% of
businesses surveyed allowed for flexible hours.
PAGE 11 | ©2020 REIF — NATIONAL BANK OF COMMERCEBusiness Activity Outlook for Past Six Months
Improved 22
Business Activity
No change 18
Wo rsened 33
FIGURE 7. In a downturn from previous years, 45% of businesses reported decreased business activity.
Source: CSS Business Confidence Survey
Business Activity Outlook for Next Six Months
FIGURE 8. Roughly one-third of businesses were confident that business activity would improve in the next six months, while 25% expect a decrease in activity.
Source: CSS Business Confidence Survey
Factors Limiting Business Activity
COVID 53
Shortage of Qualified Labor 18
Lack of Demand 18
Government Policy 15
Competition in Own Sector 12
Cost of Materials 12
Other 9
Cost of Labor 8
We ather Conditions 7
Shortage of Materials 7
Housing 3
Cost of Land and Buildings 2
Lack of Equipment 1
Access to Bank Credit 1
FIGURE 9. COVID is the single biggest factor limiting business growth, followed by a shortage of qualified labor and lack of demand.
Source: CSS Business Confidence Survey
©2020 REIF — NATIONAL BANK OF COMMERCE | PAGE 12SPRING EVENT
SAVE THE DATE
APRIL 6, 2021
7-9:30 A.M. AT THE DECC IN THE
HARBOR SIDE BALLROOM
PANEL:
Neela Mollgaard
Executive Director of Launch Minnesota
Aaron Hagar
VP, Entrepreneurship and Innovation
and Sector Strategy Development
PAGE 13 | ©2020 REIF — NATIONAL BANK OF COMMERCESTEERING COMMITTEE
Steven Burgess Rubana Mahjabeen
President & CEO Associate Professor
National Bank of Commerce University of Wisconsin – Superior
sburgess@nbcbanking.com rmahjabe@uwsuper.edu
Michael Colclough Sakib Mahmud
Business Finance Director Associate Professor
Northland Foundation University of Wisconsin – Superior
michael@northlandfdn.org smahmud@uwsuper.edu
Andy Donahue Claire Mayhew
Director Marketing Specialist
WI Small Business Development Center National Bank of Commerce
University of Wisconsin – Superior cmayhew@nbcbanking.com
adonahue@uwsuper.edu
Rick Revoir
Gina Grensing Dean
Editor/Writer Stender School of Business
Bureau of Business and Economic and Technology
Research - UMD rrevoir@css.edu
ggrensin@d.umn.edu
Ian Vincent
Brian Hanson Senior Business Developer
President & CEO APEX
APEX ian@apexgetsbusiness.com
brian@apexgetsbusiness.com
Curt Walzack
Monica Haynes Business Consultant
Director NE MN SBDC
Bureau of Business and Economic curt@nesbdc.org
Research – UMD
mrhaynes@d.umn.edu Hans Wronka
Department Manager/
Erica Henkel Environmental Services
Assistant Professor Burns & McDonnell
The College of St. Scholastica hawronka@burnsmcd.com
ehenkel@css.edu
Hannah Horman
Marketing Director
National Bank of Commerce
hhorman@nbcbanking.com
©2020 REIF — NATIONAL BANK OF COMMERCE | PAGE 14PRESENTED BY
Member FDIC
WITH THE HELP OF
To view prior reports visit: nbcbanking.com/about-us/reif/You can also read