FAST FORWARD - White Paper - Arval
←
→
Page content transcription
If your browser does not render page correctly, please read the page content below

TO ELECTRIC VEHICLES
FAST FORWARD

       White Paper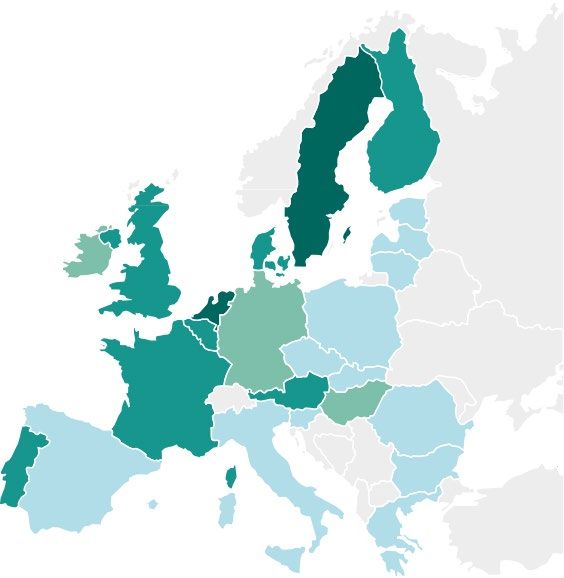
Executive Summary
  1 | Introduction
                                                                     2
                                                                     5
                                                                          EXECUTIVE SUMMARY
  2 | Regulations affecting powertrain technologies                  7
  3 | Selecting the optimal powertrain                              11
  4 | 10 reasons to take BEVs in your fleet                         14
    1 | BEVs are a greener option                                   14

                                                                             I
        2 | BEVs provide a wide range of new models                 16
        3 | BEVs allow for high mileage drivers too                  17
        4 | BEVs have competitive TCOs                              18               n 2018, pure internal combustion engines1
        5 | BEVs offer a more pleasant driving experience           20
                                                                                 (ICE) still accounted for 95% of all passen-
        6 | Wide ecosystem, BEVs as storage unit                    20
                                                                                  ger car registrations in Europe. Within the
        7| Introducing efficient Battery Electric Vehicles          21
        8 | Future proof access in ULEZs and Diesel banned cities   23            next 5 years this will drastically change, with
        9 | BEVs are more connected                                 23       electrified vehicles making up almost half of the
        10 | BEVs are trendy and responsible                        23       market by 2025 and growing to more than 70% by
  5 | Changing your fleet to a BEV Fleet                            24       2030. This shift away from petrol and diesel to
       1. | Organize information sessions on EVs                    24       electrified vehicles will be as drastic as the drop
       2. | The right vehicle for the right driver                  24
                                                                             of diesel in the last few years and there are very
       3. | Educating the driver                                    24
       4. | Charging infrastructure                                 25       good reasons for explaining this change.
       5. | Building a BEV community                                25
       6. | Benefiting BEV drivers                                  25
       7. | Play the fleet BEV metrics                              25
       8. | Arval e-mobility services                               25
  6 | Conclusion                                                    26
                                                                             1 | Conventional internal combustion powertrain (pure petrol and diesel) with no
  7 | Appendix                                                      27       electric or air drive. Stop/start systems (including micro-hybrids) are counted here.
EXECUTIVE SUMMARY

                   5 key factors that will accelerate
                   the shift to electrified vehicles as of 2020

                   1    European Regulation is forcing car manufacturers
                        to invest heavily in cleaner technology. These reg-
                        ulations have been reinforced in recent years and
                   are to protect the public health as well as to combat
                                                                                 3   Reputational issues around diesel and more
                                                                                     broadly around ICE vehicles will not fade away
                                                                                     and as such, the demand for electrified vehicles is
                                                                                 rising. Although significantly better than they were, ICE
                                                                                                                                               5   Fiscal measures to stimulate electrified vehicle
                                                                                                                                                   sales are available in 24 out of the 28 EU states.
                                                                                                                                                   Although only 12 EU members offer bonus pay-
                                                                                                                                               ments or premiums to buyers at acquisition most
                   climate change. By 2021, hefty fines may impact car           vehicles (particularly diesel) still emit harmful tail-pipe   countries grant tax reductions or exemptions for elec-
                   manufacturers that do not comply with the carbon              emissions and the public opinion around them is not           tric cars. A full overview is on the European Automobile
                   emission targets.                                             expected to change. Low emission zones (LEZ), in towns        Manufacturer Association2 (ACEA) website. In addition
                                                                                 and cities, will continue to be introduced with total         some countries, like Norway, provide incentives on

                   2
                                                                                 bans on diesel or even all ICE vehicles. This is expected     vehicle usage which can include free tolls, free parking,
                          The cost of regulation pushes up the cost of ICE       in selected city areas by 2025.                               free public charging and even access to bus lanes.
                          vehicles, whereas the reduction in battery costs
                         and the increasing availability of attractive battery
                   electric vehicles (BEV) models is making electrification
                   a better option. As a result, the total number of plug-in
                   hybrid, battery electric and to a lesser amount fuel cell
                   vehicles is expected to increase from 100 models today
                                                                                 4    Reducing Range Anxiety as the significant growth
                                                                                      in the charging infrastructure together with the
                                                                                      fact that many new battery electric vehicles now
                                                                                 have real-life ranges in excess of 300km, with some up
                   to 214 in 2021 and 325 by 2025.                               to 500km. When combined with public charging facil-
                                                                                 ities, car sharing and/or vehicle switching solutions,
                                                                                 users can plan longer distances when needed.

    Arval Fast Forward to Electric Vehicles
                                                                                                                                                          2 | https://www.acea.be/publications/article/over-
3                                                                                                                                                         view-of-incentives-for-buying-electric-vehicles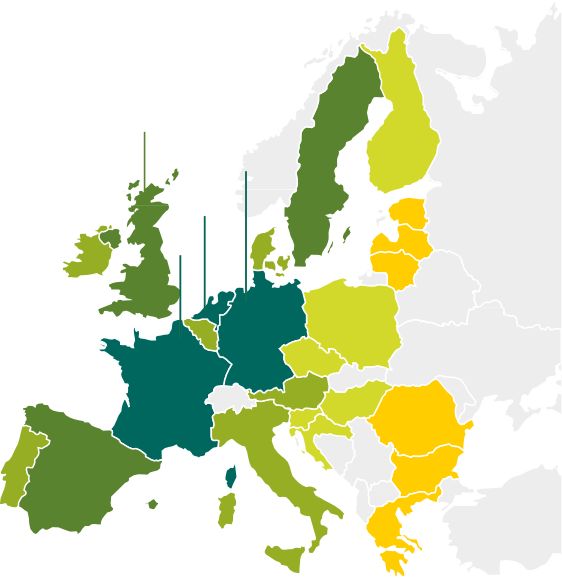
EXECUTIVE SUMMARY

                   Fast forward from ICE to EV                                   Arval's mission and approach                              White Paper Motivation
                                                                                                                                           Following the Arval "Clearing the Air around Diesel"
                   The internal combustion engine will remain a key              Arval’s mission is to help clients to make the right      white paper in November 2017, this new paper aims
                   component of the energy mix for some time to come             choice in this rapidly evolving vehicle manufactur-       to provide an update to the changing automotive
                   and not only because hybrid vehicles still require a          ing environment, giving expert advice on powertrain       landscape. Along with an overview of the primary pow-
                   combustion engine.                                            choices and the mobility solutions to take that make      ertrains available going forward and the use cases in
                                                                                 sense in the short, medium and long term.                 which to consider them individually, this paper includes
                   Car manufacturers will also need time to shift their
                                                                                                                                           the Arval's approach in selecting the optimal power-
                   production lines to full electric vehicles in a cost effec-   Arval’s consulting teams, through the Arval SMaRT
                                                                                                                                           train, 10 reasons to introduce battery electric vehicles
                   tive way, whilst continuing to upgrade the existing           (Sustainable Mobility and Responsibility Targets)
                                                                                                                                           (BEV) in your fleets and provides recommendations on
                   diesel and petrol engines to bridge this transition.          approach, can support companies in their fleet and
                                                                                                                                           how to successfully make this transition.
                                                                                 mobility profiling exercise and help them to build or
                   Through 2020, the shift towards full electric vehicles
                                                                                 develop their car and mobility policies to tackle these   By publishing it, Arval recommends that whilst the lat-
                   will continue to accelerate, with the latest diesel and,
                                                                                 new challenges.                                           est Euro 6d diesel vehicles, together with petrol and
                   to a lesser extent, petrol vehicles continuing to be a
                                                                                                                                           other electrified options, will remain a valid option for
                   suitable choice for fleet customers in quite a number         Considering Arval’s and more broadly BNP Paribas’
                                                                                                                                           many drivers, it is time that fleet operators prepare
                   of cases.                                                     CSR ambitions, we want to be key contributors in the
                                                                                                                                           themselves for an accelerated shift towards BEVs
                                                                                 energy transition. This does not only mean that we
                   But make no mistake, the shift from ICE to EV vehicles                                                                  over the next few years, particularly where there are
                                                                                 continuously are investing and partnering to expand
                   has started and it is important not to be left behind.                                                                  strong corporate and personal tax incentives in place
                                                                                 our services to promote full e-mobility and connected
                                                                                                                                           or upcoming.
                                                                                 mobility, we have also committed to fully deploy the
                                                                                 principles that come out of SMART to ourselves includ-    This is a changing political environment and the con-
                                                                                 ing the full review of our own car policies, a process    tent in this paper is based on the information available
                                                                                 that has been started from the moment we launched         to date and any potential implications and options are
                                                                                 SMaRT during summer last year.                            not limited to what is detailed in this document.

4   Arval Fast Forward to Electric Vehicles
1 | INTRODUCTION 95%
of car registrations
10 yrs
for electric vehicle
4x
more electric
in 2018 are Internal registration to vehicle models
Combustion Engine be equal to ICE available in
(ICE) vehicles registration 2021 vs 2018
A rapidly evolving
automotive landscape
In 2018, Internal Combustion Engine (ICE) vehicles Graph 1: European registrations forecast per energy group type
accounted for 95% of all passenger car registrations. Source: LMC Automotive
Within 5 years, this is expected to reduce to 55% and
within 10 years the proportion of pure ICE vehicles
100%
(Petrol and Diesel), Hybrids (Mild, Full and Plug-in)
and Electric Cars (Battery, Extended and Fuel cell) will 90%
almost be equal.
80%
As such, although the landscape is changing and pri-
marily benefiting the Mild Hybrids and the Battery 70%
Electric Vehicles (BEV), the foreseeable future will con-
sist of a broad mix of powertrains. A short description 60%
for each powertrain is provided in Section 2.
50%
T
40%
his powertrain outlook is also reflected in the
number of corresponding models that car manu- 30%
facturers have announced that they will bring to
the market as illustrated in Graph 2. Around 220 elec- 20%
tric vehicles will be available in 2021 which is nearly
10%
4 times the number of models that were available in
2018. And in order to achieve the 2025 CO2 targets, it is 0%
expected that this will grow to more than 325 models. 2018 2019 2020 2021 2022 2023 2024 2025 2026 2027 2028 2029 2030
Battery Electric Vehicle Extended Range Electric Vehicle Fuel Cell Electric Vehicle
Plug-in Fuel Cell Electric Vehicle Full Hybrid Electric Vehicle Mild Hybrid Electric Vehicle
Mild Hybrid Electric Vehicle (48V) Plug-in Hybrid Electric Vehicle Internal Combustion Engine Only
5 Arval Fast Forward to Electric Vehicles1 | INTRODUCTION
Graph 2: Electric car models (PHEV, BEV and FCEV) coming to the market in Europe
(source: Transport & Environment)
T
350
here is a growing market demand for electrifica-
tion. Registrations, in Western Europe, of Diesel
passenger cars fell from 55% in 2016 to 31.6% YTD
300
in November 2019, mainly in favour of Petrol cars due to
concerns over air quality. While Diesel registrations are,
250 globally, more or less stabilising, Petrol registrations
are expected to start falling and this time in favour of
electrified vehicles. Governments are changing their tax
200 incentives to increasingly favour cleaner and greener
technologies. Low Emission Zones (LEZ) are being
introduced, whilst electric charging infrastructure is
150
growing rapidly and battery costs are steadily reducing.
At a time where there is growing public and political
100 pressure to tackle the causes of climate change and
air pollution, together with the increasing number of
electrified models available, means that fleet decisions
50
around powertrains have gone beyond functionality,
performance and costs to include emissions and com-
0 pliance criteria to ensure a future proof car mobility.
2012 2013 2014 2015 2016 2017 2018 2019 2020 2021 2022 2023 2024 2025
Volkswagen Group BMW Group Hyundai-Kia Tesla
PSA Group FCA Jaguar-Land Rover Mazda
Toyota Renault-Nissan-Mitsubishi Ford Suzuki
Daimler Volvo-Geely Honda Subaru
6 Arval Fast Forward to Electric Vehicles2 | REGULATIONS AFFECTING
Car manufacturers
are confronted with 2
important obligations:
1–Euro Emission
Standards
POWERTRAIN TECHNOLOGIES 2–CO2 Targets
Euro Emission Standards Table 1: Euro norm NOx standards
Source: several sources
Independent on-the-road testing has clearly shown
that NOx emission levels from Euro 6b or older Diesel EURO NORM EURO 5A EURO 6B EURO 6C EURO 6D-TEMP EURO 6D
cars were up to 7 times higher than the existing Euro
6b standard of 80 mg/km. Test NEDC NEDC WLTP WLTP + RDE WLTP + RDE
Consequently, and also in recognition that on-the-road In place Sept 2011 Sept 2015 Sept 2018 Sept 2019 Jan 2021
fuel consumption varied significantly from official test
figures, the outdated NEDC (New European Driving Conformity Conformity
No conformity
Cycle) lab test has been replaced by more realistic No conformity factor factor under factor under
factor as that
WLTP (World Harmonized Light-Duty Vehicles Test existing as NEDC lab real driving real driving
relates to the
Procedure) and RDE (Real Driving Emission) tests. Con- tests past the tests conditions of 2.1 conditions of
RDE test
sidering the high levels of NOx produced by all Diesels allowed 1.43 allowed
with a Euro Emission Standard of 6b and older, the
Petrol 60 mg/km 60 mg/km 60 mg/km 126 mg/km 85.8 mg/km
Regulations allow for a phased reduction of a maximum
deviation of the initial NOx standards measured under
Diesel 180 mg/km 80 mg/km 80 mg/km 168 mg/km 114.4 mg/km
Real Driving Conditions and this is called a Conformity
Factor.
Although this has resulted in the production of the
cleanest Diesels ever, ultimately affecting the produc-
tion costs, they can still potentially produce more NOx
than originally intended in 2015. I t remains to be seen as to whether cities such
as Rome (2024) and Paris and Madrid (2025)
actually introduce an outright diesel ban, how-
ever at this stage Euro 6d ensures that drivers
with the exception of Norway, current proposed
dates to end the sales of ICE cars will not start
before 2030. Nevertheless, the question if and
when there will be a Euro 7 emissions standard
should have no real access restrictions in the near remains valid, potentially redrawing LEZ’s access
future in existing Low Emission Zones (LEZ). Also, criteria.
7 Arval Fast Forward to Electric Vehicles2 | REGULATIONS AFFECTING POWERTRAIN TECHNOLOGIES
Picture 1: Proposed dates to end the sale of ICE cars
(source: Transport & Environment)
2025 2030 2032 2040
Norway Sweden Denmark The Netherlands India Slovenia Ireland Scotland France United Kingdom
Achieving CO2 targets requires electrification
As from 2021, the EU fleet-wide average CO2 target for new cars is 95 considered to be cheaper or at least more sustainable than paying
g/km versus the actual emissions of 122 g/km in 2018, if measured the penalty of €95 per gram over the limit. When multiplied by the
in NEDC terms. An additional reduction relative to 2021 of 15% and number of cars they sell in 2020 this has been estimated by various
37.5% is required in 2025 and 2030 respectively using the WLTP result sources to potentially cost up to €34 billion, which equates to about
of 2021. 50% of their aggregated Earnings Before Interest and Taxes (EBIT). As
such it is not a surprise that manufacturers have to produce at least
In order to achieve these targets and to avoid penalties, car manufac-
8% Hybrids and 6% BEVs while especially Mild Hybrids and PHEVs will
turers have chosen to stop the production of their most inefficient
help them to reach the 2021 target.
or polluting vehicles, to invest in significantly greener ICE vehicles
and to produce more electrified models. In general, this strategy is
8 Arval Fast Forward to Electric Vehicles2 | REGULATIONS AFFECTING POWERTRAIN TECHNOLOGIES 9% by 2040
less CO2 emitted ICE vehicle may
by diesel car not be sold anymore
thanks to lower in some countries
Graph 3: CO2 emission from new passenger cars in the EU
fuel consumption
(source: The Internal Council of Clean Transportation, ICCT)
200
Powertrain overview
2000-2008
-2.3g/km (-1.4%) p.a. New Petrol and Diesel vehicles are without a doubt
180 cleaner, from both a NOx and CO2 perspective, then
2008 (154 g/km) ever before. Whilst diesel fuel emits about 17% more
introduction of standards CO2 per litre than petrol, diesel models typically emit
Average CO2 emission values (g/km, NEDC)
160
about 9% less CO2 per km than the equivalent petrol
-3.4 g/km (-2.4%) p.a. cars thanks to lower fuel consumption. Whereas, the
140 Euro Emission standards for CO2 are tougher for diesel,
2008-2016 2015
130 g/km they allow higher NOx emissions than Petrol.
-4.4g/km (-3.2%) p.a.
120
However, results published by the European Automo-
-5.8 g/km (-5.1%) p.a.
bile Manufacturers Association (ACEA) in October 2018,
100 highlighted that most of the newest diesels actually
2021 -3.6 g/km (-4.0%) p.a. emit, in real driving conditions, a NOx level lower than
95 g/km -2.8 g/km (-3.8%) p.a. 80 mg/km, with many closer to the lower Petrol level
80
2025 of 60 mg/km and below. Some institutions, such as the
81 g/km 2030 General German Automobile Club (ADAC - Allgemeiner
60 Deutscher Automobil-Club) as well as the British Auto-
67 g/km
mobile Association (The AA) reported that a significant
40 number of new Diesels emitted almost zero NOx. Obvi-
Historical emissions ously, more tests are required to fully confirm.
Targets
20 Nevertheless, the RDE conformity factor will reduce to
1 by 2023 meaning that the NOx difference between
Petrol and Diesel will have essentially almost disap-
0
peared compared to a few years ago.
2000 2005 2010 2015 2020 2025 2030
9 Arval Fast Forward to Electric Vehicles2 | REGULATIONS AFFECTING POWERTRAIN TECHNOLOGIES
A s Hybrids combine a normal internal combustion engine
and an electric motor, they have the potential to consume
less fuel, less CO2 and less NOx (or other particles) than
its pure ICE equivalent.
Two main types Plug-in Vehicles (PIVs) BATTERY ELECTRIC VEHICLES (BEVS),
otherwise known as full or pure electric vehicles (or
of hybrid technology Plug-in vehicles have much larger battery packs than
more commonly just EV), have much bigger batteries
and are powered only by electricity with no ICE.
conventional Hybrids which result in significantly
MILD HYBRIDS (MHEV) greater electric driving ranges. Although they will Whilst BEVs will make use of regenerative braking to
use an electric motor, generally utilising a 48-volt sys- self-charge in the same way as HEVs, in order to fully top up the battery and maximise the range, in order
tem (which cannot be plugged-in), to assist the Internal charge the battery, they must be plugged in. There to fully recharge the vehicle, they must be plugged
Combustion Engine. However, although it will not travel are three main types of plug-in vehicle technology: in. Depending on the model, BEV ranges are between
solely on electric power it offers greater fuel economy 200km – 500km with a battery guarantee of 8 years or
savings than the conventional start-stop function but 160,000km for most models.
PLUG-IN HYBRIDS (PHEVS)
less than a Full Hybrid. BEVs have no tail-pipe emissions which is extremely
have a much larger battery, electric motor and an ICE.
Nevertheless, Mild Hybrids are easier and cheaper to They have the capability to travel between 50-100km, good from a local air quality perspective and although
produce and have a lower weight than Full Hybrids. (depending on the make and model) on electric power they are not completely zero emission, from a CO2 and
Consequently, they have many of the advantages of Full only, however they typically constantly switch between NOx perspective, they are still more carbon efficient
Hybrids for a lower price. Unsurprisingly, as it is one of the motor and the engine depending on the road con- than the equivalent ICE vehicle which is discussed in
the cheapest and easiest ways to help achieve the 2021 ditions and charge state of the battery. Section 4.
CO2 targets, OEMs will start to significantly increase
As a result, PHEVs have great potential to significantly
their production offers as from 2021. THE EXTENDED-RANGE
reduce both NOx and CO 2emissions. However, this is
strongly dependent on drivers routinely charging the ELECTRIC VEHICLE (E-REV)
FULL HYBRIDS (HEVS) car and fleet fuel policies that actively encourage this is similar to a PHEV in that it has larger battery than
behaviour otherwise they can be less fuel efficient than a full hybrid coupled with an ICE. However, the E-REV
have a very small battery, electric motor (that cannot
pure ICEs due to their greater weight. differs in that the motor always powers the wheels
be plugged in) and an ICE. It will travel a few miles
on the electric power and will then switch back to the Despite being the most expensive hybrid option, thanks and the engine only acts as a generator to charge the
engine while a combination of the engine and regen- to their tax incentives, they are currently very popular battery and ‘extend the range’ of the vehicle. Although,
erative braking will recharge the battery. As a result, and a steppingstone towards a Battery Electric Vehicle. like a BEV, the vehicle is run on battery power only it
they effectively consume about 25% less fuel, less CO 2 cannot be considered to be zero emission due to the
and less NOx (or other particles) than its pure ICE tail-pipe emissions from the ICE.
equivalent.
10 Arval Fast Forward to Electric Vehicles3 | SELECTING THE OPTIMAL POWERTRAIN 3
tools to choose
the optimal
powertrain
C hoosing the optimal powertrain
today is no longer relatively straight
forward; it is not only affected by
the driver profile but also by the existing
car policy reflecting the company’s atti-
tude and sensitivity towards Corporate
CSR
Social Responsibility (CSR), the satis-
faction rate of their drivers (or Driver
Satisfaction Rate – DSR) and the Total
Cost of Ownership (TCO). Corporate Social Responsability
That’s why Arval is using dedicated and
in-house developed digitalized tools as Client Profiling
part of our 5 step Arval SMaRT (Sus-
tainable Mobility and Responsibility
GREEN
Although all companies have an ambition to make their
Targets) program to help our custom- fleet greener and cleaner, they are also expected to manage
ers in making the right choices in their the total costs of the fleet within budgets and to ensure that
transition to greener and cleaner fleets car choice contributes positively to employee satisfaction
and sustainable mobility including solu- for retention and recruitment purposes. Consequently, it is
tions allowing a shift from car leasing to
SOCIAL BUSINESS
important to understand clearly a company’s sensitivity
wider mobility solutions. towards CSR, TCO and driver satisfaction as it may sig-
Although in this paper we will not elab- nificantly influence the car policy and hence the choice of
orate on the SMaRT approach itself, we the final powertrain if there are a number of alternatives
will refer to some of our SMaRT Tools available for a driver.
as they are directly relevant for helping Thanks to our Arval SMaRT Client Profiling tool, their prior-
DRIVER MIXED PROFESSIONAL
selecting the optimal powertrain. itisation becomes clearer as the tool also offers a concrete
DSR TCO
strategy per profile (e.g. business) to making their fleet
SMaRT-er.
Driver Satisfaction Rate Total Cost of Ownership
Picture 2: Arval SMaRT Client Profiling Tool
11 Arval Fast Forward to Electric Vehicles3 | SELECTING THE OPTIMAL POWERTRAIN
Picture 3: Powertrain Compatibility by Arval’s SMaRT Driver Profiling Tool
0% 20% 30% 40% 50% 60% 70% 80% 90% 100%
Driver Profiling
Diesel
Depending on the usage of the car in terms of typi-
cal journey length, trip frequency, planned locations
and ability to charge as well as the driving style of
the individual it is likely that one powertrain is more Electric
favourable over another. Arval’s SMaRT Driving Pro-
filing tool helps illustrate which powertrain(s) would
potentially be most suitable when considering the indi-
vidual driving profile of the user.
Petrol
Gas
Full Hybrid
Plugin Hybrid
0% 20% 30% 40% 50% 60% 70% 80% 90% 100%
12 Arval Fast Forward to Electric Vehicles3 | SELECTING THE OPTIMAL POWERTRAIN
SMaRT TCO Simulator
Thanks to our SMaRT TCO Simulator, we are able to provide a list
Picture 4: Arval’s SMaRT TCO Simulator
of the optimal powertrain for each employee whilst respecting
TCO budgets, CO2 targets and ensuring driver satisfaction.
Financial Fee Insurance Taxes Bonus Total TCO
Arval’s position Services Fuel Tolls CO2
on different powertrains
£850 150 g/km
Whilst the latest ICE vehicles and other electrified options remain
a valid option for many drivers, we will show that BEVs are not
only a cleaner option, also satisfying high mileage drivers while
£680 120 g/km
offering significant advantages such as facilitating a much wider
ecosystem, providing a higher interconnectivity increasing driver
safety and easing the use of alternative mobility solutions. That’s
why Arval recommends that fleet operators prepare themselves £510 90 g/km
for an accelerated shift towards BEVs over the next few years,
particularly where there are strong personal tax incentives.
£340 60 g/km
Obviously, a critical part of the TCO is the pricing by the leasing
company itself (including the residual values set, the cost of
maintenance and tires) along with the expected fuel consump-
tion, insurance premium and taxes. In addition to the fact that £170 30 g/km
we have adjusted our price levels for electric vehicles, we will
argue in Section 4.4 that BEVs generally are becoming increas-
ingly competitive from a TCO perspective. £0 0 g/km
In order to ensure that BEV driving is a feasible option, it is also
important to have the right partnerships ensuring e-mobility -£170 -30 g/km
such as charging facilities for which Arval can offer a full service
package which we will elaborate in Section 5.
DIESEL PETROL HEV PHEV EV
13 Arval Fast Forward to Electric Vehicles4 | 10 REASONS TO TAKE 73%
CO2 emission
50%
year on
BEVs IN YOUR FLEET reduction by
2050 for the life
cycle of a BEV
year growth
expected for
BEVs over the
next 5 years
Picture 5: Total Lifecycle Assessment
T hough BEVs only achieved a 1.3% market share in Europe in 2018,
still only accounting for a very small percentage of global new
vehicle sales, this position is rapidly changing with continuous
year-on-year growth expected of more than 50% each year over the
(European Environment Agency)
next 5 years. There are still many misperceptions around BEVs and
so we have included 10 reasons why your company should consider MINING OF RAW MATERIALS
starting the transition to BEVs into your fleet, progressively of course.
Raw Materials
1 – BEVs are a greener option PROCESSING TO USABLE FORM
Thanks to its zero tail pipe emissions, a typical BEV in
Europe produces less greenhouse gases and air pollut- MANUFACTURING
ants across its whole lifecycle compared with its petrol OF COMPONENTS Production
or diesel equivalent. Although the manufacturing car-
bon emissions for BEVs are in general higher, due to the
battery production process, these are more than offset PRODUCTION
by the lower in-use emissions over the life of the car.
A report by the European Environment Agency, “Electric
Vehicles from Life Cycle and Circular Economy Per-
spectives” shows that BEV’s CO2 emissions are about USE
17%-30% lower than ICE’s emissions over the entire
vehicle life cycle and with the current EU energy mix.
A 2017 European study conducted by VUB University in
Brussels, on behalf of the NGO ‘Transport and Environ-
ment’, even reported an average gap of 55% less CO2
VEHICLE END OF LIFE
than the diesel equivalent.
14 Arval Fast Forward to Electric Vehicles4 | 10 REASONS TO TAKE BEVs IN YOUR FLEET
Graph 4: BEV CO2 emission reduction when including electricity production in Europe
(source: Transport & Environment)
T his varies from 25% less in Poland, still producing
the “dirtiest” energy, to 85% less CO2 in Sweden.
In the appendix a total overview of EU countries
is presented.
200
3.1
13
-25%
3.1
Well-to-tank
Tank-to-Wheel
Glider
Lithium Battery
Powertrain
13
160 -45%
-50%
13
Although 22% of the current EU energy mix is still elec-
Emission in gCO2eq/km
-55% -60% -55%
tricity generated from coal, the continual growth in
3.1
163 3.1
renewable and low carbon sources, including nuclear, 120 -65%
13 3.1 3.1
13 3.1
solar and wind power, means that carbon emissions
13
13 13 13 13
will continually reduce. Considering the projected EU
3.1
-80% -85%
13 13
80
13
energy mix as coal is phased out, the life cycle emis-
sions of a typical BEV could be cut by at least 73% by 130 13
82 13 3.1 3.1
76
2050.
63 53 13 60
40
40 13
27 13 13
Though BEV production impacts ecosystems due to
6 4
the extraction and processing of nickel, copper and
other critical raw materials, the report concludes that 0
120 CO2/km 650g CO2/kWh 410g CO2/kWh 350g CO2/kWh 310g CO2/kWh 290g CO2/kWh 200g CO2/kWh 40g CO2/kWh 20g CO2/kWh 300g CO2/kWh
through a circular economy approach facilitating reuse
and recycling of batteries, these impacts can be mini- Diesel
mised. Obviously, the more batteries are used in second Poland Germany Netherlands Italy Spain Belgium France Sweden EU – 28
A
life applications and ultimately recycled, these ecosys-
tem impacts will gradually reduce in time. lthough BEVs, like ICE vehicles, still produce par- Last but not least, a shift to BEVs will also reduce noise
ticulate matter from road, tyre and break wear, pollution, even after including the Acoustic Vehicle Alert
BEVs obviously do not produce any tailpipe NOx System (AVAS), a mandatory artificial driving noise for
emissions and so offer clear air quality benefits at a security purposes, especially in cities where in general
street and city level. vehicle speeds are low and traffic often stands still.
Although power generation also contributes to the The French Arval Mobility Observatory (AMO) with the
overall CO2 and NOx emissions, with power stations help of Eurogroup Consulting, to ensure independent
being typically located away from population centres, objectivity and impartiality, has undertaken research to
means that their contribution to roadside and city explore this subject in more detail and to better under-
centre emissions is slight in comparison to diesel vehi- stand the full environmental benefits and impacts of
cles or ICEs in general and will reduce even further BEVs. This research has resulted in the publication of
when energy generation gradually becomes cleaner. ‘‘Le véhicule électrique est-il si vertueux?’’ which is
available at https://mobility-observatory.arval.fr/
le-vehicule-electrique-est-il-si-vertueux.
15 Arval Fast Forward to Electric Vehicles4 | 10 REASONS TO TAKE BEVs IN YOUR FLEET
Graph 5: Battery Electric Vehicle (BEV) models on the market
2 –BEVs provide a wide range are expected to increase five-fold by 2021
of new models (source: Transport & Environment)
To date, one of the main barriers to plug-in vehicle take-up has been
the limited number of models available, particularly with regard to 120
certain vehicle segments (i.e. lower medium estate etc.), coupled with
the electric range capability for BEVs. However, in the next two years,
the number of BEV models is expected to rise to more than 100 which 100
is a five-fold increase from 2018.
80
Numbers of Models
A s a result, BEVs will be available in all segments
including Small & City Cars (e.g. Fiat 500e, Peu-
geot 208, Opel Corsa), Compact Cars (e.g. Peugeot
308, Volkwagen I.D.3, Citroen C4), Large Cars (BMW
60
iX3 series, Tesla Y, Audi Q4), Luxury Cars (e.g. BMW i4 40
series, Audi e-tron, BMW iNext). A non-exhaustive list
is presented in the appendix.
20
0
2016 2017 2018 2019 2020 2021
16 Arval Fast Forward to Electric Vehicles4 | 10 REASONS TO TAKE BEVs IN YOUR FLEET 300km
is the average
range of BEV
Picture 6: Increasing battery range in km
today
3 – BEVs allow for
(source: Exane and updated by Arval
high mileage drivers too based on information at our disposal)
Whilst there is clearly a significant variance between individual MERCEDES BMW
IS | INext MERCEDES
TESLA
models, data from the Electric Vehicle Database3 highlights that EQE | S
BMW
the average real-life range for all current BEVs is approximately 500 EQE SUV
Model Y
GM
300km and even is 400–500km for some upcoming models.
RNO NISSAN
I-X3
TESLA
TESLA TESLA
Bolt
T
450
Model 3 RENAULT
NISSAN VOLKSWAGEN
SUV
New Zoe MERCEDES
his is significantly different to the range of early
BEVs, which was more like 80 – 120km, and trans- Model S Model X
New Leaf ID SUV
AUDI
forms the accessibility of BEVs. A 300km range is 400 EQC
PEUGEOT
undoubtedly less than the +600km that is more typical E-Qtron
CITROËN PEUGEOT
JAGUAR 208 MERCEDES C4
in an ICE car, however in reality most people do not reg- 350
I-Pace PEUGEOT EQA PORSCHE
ularly drive 300km (which equates to around 4 hours of 3008
RENAULT MINI PEUGEOT
2008 OPEL
driving) and even this is far greater than they will need
300 Mission E
on a day to day basis. 308
Zoe Corsa E-mini
VOLKSWAGEN
NISSAN
Ultimately public charging, which we cover in Section
Leaf BMW
4.7, enables drivers to extend the range of a BEV and 250 ID3
alternatively complementary mobility services such as
MERCEDES
i3 Series
FORD B-Class RENAULT
Arval Car Sharing, Vehicle Switching solutions. 200
e-Focus Zoe VOLKSWAGEN More and more models
150 e-Golf-17 with higher ranges available
in all cars' segments
VOLKSWAGEN
BMW
EPA Range (kms)
100
e-Golf-14
NISSAN i3 Series
50 Leaf
Bubble size = Price range
0
Jan-10 Jan-11 Jan-12 Jan-13 Jan-14 Jan-15 Jan-16 Jan-17 Jan-18 Jan-19 Jan-20 Jan-21 Jan-22 Jan-23 Jan-24
17 Arval Fast Forward to Electric Vehicles 3 | https://ev-database.uk/cheatsheet/range-electric-car4 | 10 REASONS TO TAKE BEVs IN YOUR FLEET 50%
cost reduction
expected for
4 – BEVs have competitive TCOs batteries by
2025
The combination of technological evolution, fiscal environment, will-
ingness of OEMs to push BEVs, much less maintenance required, a
potentially lower insurance cost and the energy efficiency of the elec-
tric powertrains all contribute to making the Total Cost of Ownership
increasingly competitive. It should be noted that TCO parity has now
been reached in several geographies for a number of vehicle segments
and we expect this to accelerate further.
Graph 6: Evolution of battery pack price between 2010 – 2019 in $/kwh
(source: Bloomberg NEF)
REDUCING LIST PRICE AND INCREASING RESIDUAL
VALUES ARE SUPPORTING ICE – BEV TCO PARITY
22% It is often considered that price parity between petrol or diesel vehi-
1,183
cles and BEVs will be achieved when the price of the battery pack
reaches $125-100/kWh, although this is very much dependent on
Lithium-ion battery price: volume-weighted average
21% the vehicle segment and the size of the battery that is incorporated
917
into the vehicle. Conversely, it is still relatively early days for battery
development in terms of the technology maturation curve as pro-
8%
duction volumes and R&D investment rapidly increases. As a result,
721
11%
663
35%
economists now believe that today’s battery costs could be cut by
588
more than 50% by 2025 and based on an average annual decline of
20.5% in graph 6, this price level should be reachable in 2 years. To
23% put this into context we can see how much prices have changed from
381 26%
18%
the Bloomberg New Energy Finance survey, which has been following
293
13% the price of batteries since 2010 (around $1,100/kWh) and currently
219
predicts the price to reach $87/kWh by 2025 and $62/kWh by 2030.
180 156 On the other hand, though costs relative to petrol and diesel and
standard hybrid vehicles have been relatively static, increasingly
stringent emissions regulations will potentially make these progres-
sively more expensive.
On top of this, residual values of BEVs are expected to be higher than
2010 2011 2012 2013 2014 2015 2016 2017 2018 2019 their ICE equivalents due to shifts in demand and supply.
18 Arval Fast Forward to Electric Vehicles4 | 10 REASONS TO TAKE BEVs IN YOUR FLEET 10M+
new charging
stations to be
installed by 2030
(private and public)
FISCAL INCENTIVES ARE EXCEPT FOR TYRES,
EXPECTED TO INCREASE FURTHER BEVS TYPICALLY REQUIRE
Fiscal measures to stimulate electrified SIGNIFICANTLY LESS
vehicle sales are available in 24 out of MAINTENANCE
the 28 EU states and are expected to There is some evidence to show that INSURANCE COSTS ARE
increase further, driven by Climate Act tyre wear on BEVs is greater than on ICE EXPECTED TO BE SLIGHTLY
discussions and agreements. However, vehicles as they are heavier and have LESS THAN ICES
it should be noted that as the BEV mar- more power and torque, however the Despite the fact that BEVs face increased
ket improves over the next few years lower maintenance costs easily off set media scrutiny when catching on fire,
and becomes more mature, then fiscal this effect. the National Highway Traffic Adminis-
incentives such as the UK plug-in car tration, an agency of the U.S. Federal
BEVs typically require significantly less
grant will undoubtedly be reduced and Government, stated in 2017 that there is
maintenance than ICEs because BEVs
ultimately removed. no evidence to conclude that BEVs start
have considerably fewer moving parts
to catch fire faster than ICEs. More, the
and fluids to change whilst the bat-
likelihood for fire and explosion are
tery, motor and associated electronics RUNNING COSTS ARE
anticipated to be somewhat compara-
basically require little to no periodic CONSIDERABLY LOWER
ble to or perhaps slightly less than ICEs.
maintenance. However, whilst brake
Although it is true that once they catch Although BEVs are currently more
wear is considerably reduced, due to
fire they are lost, using Tesla’s data, CNN expensive to buy than ICE vehicles this
regenerative braking, this does poten-
Money reported that Tesla fires occurred is offset by their significantly lower run-
tially result in increased brake rust or
at a rate of 5 per billion miles travelled ning costs. Electricity is much cheaper
corrosion from the lack of use. An annual
compared to a rate of 55 fires per billion than petrol or diesel and so the costs /
service to clean any corrosion off the
miles travelled in gasoline cars. km are considerably lower even when
brakes is therefore recommended. The
charging up at public charge stations.
batteries are also designed to last for When it concerns the frequency and
the lifetime of the vehicle and in prac- average cost of damage, relying on Obviously, the actual cost per mile /
tice we know that even after 8-10 years, actual insurance data, there is no real km will vary by country and charging
a battery’s capacity is still at least 70% material difference between BEVs and location (home vs public charging) but
-80%. After all, most providers provide ICEs while it is plausible to expect that typical costs are in the region of £0.04
a battery guarantee of 8 years and frequency will reduce as drivers are get- per mile in the UK or €0.06 / km in the
100,000 – 160,000km. ting used to BEVs in time. Netherlands.
19 Arval Fast Forward to Electric Vehicles4 | 10 REASONS TO TAKE BEVs IN YOUR FLEET
5 – BEVs offer a more pleasant 6 – Wide Ecosystem, Picture 7: Vehicle to Grid
(source: Fleetcarma, division of GEOTAB)
driving experience BEVs as storage unit
Obviously, a driving experience is subjective. Neverthe- The growth of renewable energy (which by its nature is
less, there are arguments why BEVs really can offer a intermittent) presents energy management challenges
more pleasant driving experience. due to the inevitable increase in volatility in energy
generation.
The smooth and nearly silent efficient electric motors
make BEV driving a much quieter, more comfortable Acting as decentralised storage units or energy
and generally less stressful experience. reserves, which can be drawn upon by electricity sup-
pliers through vehicle-to-grid technology4, BEVs are
For the traditional car fans who value performance,
seen as a potential solution to help balance energy
the instant torque and zero revs in a BEV, even in the
production and consumption, to maintain grid stability V2G Unit
lower cost models, gives the driver an impressively
particularly during peak hours. The ability to store elec-
AC/DC
quick acceleration compared to equivalent ICE mod-
tricity when the rates are lower and then sell it back
Bi-directional
els, taking the strain out of both city and extra-urban
to the Grid when the rates are higher further improves
Interverter
driving. The ability to smoothly and easily nip into
the TCO of a BEV.
gaps in congested traffic or accelerate to overtake on
T
dual-carriage ways and motorways reduces some of the
stresses in driving. his is certainly a valid case as stud-
Control Unit
ies show that most vehicles aren’t
BEVs can also potentially handle better than ICE vehi- typically in use for up to 95% of the
cles; the heavy weight of the batteries means that they
time, hence an electric vehicle is as such
High Voltage
are fitted to the floor which helps to give BEVs a low
an untapped power source ready to be
Battery
centre of gravity and great balance.
explored.
And on top of this, the lack of a transmission tunnel
Eventually, recharging a vehicle usually
between the seats also provides additional cabin space.
takes place upon arrival at home over-
night or at the office during office hours Control
(which in total account for 80 - 85% of Unit
recharging) which implies that driving
to a charging station is rarely needed
anymore.
Arval Fast Forward to Electric Vehicles
4 | a system in which there is an electrical energy flow
20 between battery electric cars (BEV) and the power grid.4 | 10 REASONS TO TAKE BEVs IN YOUR FLEET 4
EU countries
Picture 8: Electric Vehicle Charging Infrastructure and Market Share of Electrically-Chargeable Vehicles (ACEA)
gather 76% of
the charging
stations in EU
40,000 10%
13%
19% 20,000
26%
5%
17% 5,000
2%
1,000
1%
L
500 ike the growth in EVs themselves,
the global number of public charging
locations has grown significantly in
0 0% the last few years and is set to continue.
7 – Growing Public Charging Infrastructure
The European Automobile Manufacturers Association Currently, 76% of all charging stations in the EU are
(ACEA) recently demonstrated the correlation between located in just four countries (Netherlands 26%, Ger-
the market sales of EVs and the availability of charg- many 19%, France 17% and United Kingdom 13%) and in
ing points for all 28 EU member states. In general, EU in total there are 170,000 charging stations versus
the more charging stations, the higher the EV mar- 122,000 fuel stations, though a fuel station has more
ket share which is clearly visible for the Netherlands, fuel pumps.
Sweden, France and the UK. And except for Greece or
Romania, the fewer charging stations, the lower the
EV penetration.
21 Arval Fast Forward to Electric Vehicles4 | 10 REASONS TO TAKE BEVs IN YOUR FLEET
Graph 7: number of public charging stations in Europe Graph 8: Annual investment in public charging infrastructure in million €
(source: Statista) (source: Transport & Environment)
170,149
161,189
1,800 Front-runners are most Western
141,173
and Nordic countries: Austria,
132,114 1,600 Belgium, Denmark, Finland,
France, Germany, Ireland,
1,400
Luxembourg, Netherlands,
1,200 Sweden and the UK
1,000 Followers: Italy, Portugal
69,094 800
and Spain
Slow Starters composed
41,304
600
of EU13 and Greece: Bulgaria,
28,824 400 Croatia, Cyprus, Czech Republic,
17,501 Estonia, Greece, Hungary,
7,018
200
3,201
Latvia, Lithuania, Malta, Poland,
0 Romania, Slovakia, and Slovenia
2010 2011 2012 2013 2014 2015 2016 2017 2018 2019 2016 2017 2018 2019 2020 2021 2022 2023 2024 2025 2026 2027 2028 2029 2030
A ccording to Greentechmedia, Europe is expected to set in opera-
tion 9 million residential and 1.6 million public charging points
by 2030 and according to Transport & Environment, the total
investments in public charging will increase from 400 Million in 2018
T he ability to charge at home or at work has
transformed the re-fuelling requirements
and behaviour of drivers and as a result the
use of public charging will generally be to ‘top
Most rapid chargers are currently 50kWh
though there is a growing network of ‘Super
Chargers’ with the ability to deliver 100kWh or
150kWh. Taking an average EV efficiency of 6km
to about 2 Billion in 2030. This investment will differ from country by up’ rather than to ‘fill up’. BEV drivers develop / kWh then a 15-minute charge from a 100kWh
country but can basically be categorized into 3 groups: a different mind-set and a stop at a charge sta- charger will provide approximately 150km of
tion will be to get sufficient ‘fuel’ for the journey additional range (depending on the model).
rather than to fill up the ‘tank’. Although the A more useful measurement, rather than the
idea of visiting a fuel station will still happen, time taken to charge to 80% which is routinely
it will be much less frequently and will be com- reported, would be the range added (in miles
bined with other activities such as shopping, or km) per minute based on different charging
having food or quality time with family, friends speeds.
and colleagues as well as having off premises
business meetings with clients and partners.
22 Arval Fast Forward to Electric Vehicles4 | 10 REASONS TO TAKE BEVs IN YOUR FLEET
8 – Future proof access 9 – BEVs are more connected 10 – BEVs are trendy
in ULEZs and Diesel and responsible
banned cities A connected car is able to share internet access and
data with other devices, networks and services both
Last but not at least, a BEV, packed with latest technol-
inside and outside of the car including other cars,
charging infrastructure, home and office. Through ogy, is not only in line with the latest technology trends,
Cities and governments have been implementing Low it is also the most responsible choice to take.
Emission Zones (LEZ) and Ultra Low Emission Zones this connectivity the car can easily provide traffic con-
(ULEZ) to restrict the access to cities and larger towns gestion, safety and collisions alerts. It can also, when
of the more polluting vehicles as a measure to reduce connected to the driver’s calendar, alert the driver of
emissions of NOx and fine particles. the time to leave and inform colleagues, friends, park-
ing and charging facilities on their arrival time.
LEZs are currently implemented in various cities across
Europe, and a comprehensive overview can be found at With a BEV, infotainment, safety, contextual help offers,
https://urbanaccessregulations.eu. This also includes navigation and efficiency diagnostics, and payments
details of other types of vehicle access restrictions such reach a new standard and opens doors for further
as congestion charging as well as future planning. WIFI connection to passengers together with vehicle
to vehicle and vehicle to infrastructure opportunities.
Although Euro 6d is currently considered as a risk-free
vehicle to enter existing LEZs, one should consider that
some major cities (such as Rome and Paris from 2024
and Madrid from 2025) have announced plans to ban
all diesels. Due to their zero tail-pipe emissions, BEVs
are not affected by LEZs or city bans which makes
them a future proof option.
23 Arval Fast Forward to Electric Vehicles5 | CHANGING YOUR FLEET 8
steps to
TO A BEV FLEET greener and
cleaner fleet
R eplacing an individual ICE with a BEV is one thing,
but successfully transitioning a whole fleet to
electric over the next few years is a much big-
ger challenge and is much more than a pure top down
1 – ORGANIZE INFORMATION
SESSIONS ON EVS
Considering our habits of driving an ICE vehicle, it is
normal that there is (some) reluctance to drive a BEV
3 – EDUCATING THE DRIVER
New technology requires a user guideline. Having dedi-
cated information sessions are certainly recommended
to help users:
decision. Some Fleet Managers, through a lack of expe- or that interested people are left with a lot of questions.
rience with the technology, might be daunted by this Planning the journey and corresponding range needs
Our experience shows that it is beneficial to organize
and have real concerns on how to effectively manage information sessions in cooperation with your leasing Smart charging and vehicle preparation before
the growth of BEVs in their fleet. company and manufacturers or dealers and to allow leaving
Arval is ready to help the Fleet Manager in making test drives for employees. – e.g. pre-conditioning temperature while charging,
this transition and can ensure that by following our 8 charging in the garage during cold temperatures
steps approach, a greener and cleaner fleet becomes Learning how to avoid wasting energy before even
2 – THE RIGHT VEHICLE
a feasible objective. starting the journey
FOR THE RIGHT DRIVER
– e.g. unnecessary loads, too low tyre pressure
The BEV should be suitable for the driver. Understand-
ing driver profiles including driving mileage patterns, Optimizing their driving style to maximise the battery
driving style as well as checking to see if they can efficiency and range
charge at home, at the workplace or easily access – e.g. eco-driving, speed limitation alert, cruise con-
public charging stations to mention a few can be exe- trol, range monitoring,
cuted by a simple questionnaire (such as Arval’s Driver
Becoming familiar with (rapid) charging locations,
Profiling tool), using driver profiling apps or by using
accessibility, payments and timings
Arval's telematics solutions.
Learning how to care for the charging lead and the
battery
Educating the driver in how to optimize their e-mobility
will help fleet managers to make the BEV decision work
effectively.
24 Arval Fast Forward to Electric Vehicles5 | CHANGING YOUR FLEET TO A BEV FLEET
4 – CHARGING INFRASTRUCTURE 6 – BENEFITING BEV DRIVERS 8 – ARVAL'S E-MOBILITY SERVICES
Developing a strategy around charging infrastructure Benefiting car drivers is another example that will Arval has developed a total offer to support customers
is a key action to undertake in the fleet transition to encourage drivers to truly adopt an efficient and effec- in defining and implementing their energy transition
BEV to ensure that all drivers can charge their vehicles tive BEV driver habit. Examples can be sharing, in some strategy with a comprehensive solution facilitating the
adequately. As well as setting reimbursement policies, form, a part of the fuel consumption and emission cost adoption of Electric Vehicles:
it should consist of decisions around investment in reductions or alternatively by e.g. gamification granting
charge point facilities at the office premises, together The first step is identifying when an EV is most
the best BEV use performance by incentives.
with providing home charging solutions and enabling appropriate based on how and where the vehicle is
easy access to public charging. used, as well as how and when it can be recharged.
7 – PLAY THE FLEET BEV METRICS This is based on our SMaRT approach allowing for
Thanks to our full e-service package including charging the fleet analysis, electrification potential definition
solutions, telematics or real time data sharing (by the New utilization, cost and benefit metrics are there
and enabling the right EV suggestion.
vehicle or mobility apps) and your own fleet’s data can to monitor and to manage in order to allow you to
be used to define and optimize the charging infrastruc- optimize fleet running costs and consolidate driver The next step is ensuring convenient charging
ture strategy as a continuous learning and feedback performance including maximizing driving range and solutions at home or at office locations that can be
cycle. charging behaviour using charging reports, diagnostics bundled together with optional green energy as part
efficiency (car diagnostics, predictive prognosis, heat of the EV operation leasing as well as a payment card
reports, parking apps etc.) and / or real-time informa- for public or partner networks supported by a mobile
5 – BUILDING A BEV COMMUNITY tion to re-loop it into our step approach, increasing app for availability of public charge points and pric-
Encouraging and sharing best practice together with the BEV maturity and to make optimal decisions about ing. The automatic energy refund for home charging
feed backing ideas for improvement are all examples your BEV fleet. is included making it easy for companies and fully
how individual successes can be used as a leverage to transparent for employees to switch to an EV.
increase the BEV transition and to help change atti- Furthermore, several services have been designed
tudes and driving patterns. to support flexibility and overall BEV adoption.
These include providing a conventional vehicle (ICE)
replacement for short period like holidays enabling
long trips for those won’t willing to do it with their
BEV. It also includes BEV trial periods of several
months to try electric mobility for longer durations
with no penalties if such a vehicle is returned.
25 Arval Fast Forward to Electric Vehicles6 | CONCLUSION
N
ew car offerings by OEMs are clearly, step by step, replacing oil
with electricity and data. Choosing the optimal powertrains for
fleets and individual drivers becomes more and more diverse and
dependent on individual needs, corporate policies, changing tax
environments and city access regulations.
Selecting the optimal powertrain is one thing; managing sustainably, the
energy transition in fleets is another challenge. It requires a well-balanced
combination of information, education, taking the right decisions and
moni- toring that ambitions are reached.
That’s why Arval is at your disposal to help you to make this journey.
26 Arval Fast Forward to Electric Vehicles7 | APPENDIX
Table 2: A non-limited list of new BEV models to be released
(source: announcements by Car Manufacturers)
SEGMENT MODEL PRE-SCHEDULED RELEASE PERIOD
Fiat 500e (BEV) End of 2019
Skoda City Go (BEV) 2020
Peugeot 208 (BEV) End of 2019
Opel Corsa (BEV) End of 2019
Small and City cars Honda-e (BEV) 2020
Opel Mokka (BEV) 2020
DS3 Crossback (BEV) End of 2019
BMW Mini End of 2019
Peugeot 2008 2020
Peugeot 308 (BEV) 2020
VW ID (BEV) 2020
Compact cars
Citroën C4 (BEV) 2020
Toyota C-HR (BEV) 2020
BMW iX3 series (BEV) 2021
Tesla Y (BEV) 2020
Large cars
MercedesEQA (BEV) 2020
Audi Q4 (BEV) 2021
BMW i4 series 2020
Audi e-tron (BEV) End of 2019
Luxury cars BMW iNext (BEV) 2021
Mercedes EQS (BEV) 2021
Jaguar XJ 2020
27 Arval Fast Forward to Electric Vehicles7 | APPENDIX
Table 3: Powertrain Comparison
MILD & FULL HYBRID PHEV EV HYDROGEN NATURAL GAS
Lower emission/ consumption Very low emission/consumption
Zero (tail-pipe) emissions Almost zero NOx and
especially in case of Full if charged well. Else higher Zero (tail-pipe) emissions
other than water vapour Particulate emissions
Hybrid (-25% less) emission/consumption than ICEs
+ Growing choice (primarily
Toyota & Lexus)
Electrification is the primary focus of OEMs which
is resulting in a growing model choice
Refuelling takes 3-5
minutes
Reduced CO2 and fuel
consumption
Considered to be a Reasonable range 24m vehicles on the road,
No ‘range anxiety’ Fiscal benefits
mainstream technology (+480km) very few in Europe
Limited range but steadily
Optimum fuel economy may Limited electric only range Installation remains
improving (+ 300km) and Very expensive technology
not be achieved on longer expensive, tanks require
(50–100km) up to 500km for models but should improve
journeys a lot of space
coming within 2 years
– Impact of new WLTP tests
is still unclear
Impact of WLTP new tests
is unclear
Still relatively expensive though
the decline of battery costs will
reach the price parity with ICE
Very limited model choice Very limited model choice
quite soon
Charging infrastructure is relatively limited Extremely limited Limited distribution
but (very) rapidly growing refuelling infrastructure network
Better suited to urban / short Better suited to journeys Limited Daily Mileage depending Potentially one Some opportunities
journeys less than 160km on charging facilities for the long future for commercial fleets
28 Arval Fast Forward to Electric Vehicles7 | APPENDIX
Table 4: Diesel – Petrol Comparison
KEY FACTORS FUEL TYPE COMPARISON
Emissions
Diesel has generally lower emissions thanks to their lower consumption and despite that the CO2 emission per
CO2
litre is about 10% higher than Petrol, but the difference with Petrol can now often be quite small 5–10g/km.
New diesel engines are considerably cleaner than previous versions. Though their 6d NOx norm is about
20% higher than its Petrol equivalent, RDE testing shows that for some cases the differences with Petrol are
NOx sometimes insignificant. Furthermore the introduction of RDE2 compliant models will make diesel and petrol
essentially comparable by 2023.
Cost comparison
List / lease price Price premium for diesel models (€1k - €2k) which usually results in a higher lease cost.
Diesel is usually significantly more fuel-efficient which results in lower fuel / running costs
Fuel efficiency
regardless of fuel price variations.
Lower fuel costs for diesel usually offsets the higher lease costs for a lower TCO. However, this varies
TCO significantly by make, model and mileage and so a car policy based on TCO and Driver Profiling will always
ensure that the correct fuel type is utilised.
Future influencing factors
Taxation on diesel cars / fuel may increase due to Air Quality pressures which would increase the TCO. However,
Taxation
taxation on petrol cars / fuel could also increase due to CO2 pressures.
City centre access restrictions / charges will increase over time. Euro 6d is likely to be the primary criteria which
and so minimal impact on fleets in the near future. However, full diesel bans are likely to gradually appear over
Access restrictions
time along with zero emission zones but the rate at which these are introduced is likely to be relatively slow.
Additionally, a release of Euro 7 might change existing and future access criteria.
CSR CSR pressure is likely to increase. Focus is likely to be on electrification rather than petrol or diesel.
29 Arval Fast Forward to Electric VehiclesCONTACTS
ARVAL COM M UNICATION
Sarah McArthur
Sarah.mcarthur@arval.com | +44 (0)1793 884511
ARVAL CONSULTING
David Watts
david.watts@arval.com
January 2020 – Design: Blend.frYou can also read