First Information Meeting - Fiscal 2021 May 28, 2021

Page created by Marion Fernandez
 
CONTINUE READING
First Information Meeting - Fiscal 2021 May 28, 2021
Fiscal 2021
First Information Meeting
May 28, 2021
First Information Meeting - Fiscal 2021 May 28, 2021
Contents

           1
First Information Meeting - Fiscal 2021 May 28, 2021
MS&AD Group Overview

  Holding company

         Domestic Non-Life                     International
                                        Non-Life Insurance

                                                                    Life Insurance
                                                            Asia
                                  Regional Business       Europe
                                                         Americas
                                        Telematics and Mobility
        Mitsui Direct General
                                       Head Office Reinsurance
        Insurance

             Domestic Life
                                           Financial Services
        Mitsui Sumitomo Aioi
        Life Insurance

        Mitsui Sumitomo Primary          Risk-Related Services
        Life Insurance

                                                                                     2
First Information Meeting - Fiscal 2021 May 28, 2021
Abbreviations of company names used in this presentation.
  • MS&AD Holdings, Holding Company : MS&AD Insurance Group Holdings, Inc.
  • MS&AD : MS&AD Insurance Group
  • MSI : Mitsui Sumitomo Insurance Co., Ltd.
  • ADI : Aioi Nissay Dowa Insurance Co., Ltd.
  • Mitsui Direct General, MD : Mitsui Direct General Insurance Co., Ltd.
  • MSI Aioi Life, MSA Life : Mitsui Sumitomo Aioi Life Insurance Co., Ltd.
  • MSI Primary Life, MSP Life : Mitsui Sumitomo Primary Life Insurance Co., Ltd.
  • InterRisk, IRRC : MS&AD InterRisk Research & Consulting, Inc.
  • MS Amlin : Sum of business segments including AUL,AAG,AISE and ACS
                  AUL MS Amlin Underwriting Limited
                  AAG MS Amlin AG
                  AISE MS Amlin Insurance SE
                  ACS MS Amlin Corporate Services Limited
  • MS First Capital, MSFC : MS First Capital Insurance Limited
  • Challenger : Challenger Limited
  • Aioi : Aioi Insurance Co., Ltd.
  • NDI : Nissay Dowa General Insurance Co., Ltd.

                             Caution About Forward-Looking Statements
This presentation contains statements about future plans, strategies, and earnings forecasts for MS&AD Insurance
Group Holdings and MS&AD Group companies that constitute forward-looking statements. These statements are
based on information currently available to the MS&AD Group. Investors are advised that actual results may differ
substantially from those expressed or implied by forward-looking statements for various reasons. Actual performance
could be adversely affected by (1) economic trends surrounding our business, (2) fierce competition in the insurance
sector, (3) exchange-rate fluctuations, (4) changes in tax and other regulatory systems, etc.

                                                                                                                       3
First Information Meeting - Fiscal 2021 May 28, 2021
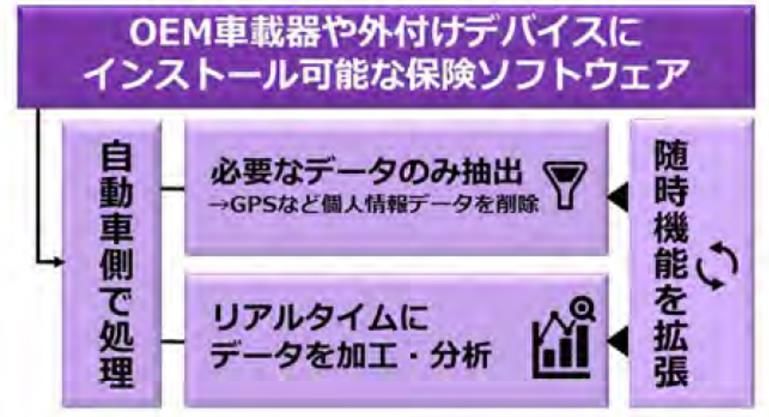
Introduction: Looking Back on FY2020
FY2020 Results
  • Initiatives Aimed at Business Style Reforms
    • Due to the COVID-19 pandemic, we began FY2020 under an environment of uncertainty over the
      future outlook, but the MS&AD Insurance Group has been able to maintain the health of its employees
      and continue operating through the use of digital technologies.
    • Although FY2020 was expected to be a difficult year due to the impact of the consumption tax hike,
      CALI* rate changes and amendments to the civil code regarding obligations, we worked on business
      style reforms, revised business processes and promoted the shift to paperless operations, achieving
      Group-wide cost reductions of approx. ¥34 billion yen as a result.
  • FY2020 Results
    • Although premiums at overseas subsidiaries declined due to efforts to improve profitability, the
      domestic non-life insurance business showed strong performance in voluntary automobile and fire
      insurance, which resulted in one of the industry's highest topline growth figures.
    • In FY2020 there were special factors including the recording of ¥65.8 billion in incurred insurance
      payouts due to COVID-19, particularly in the international business, and the burden to accumulate
      policy reserves in the domestic non-life insurance business, but due to additional cost-cutting
      measures, a record revenue in the domestic life insurance business and strong performance in
      voluntary automobile insurance, we managed to exceed our forecasts for both Group Adjusted Profit
      and net income.

Looking Toward FY2021
  • FY2021 is the final year of the current medium-term management plan, Vision 2021, and the Group will
  make a concerted effort to achieve the plan’s target Group Adjusted Profit of ¥300 billion.
  • In light of the changes to the business environment and the results of our efforts under Vision 2021, we
    will realize a medium- to long-term growth based on the CSV x DX x Global concept.
                                                                         * CALI: compulsory automobile liability insurance

                                                                                                                             4
First Information Meeting - Fiscal 2021 May 28, 2021
Ⅰ.   Aspirations in 2030
First Information Meeting - Fiscal 2021 May 28, 2021
1. Business Environment

Economic Circumstances                              Future Business
                                                                                                 Evolution of Technology
and Social Conditions                                Environment

 Slowdown of the domestic economy and sustained growth         Rise of digital platform holders
  in developing economies in Asia and elsewhere                 Widespread adoption of IoT devices due to 5G
 Accelerating changes to life and business styles triggered    Rising cyber risks
  by COVID-19                                                   Advance of automotive technologies (autonomous
 Impact of intensifying conflict between the US and China       driving, flying cars)
 Rising interest in ESG and climate change                     Further penetration of digital technologies in our daily
 Ongoing low interest rates worldwide                           life, such as cashless payments (the realization of
 Decline in domestic vehicle ownership and new housing          Society 5.0)
  starts
 Advancement of health and expanded healthcare
  business

 By solving social issues through technical innovation including digital solutions, we will
  achieve sustained profit growth.
 We will improve corporate value by achieving growth in Asia and enhancing our presence in the
  global insurance market while maintaining our competitive advantage domestically.

                                                                                                                            6
First Information Meeting - Fiscal 2021 May 28, 2021
2.The Vision of the MS&AD Group

                     The Vision of the MS&AD Group

A corporate group that supports a resilient and sustainable society

• Taking the initiative in responding to climate change and contributing to the
  realization of a sustainable society.
• Our brand recognition will be grained globally through our world-leading unparalleled
  products and services to solve social issues on a global scale.
• Our products and services will be incorporated into people’s lives and business
  activities. When risks are about to occur, proactive warnings and risk avoidance advice
  will be issued, and our services and economical compensation will be provided
  seamlessly once risks do occur.

                                                                                            7
First Information Meeting - Fiscal 2021 May 28, 2021
3.Aspirations in 2030
 Achieve a growth rate and capital efficiency appropriate for a “world-leading insurance and financial services group.”                               (¥bn)
                                                                                                                                                   500.0
 Finance
        Profit Level                                                                                                                                     12.0%
                                          ROE
         (IFRS basis)

       ¥500.0 billion                     12%                                  8.0%                  8.5% 300.0
   Reference: Profit level of global peers*                             6.1%     233.1 6.7%
                                                                                          214.6
                Profit Level      ROE                                189.8
    Company A      ¥1 trillion    12.6%
    Company B   ¥830.0 billion    14.5%
    Company C   ¥630.0 billion    13.0%
    Company D   ¥600.0 billion    12.3%   * Profit is on an FY2019
    Company E   ¥480.0 billion     9.5%     adjusted basis
                                            ROE is the average
    Company F   ¥440.0 billion     3.8%     value from 2015-2019

   E                 CO2 emissions
                2030                         2050                              Vision 2021                    Next Plan              After Next Plan
          50% reduction
        (compared with FY2019                Zero                       2018   2019     2020       2021        -         2025            -          2030   (Fiscal
               levels)                                                                                                                                      Year)
                                                                                                 (Forecast)

   S                                                                                  Group Adjusted Profit                Group Adjusted ROE
                             D&I (by the end of 2030)
       Percentage of             Percentage of female Percentage of female
      female officers*           managerial positions    line managers
    (holding company)               (Group target)       (Group target)

            30%                           30%                        15%
                                                                                                                   * Directors + auditors + executive officers

                                                                                                                                                               8
First Information Meeting - Fiscal 2021 May 28, 2021
4.Growth Vision

Profit Level
                                                   CSV ×     DX   × Global

                                      (4) Create and generate revenue           (3)+(4) Results
                                            from new businesses

                                                                                Aiming for a profit of
                             (3) Generate revenue in areas before and after       10.0 billion yen
                            insurance coverage (“MS&AD Value Strategy”)

                  (2) Expand international business foundations and invest
                                      in new businesses

               (1) Reinforce and improve the existing earnings base

    Vision 2021                 Next Medium-Term
                     2021       Management Plan     2025                 2030

                                                                                                         9
5. CSV × DX     -based growth (1) Achieving Profitability in the Areas Before
and After Insurance Coverage (MS&AD Value Strategy)
                                                    Inform and prevent                                        Provide coverage     Minimize      Recover
                                                             risks                                               (protection)       Impact         quickly

 Pattern 1: Riders          Example                                                                           Mimamoru Automobile       Accident emergency
                                                 Safe driving support alerts
                                                                                                                   Insurance                call service

      Customer               Driving diagnostic reports                                                                             Call to confirm safety
                              ➡ Scores driving status and offers safe driving advice                                                  when a collision occurs
                                                                                                                  Insurance-
                                                                                                                                     Ascertaining the
Conventional     Riders,     Safe driving support alerts                                                           based             circumstances of an
 insurance        etc.        ➡ Issues warnings when crashing ahead, suddenly accelerating,                        coverage           accident using dash cam
  contract     (services)       braking heavily or traveling in the wrong direction on an                                             footage
                                expressway                                                                                           AI-based video analysis
                                                                                                    Loaning of dash cam

                                                                         MSI                                    ADI

 Pattern 2: Service         Example                                                                                 Mimamoru             Support for prompt
 Usage Contracts                       Detecting and Defending From Cyber Attacks                                 Cyber Insurance         initial response

      Customer
                                       Security software that    • Discovers a virus attack or unauthorized
                                                                   access through behavioral detection                Insurance-       Specialist
                            Boken      prevents incidents and    • Also provides support from detection to                             contractor referral
                            Cyber      supports early recovery     defense against unknown threats                      based
Insurance
                Service                                          • Collects PC logs in real-time to                                    service when an
                 Usage                                             continually visualize the presence of               coverage        incident occurs
 Contract                                                          information leaks, extent of impact and
                Contract
                             Annual fee of ¥12,000 per license     other information                                                   (free)

                                           MS&AD InterRisk Research & Consulting, Inc.                                                   External Partners
                                                                                                                          MSI

                                                                                                                                                                10
5. CSV × DX      -based growth (2) Creating New Businesses and
    Achieving Profitability
                RisTech                                                                 Telematics Data Business in the U.S.
1    Smart Mobility                                Storage of all DCM data                                                                            Telematics Data Analysis
                                                   Big data analysis                                                                    Examples     Distance driven
                         Providing new safe                                                                                                           Driving duration and time of day
                          driving warning                                                                                                             Braking and acceleration actions, etc.
                             solutions
                                                                                                                                                                                    Partner Insurance
                                                                                          Toyota Connected                                        TIMS                            Companies in the U.S.
                                                 Customers

     Smart Cities                                                                                                                                                      Driving
2                                                                                                                 Driving
                                                                                                                                                                         Data
                         Providing solutions                                Driving                                Data
                                                                                                                                                                   (for insurance)
                            to mitigate or                                   Data                                  (for
                                                                                                                                                                          +
                                                                                                                insurance)
                         minimize accidents                                                                                                                          Added value
                          involving people
                                                                                                             Data usage fees                                      Data usage fees

                                                                                                    Reasonable
                                                                      Safe driving
     Social Infrastructure                                                                       telematics-based
3                                                                       advice
                                                                                               insurance premiums
     Maintenance           Providing social
                            infrastructure
                             maintenance                                    Optimum Telematics-based Automobile Insurance Services
                              solutions
                                                                           MOTER Technologies (US-based software development company)
                                                  Insurance software that can be installed on                                                Effects
4    Climate Change Analyzing the impact         OEM in-vehicle equipment and external devices
     Risks                                                                                                                                   - Reduces data processing costs significantly
                       on companies
                        including their supply
                                                                                                                                             - Mitigates the risk of personal information leaks
                         chains and providing                                                                                                - Optimum risk calculations possible due to OTA*

                                                                                                                  Expand functionality
                                                                      Only extract the necessary data
                                                                      Delete personal information data
                                                    Automobile-side

                            risk mitigation
                                                                       such as GPS information
                                                      processing

                                                                                                                      as needed
                               measures

                                                                                                                                               Research into insurance software will
                                                                                                                                              lead to the development of specialized
                                                                       Real-time data processing
                                                                       and analysis                                                                  next-generation products
                                                                                                                                            *OTA (Over the Air): technology for data transfer and
                                                                                                                                            software updates through wireless network

                                                                                                                                                                                                     11
Ⅱ.   Progress of “Vision 2021”
1.Progress Toward Aspirations
   Our scale, financial soundness, and profitability are maintained at the target level.
   We will continuously strive to achieve the targets in terms of capital efficiency, portfolio diversity, and the
   share of strategic equity holdings.
                                                            Vision 2021 (FY2018 - FY2021)
                                                                                                                            Image of society in 2030
                                                 Development of management based on CSV*
                                                                                                                                 A resilient and
                                                         Achieving the medium-term aspirations                                 sustainable society
                                                         Building resilient systems that can respond to changes
                                                         in the environment
                                                                                                                   Medium-term aspirations (FY2021 Target)
                                                                                   Progress in FY2020             “World-leading insurance and financial
                        Next Challenge 2017
                                                                                                                              services group”
                         (FY2014 - FY2017)

                                                       Scale                               9th              Within the top 10 non-life insurance
                                                                             (FORTUNE GLOBAL 500 2020, P&C) groups in the world
New Frontier 2013       Construction of
(FY2010 - FY2013)       the story of                   Capital efficiency                 6.7%                    Group Adjusted ROE 10%
                        value creation
                        Enhancing earning power in     Financial                         235%
  Formulation           domestic non-life insurance
                                                       soundness
                                                                                                                  ESR 180% - 220%
  of Mission,           business                                                Ref.: UFR applied 246%
  Vision and            Improving capital efficiency
                                                                                                                  50% (profit basis) in other than the domestic
  Values                                               Portfolio diversity                 32%                    non-life insurance business
  Improving profitability
  in domestic non-life
                                                                                34.0% of integrated risk
                                                                                                                  Strategic equity holdings less than 30% of
  insurance business                                   Share of strategic               amount                    integrated risk amount and below 10% of
                                                       equity holdings        11.8% of consolidated total
  Ensuring financial                                                                                              consolidated total assets
  soundness                                                                             assets
                                                                                   EI Combined Ratio
                                                                                                                  Combined ratio in the domestic non-life
                                                       Profitability            ex. natural catastrophes          insurance business stable at 95% or less
*CSV:Creating Shared Value                                                               91.7%
                                                                                                                                                                  13
2.         Progress Toward Numerical Management Targets and Forecasts
  Group Adjusted Profit for FY2021 is forecast to rise by 85.3 billion yen to 300.0 billion yen.
  Net income is expected to rise by 85.6 billion yen to 230.0 billion yen.                                                                     (¥bn)

                                                         FY2018         FY2019                 FY2020                       FY2021 Forecast
                                                         Results            Results       Results   Vs . Forec as t   Forecast    YoY     Vs . Target

 Group Adjusted Profit                                     189.8             233.1         214.6            4.6         300.0     85.3             -
     Domestic non-life insurance
                                                           146.9             119.5         158.5         -10.5          171.0     12.4         -6.0
     business
     (excluding gain/loss from sale of
                                                             65.1             98.4         119.9         -26.1          136.0     16.1        -14.0
     strategic equity holdings)
     Domestic life insurance business                        31.6             29.7          56.9          25.9           43.0     -13.9         2.0

     International business                                    5.4            49.4           -7.1        -11.1           80.0     87.1          5.0
     Financial services business/
                                                               5.8             4.8            6.1           0.1           6.0      -0.1        -1.0
     Risk-related services business
 Group Adjusted ROE                                         6.1%              8.0%          6.7%      - 0.1pp           8.5%     1.8pp     - 1.5pp

 Net Income/Losses                                         192.7             143.0         144.3            4.3         230.0     85.6           -

 Consolidated net premiums written                       3,500.4        3,573.7           3,500.9         40.9        3,613.0    112.0         33.0
 Life insurance premiums            (gross
                                                         1,599.9        1,393.4           1,297.3       189.3         1,200.0     -97.3       200.0
 premiums)
 EEV of MSI Aioi Life                                      819.4             890.2         958.3          36.3        1,010.0     51.6         48.0

                                                                                                                      180%~
 ESR (Economic Solvency Ratio)                             199%              186%          235%              -                       -           -
                                                                                                                        220%
※ Gross premiums income is for domestic life insurance subsidiaries only.
                                                                                     10                                                                 14
2.        Progress Toward Numerical Management Targets and Forecasts

                                         Group Adjusted Profit and Group Adjusted ROE
 Group Core Profit and Group ROE                                                                                                        (¥bn)
         New Frontier 2013                                Next Challenge 2017                                     Vision 2021
■   Domestic Non-life           ■   Domestic Life Insurance Business
                                                                                             Group Adjusted ROE
Insurance Business
■   International Business      ■   Financial Services Business/Risk-      ■    Others*
                                    Related Services Business
     Group ROE
                                                                        7.9%                                                         8.6%          8.5%
                                                                                                      8.0%
                                                  5.9%                                                               6.7%
                                                             5.2%                          6.1%                                                    300.0
                         5.0%
                                      4.5%                                        3.7%
                                                                                                                                     274.1

                                                                        213.7      105.1               233.1
 0.8%                                                                                                                214.6
                                                                                           189.8
                                                  155.7       147.5

                                       94.8
                             87.4

            -5.6%
  14.5

             -87.5
 2010         2011           2012     2013        2014        2015      2016      2017     2018        2019           2020           2020          2021
                                                                                                                                                  Forecast
                                                                                                                                Excl. COVID-19               (Fiscal
                                                                                                                                incurred losses               Year)

  *Decrease in income taxes paid in FY2019 among the effects of Reorganization of International Regional Business of MSI

                                                                                                                                                                  15
3.Targets and Results of Non-Financial Indicators

                                                                                                                                                                    Group Targets for FY2020
                                 Theme                      Indicators                      FY2019 Results                       FY2020 Results
                                                                                                                                                                            Onward
 Creating Shared Value         Seven Key       Development and improvement of                         ・Deal with new risks
                                                                                                                                                                 For the seven key issues, decide on four
                               Issues          products for creating shared value with                ・Create a safer mobility society                           methods of approach (provision of products
                                               society                                      Seven     ・Strive for resilient community development                and services, investment and finance,
                                                                                              Key     ・Support “good health and longevity”
                                                                                                      ・Contribute to climate change mitigation and adaptation
                                                                                                                                                                 research and policy recommendations, and
                                                                                            Issues                                                               contribution to society) and periodically
                                                                                                      ・Strive to improve the sustainability of natural capital
                                                                                                      ・Work toward the realization of “leaving no one behind”    ascertain progress qualitatively.

 Quality that earns the        Quality         Customer satisfaction survey about                    97.7%                                  97.3%                Equal to or greater than the previous year
                               improvement     insurance contract procedures
 trust of society
                                               Customer satisfaction survey about                    96.6%                                  96.7%                Equal to or greater than the previous year
                                               payment of insurance claims

                               Reduction of    CO2 emission reduction rate                           -20.7%                                                      Reduce CO2 emissions by 50% by 2030
                               environmental   Reduction rates from the base year(FY                                                                             and by 100% by 2050 versus the base year
                               burden          2009)                                                                                                             (FY2019)
                                                                                                                                    To be disclosed in
                                               Total energy consumption✓                         943,090GJ                       Integrated Report 2021
                                               ( ) versus base year                               (-33.4%)

                                               Paper consumption                                     11,080t                                                     Improvement compared to the previous
                                                                                                                                                                 year

 Management platforms          Diversity &     Percentage of female managers in                       14.8%                                 16.1%                30.0% (FY2030)
                               inclusion       Japan✓                                                (20.0%)
 that enable employees to                      ( ) consolidated including overseas
 play active roles
                                               Employee satisfaction “play active roles”         4.5 points                               4.5 points             Equal to or greater than the previous year

                                               Number and ratio of global employees✓        9,236 people (22.2%)                  9,230 people (22.2%)           Key monitoring indicators other than
                                                                                                                                                                 sustainability KPIs
                                               Ratio of employees with disabilities*✓                2.42%                                  2.48%

                               Health          Employee satisfaction “Pride, job                 4.4 points                               4.4 points             Equal to or greater than the previous year
                               management      satisfaction”

                                               Number of annual paid holidays taken              15.7 days                          To be disclosed in           Equal to or greater than the previous year
                                                                                                                                 Integrated Report 2021
                                               Ratio of taking fully paid paternity leave            64.6%                                                       Equal to or greater than the previous year

                                               Number of employees participating in            27,673 people                           26,519 people             Equal to or greater than the previous year
                                               social contribution activities

✓The FY2019 figures are guaranteed by a third party, KPMG AZSA Sustainability.                * As of April 1, 2021

                                                                                                                                                                                                              16
4.      Impact of COVID-19

                                            Impact of COVID-19 (FY2020)
    The impact from incurred losses attributable to COVID-19 was ¥65.8 billion, an increase of ¥17.8 billion over the last earnings
     forecasts.
    The negative impact on asset management profit of ¥28 billion mostly ended up not occurring due to a recovery of financial
     markets.

                                                                                    (¥bn)    MS Amlin                                  (¥bn)
                                                        Results                                                           Incurred losses
                                             MSI        ADI       Overseas subsidiaries
                                                                                             Business Interruption
                                                                             MS Amlin                                                  15.0
                                                                                             (Direct, UK and other)

Incurred losses associated
                                     65.8        5.2       16.7       43.8          42.8     Other (reinsurance, credit
with COVID-19
                                                                                             and surety insurance,                     27.7
- MSI: Overseas travel insurance, event cancellation insurance, business interruption        contingency reserve, etc.)
       insurance (mainly overseas reinsurance), etc.
- ADI: Head office reinsurance and others                                                    Total                                     42.8
- MS Amlin: Table on the right

                                      Impact of COVID-19 (FY2021 Forecast)
                             • In January 2021, we withdrew from underwriting business interruption insurance in the UK,
      Impact on                which was a factor in large losses during FY2020.
    FY2021 will be           • For insurance types that could be directly impacted by COVID-19 losses, the risk of infectious
        minor                  disease is excluded at each renewal.

                                                                                                                                               17
5.Three Key Strategies: Pursue Group’s Comprehensive Strengths
      For domestic direct written premiums, we have achieved a top industry-level growth rate for three consecutive years.
      At the same time, we have realized significant productivity improvements. Through reviews of organizational personnel and office
       reductions, etc., by the end of FY2025 we expect to have reduced costs by ¥100 billion.

                 Effects of Demonstrating the Group’s Comprehensive Strengths
              Top industry-level growth potential                                                                                 Productivity improvements                                            (¥bn)

                   (Domestic direct written premiums*1)                         (¥bn)                                                  (additional cost reductions)                     100.0

                                                                                                                           Initial plan                               80.0               20.0
                +2.6%                 +3.5%                   +1.3%                                                        (domestic and overseas)

                                                                                                                                             49.0
                                                                                                                     34.0                       19.0
                                                                                         *2 See p. X for details
                                                                                            on expense                  14.5
                                                3,053.7              3,094.6                reduction in the
                                                                                                                                                30.0
       2,876.2             2,950.3                                                          domestic non-life
                                                                                            insurance                   19.5
                                                                                            business

                                                                                                                   2020 (Results)         2021 (Forecast)         2023 (Outlook)      2025 (Outlook)    (Fiscal
                                                                               (Fiscal                                                                                                                   Year)
         2017                 2018                 2019                2020     Year)
                                                                                                                   *2 See P.28 for details of cost reductions in non-life insurance
    *1 Simple sums of non-consolidated figures for MSI and ADI. Excluding
    policyholder premium deposits.

                               Examples of Collaboration and Standardization Efforts

    Products / Sales                                                                                 Claims Support
                                                                                                                                                                                                   18
     Joint development of products based on standard systems                                           Mutual outsourcing between MSI and ADI
     Common sales techniques through joint proposals and campaigns                                     Partial sharing of claims web system

         Asset                                                                                      Administration /
      Management                                                                                       Systems
    Sharing expertise by having personnel assigned to the same operational                             Business process reform through revamping of online systems
     departments (MS and MSA Life)                                                                      Reduced system development and operating costs through standardization of products
    Joint investment and research including ESG investment                                              and administrative work

                                                                                                                                                                                                           18
5. Three Key Strategies: Promote Digitalization
   We steadily promote digitization and roll out the CSV x DX strategy globally.

                                                                                                               Examples of Implementation
     Expansion through CSV x DX                    Providing Risk Solutions Before And
                                                      After Coverage and Protection                                                               Position as core products and expand the product lineup
                                                                      Prevent                                                                                                            Reduce                      Support
                                                                                                                        Provide coverage (protection)
                                                               accidents and disasters                                                                                                   impact                      recovery

                                                                                                              商品ラインアップ(2021年5月)
                                                                                                                 Mimamoru automobile
             Transforming                                         Safe driving support alerts                        insurance                                                          Accident emergency alert service

         Products and Services                             Illness prevention through dedicated
                                                                            apps
                                                                                                                      Health and productivity
                                                                                                                   management support insurance                                           Support for recovery activities

                                                               Detecting and defending against                          Mimamoru cyber insurance                                        Support for prompt initial response
                                                                       cyber attacks                                      Trial sales started in April 2021

                                                  Digitizing the Process of Insurance Procedures                                                                                    System Integration with
                                                                               MS1 Brain Remote                                                                                       E-commerce Sites
                                                                                                                                                                  Rolled out on e-commerce and reservation sites
    Transforming Sales Channels
        and Sales Techniques                                                                                                                                                                      Insurance application system
                                                                                                                                                                                                          (embedded)
                                                              Solicitation/                Signing a              Policy Management                              Plan /
                                                                                                                                                                          Contractual
                                                                                                                                                                product                    Recom-                                              Payment
                                                            Making Proposals                Policy               and Incident Response                          search
                                                                                                                                                                          procedures
                                                                                                                                                                                          mendations
                                                                                                                                                                                                       Explanation     Entry    Confirmation

                                                                      Achieving end-to-end digitization

                                                                               Data Business
                                                                                        RisTech                                                                             US Telematics Data Business
                                                   - Development of safe driving diagnostic services using                                                    - Selling of data collected and analyzed from in-
        Creating New Business                        digital tachographs, “disaster prevention dashboard*”                                                      vehicle devices to insurance companies
                                                     tools for local governments, etc.                                                                        - Establishment of insurance software company
                                                   * Visualization of real-time water level data and area risks, etc.                                           MOTER

                                                                                Globalization
                                                                                           Asia                                                                  Telematics-based Automobile Insurance
            Global Rollout                         - Group roll-out of MS1 Brain. Launch of insurance                                                    - Sales of telematics-based automobile insurance in
    - in Japan, Asia and around the world -          sales in the Philippines. Considering additional                                                      five European countries (UK, Germany, France,
                                                     rollouts in other countries.                                                                          Italy, Spain), Thailand, etc.

                                                                                                                                                                                                                                                         19
5.Three Key Strategies: Reform the Portfolio
        Regarding diversification of the business portfolio, we expect to achieve a level of approximately 50% in FY2021 excluding the domestic non-
         life business.
        On the reduction of strategic equity holdings, we achieved the target of ¥500.0 billion (FY2017-FY2021) at the end of FY2020. As for the share
         in the integrated risk amount and consolidated net assets, we did not meet our target due to rising share prices, but will continue to carry out
         sales valued at around ¥100 billion in FY2021 and will aim to achieve the target level.
                  Diversification of Portfolio                                                              Diversification of Risk Portfolio
                     Percentage That Each Business                                                      Target and progress of sales of strategic equity
                   Accounts for Group Adjusted Profit                                                                     holdings                  (¥bn)

           Target: 50% excluding domestic non-life business                                                                                                               FY2021
                                                                                                                                                             100.0        (Plan)

                                                                               5.4%                            500.0          Accumulated sales              102.7
2018                          60.3%                            29.3%        5.0%                                                                                          FY2020
                                                                                                                              ¥502.7 billion
                                                                                                                                                             111.8        FY2019
                                                                                                              Sales target    (progress 101%)
                                                                                                             in Vision 2021
                                                                                                           (FY2017-FY2021)                                   136.7        FY2018
2019                        54.0%                     16.3%          27.1%       2.6%
                                                                                                                                                             151.3        FY2017

                                                                                                   Percentage in integrated                          Percentage in
2020                             68.2%                                32.3%         3.5%                                                        consolidated total assets
         -4.0%                                                                                           risk amount

                                                                                                    32.7     26.1    34.0       32.8                12.7          11.8    11.4
                                                                                                     %        %       %          %                   %     9.2     %       %
2021                       51.3%                    16.2%            30.2%       2.3% Target                                                               %                     Target
                                                                                            less than
                                                                                                                                                                               less than
                                                                                               30%
                                                                                                                                                                                  10%

       Domestic Non-life Insurance (excluding gain on sales of strategic equity holdings)
       Domestic Life Insurance                                                                                                            (Fiscal                                   (Fiscal
                                                                                                    2017     2019     2020      2021                2017   2019   2020    2021
       International                                                                                                                       Year                                      Year
                                                                                                                               Forecast    End)                          Forecast    End)
       Financial Services Business/Risk-Related Services Business

                                                                                                                                                                                       20
Ⅲ.   Growth Strategy by Business Domain

     1.Domestic Non-Life Insurance Business
     2.Domestic Life Insurance Business
     3.International Business
     4.Asset Management
Ⅲ.   Growth Strategy by Business Domain

     1.Domestic Non-Life Insurance Business
     2.Domestic Life Insurance Business
     3.International Business
     4.Asset Management
1.Domestic Non-Life Insurance Business
  (1) Current Status
                       Net Premiums Written*1 / Combined Ratio*2
                                      Net Premiums Written
                                                                                                             (¥bn)        Premium growth rate continuing at
              115.8%                  Combined Ratio
                                                                                                                          top industry level

                                                                                     2,824.7 2,840.9 2,853.0               Maintaining a strong top line
                                                                          2,746.0
                                                  2,699.5 2,670.2 2,722.3                                                  Accelerated growth through the CSV x DX strategy
                                        2,606.6
103.6%                        2,529.1
                    2,417.4
          2,343.9                                                             100.6%
                    102.1%                                                                                                Maintaining high profitability
2,176.9                        101.0%
                                          96.6%                                        96.4%    95.1%
                                                    93.4%
                                                                      94.1%                              95.1%             Offset deteriorating profitability of fire insurance caused
                                                             91.4%
                                                                                                                            by the increase in large claims and small claims
                                                                                                                            associated with lifestyle changes with other lines of
  2010     2011      2012      2013      2014      2015     2016     2017     2018     2019    2020      2021 (Fiscal       business
                                                                                                       (Forecast) Year)
                                                                                                                           Maintaining a good combined ratio through appropriate
                                                                                                                            underwriting
                                        Group Adjusted Profit*3                                                            Achieved steady growth in Group Adjusted Profit
                                                                                                              (¥bn)

                                                                     190.1
                                                                                                        171.0
                                                            153.3                              158.5
                                                                             146.9                                        *1 Simple sums of non-consolidated figures for MSI and ADI
                                                                                                                             (For FY2010, simple sums of non-consolidated figures for MSI, Aioi and NDI)
                                                                                     119.5
                                                                                                                          *2 Natural disasters excluding EI base
                                         92.4      91.9
                                                                                                                          *3 FY 2010 – FY2017 : Group Core Profit

                     61.9
                               47.8
  6.5
           19.7
                                                                                                                                              ROR
  2010     2011      2012      2013      2014      2015     2016     2017     2018     2019    2020      2021 (Fiscal
                                                                                                                                    (Average of FY2018 to                             11.9%
                                                                                                       (Forecast) Year)                   FY2020)

                                                                                                                                                                                                           23
1.Domestic Non-Life Insurance Business
 (2) Initiatives to Improve Profitability of Fire Insurance
     We will make steady progress on initiatives to improve the profitability of the fire insurance business and enter into the black during the
      next medium-term management plan.

                                             Outlook for Improving Profitability of Fire Insurance
                                                                                                                                                              (¥bn)
                                           Fire Insurance Underwriting Profit (before reflecting catastrophe loss reserve) *1

                         -3.1
                                             -61.6                                                               -49.4    *2    - Difficult circumstances continue due to an
    -48.1                                                                                                                         increase in large losses and small losses
                                                                                                                                  associated with lifestyle changes
                                                                                     -116.6     -135.1                          - We will enhance loss reduction efforts with
                                                                                                                                  the aim of moving into the black during the
                                                                  -197.2                                                          next medium-term management plan
     2015                2016                2017                  2018              2019        2020            2021
                                                                                                               Forecast (Fiscal Year)
*1 Simple sum of MSI and ADI    *2 Domestic fire insurance only
                 Effects of Rate Revisions
 (Total of Revisions in October 2019 and January 2021)                                              Examples of initiatives for reducing losses
                                                                                               Corporate
       Outlook for increase in underwriting profit (before reflecting
                                                                                              - Improve underwriting conditions and rates for high-risk policies
       catastrophe loss reserve)*3
                                                                                 (¥bn)        - Strengthen loss prevention and mitigation proposals: Coordinate with
                                                                                                InterRisk Research & Consulting, utilize RisTech, etc.
     FY           2021           2022           2023              2025       Final

Cumulative                                                                                    Household
 Effects         17.0           20.0           22.0           25.0          36.0
                                                                                              - Detailed rate segmentation based on building age
                                                                                              - Expand rate differential by accident frequency for products aimed at
*3 Simple sum of MSI and ADI (cumulative basis, rounded down below ¥1 billion)
                                                                                                condominium management associations
                                                                                              - Expand policies covering home contents with a stable claim rate as a set plan,
                                                                                                consider product and rate revisions ahead of revisions to the reference loss
                                                                                                cost rate, etc.

                                                                                                                                                                                 24
1.Domestic Non-Life Insurance Business
(3) Automobile Insurance
    Promoted safe driving through telematics automobile insurance and services.
    Improved customer satisfaction by expanding the provision of product and services based on the CSV x
     DX concept.

Conveying and preventing risks, promoting safe                                               Telematics automobile insurance customer
                   driving                                                                  satisfaction, continuation rate, state of sales
      Safe driving assistance report                                                           Customer satisfaction for telematics automobile insurance
       ➡ Objectively assess driving through individual safe driving                              is high and the continuation rate is also high.
       advice, etc.
                                                                                                100.0%                                98.0%
       Customers who view their driving diagnostic reports have a                                98.0%
       lower frequency of accidents                                                              96.0%                                        94.8%
                                                                                                              93.5%
                                                                                                 94.0%
                                                             Approx. 18%                         92.0%
       Viewed                                                 reduction
                                 8.3%                                                            90.0%                88.9%
                                                                                                 88.0%
       Did not                                                                                   86.0%
                                                                                                 84.0%
        view                      10.1%                                                                   Customer Satisfaction*    Continuation rate*
                                                                                                                                                         * Simple averages of MSI
                                                                                                  Telematics automobile insurance    Other insurance       and ADI survey results
      Improving safe driving scores through Brain Training
       Driving Skill Improvement Game
                                                                                             Sales

                                                 Access        Safe Driving Score
                                                 Count
                                                               TOUGH –      Mimamoru
                                                               Tsunagaru    Plus

                                                 Never         84.9         88.6
    Driving skill improvement training                                                      (Number of policies sold)                 * Approx. 53,000 TOUGH
    supervised by Professor Kawashima of the     1-5 times     87.9         91.9
                                                                                                                                        Tsunagaru Automobile
    Tohoku University Institute of
    Development, Aging and Cancer, famous
    for brain training games, is provided to
                                                 6+ times      88.8         92.4                Approx.   867,000                       Insurance policies
    policyholders through a smartphone app
                                                                                                                                                  * As of end of March, 2021

                                                                                                                                                                               25
1.Domestic Non-Life Insurance Business
     (4) Expanding Casualty Insurance
        We will promote initiatives that drive the CSV x DX strategy as a pillar of expanding profitability of the domestic
         non-life insurance business
     Sales of Packaged Products for Small-to-Medium-Sized                                                                  Responding to New Risks and New Markets
                          Companies
                                                                                                                                Develop products responsive to lifestyle changes
               Steady expansion in the small-to-medium-size
                                                                                                                                               and social needs
              company market where there is room for growth
                                                                                                                                            Development Examples
                State of Packaged Products for
              Small-to-Medium-Sized Companies*1
                                                                                 0.38 million
                                                                                                                              Comprehensive Remote Working Compensation
                CAGR 10.4%
                                                                                                                                      Plan (Launched May 2020)
                                                                                                                        Comprehensive coverage of the risks surrounding remote working being recommended
                                                            0.34 million                                                due to changing business styles
                                      0.31 million
                                                                                                                                 Damage to business PCs                                    PC Malware Infections
                0.28 million
                                                                                                                                                               Long Working Hours /
                                                                            80.7                                                                                   Harassment
                                                        73.2                                                           Policies sold in FY2020: Approx. 1,451 *2
                                   66.6
(¥bn)          60.0
                                                                                                                                  Compensation Plans for GIGA School Program
                                                                                                                                   Sales Businesses (Launched October 2020)
                                                                                                                          Supporting the operation of warranty systems to repair or exchange broken or
                 2017                2018                2019                 2020          2021 Forecast
                                                                                                                          malfunctioning products for companies engaging in the sale, etc. of laptop PCs and
            Gross premiums                        Policies                                   (Fiscal Year)                tablet device to local governments to achieve the GIGA School Program *3 being
                                                                                                                          promoted by the national government.

                                                                                                                 *2   Simple sum of non-consolidated figures for MSI and ADI

*1    Gross premiums basis for MSI’s Business Protector and Business J Next, ADI’s Tough Biz General Liability   *3   A program promoted by the national government to create an educational ICT environment that fosters qualities and
      Insurance, Tough Biz General Insurance for Construction Industry and Tough Biz Workers’ Accident                abilities leaving no child behind, by providing one device to each child and developing an integrated high-speed,
      Compensation Insurance                                                                                          high-capacity communications network.

                                                                                                                                                                                                                                     26
1.Domestic Non-Life Insurance Business
     (5) Improvement of Expense Ratio
   The initial forecast of expense ratio for the non-life insurance business was 35.1% (+2.0 percentage points over the
    previous fiscal year) due to the impact of system depreciation, increase in consumption tax, declining CALI revenue and
    revenue decline due to COVID-19 etc. But due to efforts to initiatives for cost reductions, the expense ratio ended up at
    33.7%, 1.4 points lower than planned.
   Progress of Improving Operating Expense Ratio
     in the Domestic Non-Life Insurance Business                           Stat of Large-Scale R&D Investment

System depreciation, etc.: +0.8 points
Impact of consumption tax increase: +0.2 points        Change in expense ratio*1                                                                                                                  Major Project*3 Cost Reduction Effects
Decline in revenue due to CALI revision: +0.9 points
Decline in revenue due to COVID-19: +0.5 points
                                                                                                                                                                                                  and Depreciation/Amortization Costs
                                                                                                      FY2020 initial forecast
                                                                                                                                                                                   (¥bn)                                                                                    28.5
                                                                                                                                                                                                                                                          26.1

                                                                                                                                             Cost reduction effects
                                                       35.1%
                                                                           34.9%                      FY2020 results and
                                                                                                                                                                      25.0
                                                                                                                                                                                                                                        23.4
                                                                                                      FY2021 initial forecast
                                                                                                                                                                                                                       19.3
                                            33.7%                  34.0%                           Level of
                  33.1%                                                                              31%    Level of                                                  15.0
                                                                                                              30%
                                                                                                                                                                                     4.5               3.2
                                                                                                                                                                       5.0
                     2019                     2020                  2021                     2025               Future target                 *4
                                                                  Forecast                  Target                    (Fiscal Year)

                                                                                                                                        amortization, etc.
                                                                                                                                        Depreciation and
                                                Change in expense ratio*1
                                               (excluding R&D*2 Expense)                                                                                               -5.0
                                   33.9%                                  33.6%
                                                                                                                                                                      -15.0        -13.4
                                                                                            Level of
                                                                                              31%
                                                                                                                                                                                                                                                                            -15.2
           32.4%                        32.7%                32.8%                                                                                                                                                                                        -18.7
                                                                                                                     Level of                 *5
                                                                                                                                                                      -25.0                          -21.1            -22.3
                                                                                                                      30.0%                                                                                                             -23.1                                            (Fiscal
                                                                                                                                                                                   2020               2021              2022              2023             2024              2025         Year)
                                                                                                                                                                                  Results             (Figures for FY2021 onwards are planned)

                    2019                     2020                 2021                      2025              Future target
                                                                Forecast                   Target                     (Fiscal Year)                                     *3: Sum of Online System Renovation, BRIDGE joint claims services system and standardization of products and operations
      *1: Simple sum of non-consolidated figures for MSI and ADI                                                                                                        *4: Conversion of expected workload reductions due to business streamlining into expenses
      *2: Investment costs for measures to respond to environmental changes, including infrastructure construction and R&D to improve                                   *5: Including depreciation and amortization + system development costs / operating costs (expense processing amount), costs
          productivity and quality.                                                                                                                                         to deal with aging servers

                                                                                                                                                                                                                                                                                           27
1.Domestic Non-Life Insurance Business
(6) Business Style Reforms
  Steady progress has been made with cost reductions through business style reforms, and a decrease of ¥34.0 billion was
   achieved for FY2020.
  Building upon these plans, we will aim to achieve cumulative cost reductions of ¥100 billion by the end of FY2025.
    Expected Cost Reduction Effects                                          Main Cost Reduction Measures

                                                             Domestic
                                                (¥bn)
                                                                                          Effects of large-scale R&D investment
       Vision2021                        100.0              Business Streamlining          - Renovation of online systems
                                                            (Sales and claims services     - Standardization of products and
        Stage 2                                             operations)                      operations
                             80.0                                                          - BRIDGE (joint claims services system)
                                                                                          Business streamlining through the use of
                                                            Paperless Solutions            digital technologies
                                                                                           ... and more
                                                            Revisions to Office           Revisions to reduced office space
                49.0                                        Space                         Lower transportation and business travel
                                                                                           expenses due to fewer movements
                                                            Remote Work
  34.0                                     78.0                                           From-scratch review of existing operations
                                                            Review of Measures, etc.       ... and more
                              62.0
                                                             Overseas
                32.0                                                                      Abolition of overseas holding companies
                                                            Organizational
   18.0                                                                                   Appropriate allocation of personnel
                                                            Streamlining
                                                                                           etc.
    2020          2021        2023         2025 (Fiscal                                   Revised division of duties between head
                Forecast     Outlook      Outlook Year)                                    office and overseas sites
                                                            Operational
                Domestic non-life                                                         Business streamlining through the use of
                                                            Streamlining
                                                                                           digital technologies
                                                                                           ... and more

                                                                                                                                        28
1.Domestic Non-Life Insurance Business:
(7) Net Premiums Written by Class of Business
                                                                                                                                                                                   (¥bn)

               Fire and Allied                  Marine                Personal accident                      Voluntary Auto                 CALI             Other
                                                                                                                                                               2,840.9     2,853.0
                                                                                                                                      2,746.0      2,824.7
                                                                                  2,699.5        2,670.2         2,722.3
                                                                 2,606.6
                                                 2,529.1                                                                                        416.4         422.5       439.8
                                 2,417.4                                          337.4                            379.4           398.1
               2,343.9                                            307.7                            373.9
                                                 290.7
2,176.9                          279.4                                                                                                                        300.6       280.8
                 274.1                                                                                                                          346.7
                                                                                  357.1                            351.5           337.3
                                                                  347.8                            355.6
 254.6                                           337.7
                                 310.0
                 291.2
 258.6

                                                                                                                                                1,383.4      1,412.9     1,445.0
                                                                1,291.4          1,317.4                          1,343.2         1,342.1
                                                1,267.2                                          1,334.6
               1,202.4          1,235.4
1,111.5

                                                                                  204.5                                            215.3        203.5         203.6       209.8
                                                 217.3            219.1                            204.9           208.9
 191.8           211.9           214.9                                             72.7                                                          69.1          60.0        59.3
                                                  67.9             72.8                             64.1            67.9            70.4
  60.6           61.7             63.3
                                                 348.0            367.5           410.1                            371.1           382.6        405.2         441.1       418.2
 299.5           302.4           314.2                                                             336.9

 2010            2011             2012            2013            2014             2015            2016            2017             2018         2019         2020        2021 (Fiscal
                                                                                                                                                                                  Year)
 * Simple sums of non-consolidated figures for MSI and ADI ( For FY 2010, simple sums of non-consolidated figures for MSI, Aioi and NDI).
                                                                                                                                                                         Forecast

                                                                                                                                                                                          29
1. Domestic Non-Life Insurance Business:
     (8) Underwriting Profit/Loss by Class of Business
                                                                                                                                                                                                                             (¥bn)
         Others                                   Voluntary Auto                                                                                                            62.8                  8.4               11.4
         Personal Accident                        Marine                                                                       121.3                  89.3
                                                                                                             43.9                                                           40.9                 19.3                 23.1
         Fire and Allied                          Total                                                                            19.8
                                                                                                               16.9                                    50.1
                                                                                                                                                                             96.2
                                                                                       28.7                    91.3                                                                             105.3                125.6
                                                                                                                                  111.6
                                                                                         58.5                                                          85.3
      32.7                30.6                15.5                 15.2                                                                                                                    10.5
                                                                                                  3.8
                                                                                                   7.911.6                                                              11.1 8.8
         6.5              10.4             3.4 9.5
                                         - 7.3                    4.0 7.2                                                       4.7
                                                                                                                                     8.5
                                                                                                                                                     4.6 5.0                                            11.5           9.6
                                                                   - 52.2              - 19.4 - 2.1                              - 23.4
    - 50.7                                   - 24.1                                   - 12.0                                                          - 55.9
                                                                                                    - 83.8                                                                 - 94.3
    - 18.4                                     - 3.0                  - 10.3                                                                                                                   - 138.4              - 142.7
                        - 174.0                                   - 36.1
   - 53.9
- 83.7                                                                                                                                                                                                                - 4.2
                          - 6.4

                         - 50.6
                   - 190.0                                                                                                                                                                                                    (Fiscal
      2010                2011                 2012                 2013                 2014                  2015                2016                2017                 2018                 2019                 2020     Year)

             Item/Fiscal Year                          2010           2011          2012           2013          2014           2015          2016           2017          2018           2019          2020          2021
                                                                                                                                                                                                                    Forecast

Underwriting Profit                                      -83.7        -190.0           -3.0           -36.1           28.7          43.9         121.3           89.3          62.8            8.4        11.4           92.0
  Net reversal of catastrophe reserve
                                                           -0.0        139.5           41.9              3.0        -31.3          -81.6         -81.8          -44.6          79.8          -33.3       -65.3          -44.5
  (profit impact)
  Underwriting profit
                                                         -83.7        -329.5          -44.9           -39.1           60.1        125.6          203.1         133.9          -16.9           41.8        76.7         136.5
  (before reflecting catastrophe reserves)
          Impact of natural catastrophes*1
                                                         -65.9        -311.5          -55.1           -96.3         -27.2          -68.1         -51.0        -118.8        -235.3         -122.9        -85.0          -82.1
          (ref.)
* Simple sums of non-consolidated figures for MSI and ADI. ( For FY 2010, simple sums of non-consolidated figures for MSI, Aioi and NDI).
*1 The figures show incurred losses occurred domestic and overseas for MSI and ADI from FY2017. From FY2019, “Impact of natural catastrophes” means incurred loss from domestic and overseas natural catastrophes in the each year
   deducting the collected amount of Cat Bonds related to natural catastrophes in FY 2018.

                                                                                                                                                                                                                                     30
1.Domestic Non-Life Insurance Business:
(9) Balance of Catastrophe Reserve
  The provision ratio of fire insurance in FY2021 is 6% for MSI and 15% for ADI.

                                                      Balance of Catastrophe Reserve

                   Total(Balance)             Fire and Allied(Balance)                Total(Balance Rate)           Fire and Allied(Balance Rate)
                                                                                                                                                         (¥bn)

                                                                                                                                          950.5
                                                        842.5              887.1                                           906.0
                                                         80.9%                                              840.6
                                                                                           807.3
                                     760.7                                   71.9%
                  679.0
647.7                                  61.5%
 58.9%             58.9%

                                                                                                             45.8%           43.8%         45.9%
                                                                                            42.8%
                                                          36.4%              37.4%                                           35.7%         37.0%
                                       32.5%                                                33.5%            33.9%
 29.6%              30.1%

                                          252.3              272.6              266.9
    205.0              216.6                                                                                                   193.2          192.0
                                                                                               163.9           185.7

   2013               2014               2015               2016              2017            2018            2019            2020          2021      (Fiscal
                                                                                                                                           Forecast    Year)
* Simple sum of MSI and ADI
* Balance Rate = Balance of catastrophe reserve / Net premiums written (excluding CALI)

                                                                                                                                                                31
1.Domestic Non-Life Insurance Business:
    (10) Combined Ratio
                  New Frontier 2013                                        Next Challenge 2017                                                Vision 2021

                                                  WP Basis
                                                  EI Basis
                 116.4%                           WP Basis(Excluding impact of Natural Catastrophes)
                                                  EI Basis(Excluding impact of Natural Catastrophes)

                 115.8%

                                    105.1%
103.6%

                                                101.0%                                                                     100.6%
    102.9%
                                102.1%

                                                                96.6%                                                       99.4%             96.4%              96.7%
                                               98.2%                                                                                                   95.1%
                                                                                                           94.1%                                                  95.1%
                                                                              93.4%
                                                                96.0%                        92.6%                                            95.8%    93.0%
                                                                                                                                                                   94.6%
                                                                                                                            91.9%             91.7%
                                                                                                                                                      91.7%
                                                                                                              92.8%                                                91.9%
                                                                                                                                              91.4%
                                                                              91.6%            91.4%                           90.8%                    90.7%

     2010          2011           2012           2013           2014            2015           2016           2017           2018             2019     2020      2020 (Fiscal
                                                                                                                                                                Forecast Year)
•    Simple sums of non-consolidated figures for MSI and ADI ( For FY 2010, simple sums of non-consolidated figures for MSI, Aioi and NDI).
•    W/P: all lines, E/I: excludes residential earthquake insurance and CALI.

                                                                                                                                                                           32
1.Domestic Non-Life Insurance Business:
      (11) Combined Ratio (WP) in the Domestic Non-Life Insurance Industry
     1995 1996 1997 1998 1999 2000 2001 2002 2003 2004 2005 2006 2007 2008 2009 2010 2011 2012 2013 2014 2015 2016 2017 2018 2019 2020
                                                                                                                                                                                                     (Fiscal Year)
Catastrophe Great Hanshin Earthquake                                             Law,         Failure to pay incidental insurance claims
                                                                               institution
    Deregulation   Agreement reached in the US Japan Insurance Talks                               Law,          Suspension of business caused by non-payment of insurance claims
                    Cross entry between life insurance companies and non-life insurance          institution     associated with third-sector insurance products
                    companies into each other’s business through their subsidiaries
                                                                                                                                        117.2%
                     Deregulation Enforcement of the amended Act on Non-Life Insurance Rating Organization

                                            Industry    First industry reorganization
                                         reorganization (MSI, Aioi, NDI, Nipponkoa Insurance Company,
                                                        Tokio Marine & Nichido Fire Insurance,                                                    103.4%
                                                                                                     101.7%                 102.1%                                                             101.6%
                                                        Sompo Japan Insurance)
                           96.8% 97.9% 97.1%       96.2%                    96.2%                     96.0%                                             96.4%                     95.5% 94.1%             96.5%
                                                                                             94.2%                    103.1%                                      94.5%
    92.3% 91.8% 92.7%                                                               92.7%                                          Catastrophe                            92.0%
                                                            89.2% 88.5%                                                    Great East Japan Earthquake
                                                                                                                                                                                                                  86.8%
                                                                                                                                        Catastrophe Thai flooding
                                                                                                                                      83.4%
      Combined ratio                                         Abolition of regulations of entry into the third-sector
                                             Deregulation
                                                             insurance business, launches of cancer insurance and
                                                             medical insurance;
                                                             Start of OTC sales at banks                             68.1%                         70.4%
                                                                                                                             67.5%                                                                69.1%
                                                                                                                66.6%
                                                                            63.6%                     62.8%                                             64.1%                     63.4%                   63.9%
                                                                                                                                                                  62.3%
  Loss ratio*                      59.3% 59.5% 59.2%                                60.6% 62.0%                                                                           59.9%
                                                                                                                                                                                          61.5%
                           57.4%                                    55.3%                           Financial market       Lehman crisis
                                                                                                                                                                                                                  54.8%
                                                            54.7%
    52.8%52.8% 53.5%                                                                                           Financial market   Greek crisis

                                                                                                                            Industry       Second industry reorganization
                                                                                                                         reorganization    (MS&AD, NKSJ)

    39.5% 39.0% 39.2% 39.4% 38.6%
                                           37.6% 37.0%
                                                            34.5% 33.2%                                         35.1%35.0% 34.6% 33.8%
                                                                            32.6% 32.1%32.2% 33.2%                                               33.0% 32.3%32.2% 32.1%32.1% 32.6% 32.5% 32.6% 32.0%
  Expense ratio*
                                                                                                                          Law,                                                           Law,
                                                    Deregulation                                                                        Revision of reference loss cost rate for
                                                                                                                        institution                                                    institution
                                                                                                                                        voluntary automobile insurance in June 2009
                                         Establishment of the General Insurance                                                                                                          Revision of reference loss
                                                                                     Law,          Revision of the underwriting                       Law,         Revision of the
                                         Rating Organization of Japan                                                                                                                    cost rate for voluntary
                                                                                   institution     reserve system                                   institution    non-fleet discount/
   *Source of Loss ratio and Expense ratio: The General Insurance Association of Japan                                                                             loading rate system   Automobile Insurance
    Figures for FY2020 are as of end of September 2020.                                                                                                      in automobile         in May 2017

                                                                                                                                                                                                                     33
Ⅲ.   Growth Strategy by Business Domain

     1.Domestic Non-Life Insurance Business
     2.Domestic Life Insurance Business
     3.International Business
     4.Asset Management
2.Domestic Life Insurance Business
 (1) Current Status
                                                                                                                                      Maintaining the level at ¥1.0 trillion.
                                                                                             Annualized premiums
                                                                                                of new policies                      Although the top line declined due to factors
                                    Gross Premiums Income                                                                             including the impact of low worldwide interest
                                                                                                  117.4         110.8                 rates, a stable level of ¥1 trillion was maintained.
                                  MSI Aioi Life          MSI Primary Life                           91.1           81.4
                                                                                 (¥bn)                                               In FY2021, we expect gross premium income of
                                                                                                    26.2           29.4               ¥1.2 trillion, around the same level as the
                                              1,760.5                                                                                 previous year, based on the assumption of an
                                    1,495.8             1,550.0 1,508.11,599.9                      2020        2021
                                                                                                               Forecast
                                                                                 1,393.4                                              uncertain end to the COVID-19 and an ongoing
                          1,243.1                                                          1,297.3 1,200.0                            low interest rate environment.
                  870.7
                                              1299.4 1071.1
          619.5                     1054.0                  1015.6 1095.6 872.1             785.4                                            YoY change(FY2020)
  595.6                   826.4                                                                        700.0
                  449.3                                                                                             (Fiscal
          234.7                                                                                                      Year)     200%                    200%
  243.7                                                                           521.2     511.9                                          MSI Aioi life              MSI Primary Life
          326.2   421.3   416.7     441.8     461.1     478.9   492.5   504.2                          500.0
  242.8
  2020    2011    2012     2013      2014      2015      2016    2017    2018     2019       2020       2021
                                                                                                                               150%                         150%
                                                                                                      Forecast

                                                                                                                               100%                         100%
                                  Group Adjusted Profit*1,*2
                                                                                                                                  50%                           50%
                                  MSI Aioi Life         MSI Primary Life                                   (¥bn)
                                                                                           56.9                                       0%                        0%
                                                                                                                                           1Q 2Q 3Q 4Q                  1Q 2Q 3Q 4Q
                                                                                                     43.0                         (Annualized premiums of new
                                                                34.3    31.6                                                                                          (Premium income)
                                                                                                                                            policies)
                           24.4
                                    20.4
                                              25.0      25.1
                                                                                 29.7      43.1                                        Profit growth to ¥40.0 billion
                                                                                                      23.0                             For the bottom line, we achieved a structure
                  9.8
   4.1     4.3                                                          23.3     20.3                                                   that steadily generates around ¥40.0 billion
                                                                29.2                                                                    in revenue.
                           18.2     14.7      19.0      20.7
                  10.3                                                                                23.0
                                                                                 12.0      16.5
   9.3     7.7                                                          10.8
                   0.4     7.1       5.9       6.4       4.6    5.2                                                                    We expect a bottom line of ¥43.0 billion in
   -5.2    -2.4
   2010    2011   2012     2013      2014     2015      2016    2017    2018     2019      2020       2021
                                                                                                               (Fiscal                  FY2021.
                                                                                                                Year)
                                                                                                    Forecast

*1 Years 2010 to 2017 show Group Core Profit                                                                                                 ROR                               7.1%
*2 As the Group Adjusted Profit figures for the combined domestic life insurance                                              (Average of FY2018 to FY2020)
business (figures at the top of the graph) include purchase difference and other
adjustments, they do not match the simple sum of the values for each subsidiary.
                                                                                                                                                                                         35
2.Domestic Life Insurance Business
   (2) Growth Strategy
  In light of environmental factors including the coming era of people living to 100 years of age, low worldwide interest
   rates and demands for accountability toward policyholders, we will achieve sustained growth by developing needs-
   focused products, training highly specialized agents, and implementing ERM-based asset management.
                        MSI Aioi Life                                                 MSI Primary Life
   • Through detailed proposals attuned to customer lifestyles, the weight of                • Whole life insurance where life benefits can be used for inheritances
     insurance premiums associated with medical and life security-type                         (lifetime gifting products) continue to perform well.
                                                                                     (¥tn)                                                                               (¥tn)
     insurance will increase in the near term.                                                                                                                            8.0
(¥bn)                                                                                  2
                                                                             (¥tn)
                    Amount of policies in force (right axis)                                                Amount of policies in force (right axis)
  .
800                                                                          24                                                                                           7.0

                                                                                     1.5                                                                                  6.0
  .
600                                                                          18
                         Annualized premiums of new policies (left axis)                                                               Premium income (left axis)         5.0

                                                                                       1                                                                                  4.0
  .
400
                                                                             12
                                                                                                                                                                          3.0
                  Green bars denote amount of total                                                                    Green bars denote amount of total
                   made up of medical security and                                                                     made up of living gift-type products
                  lifetime benefit security products                                 0.5                                                                                  2.0
  .
200
                                                                             6
                                                                                                                                                                          1.0

 0.0                                                                                   0                                                               0.0
                                                               0
        2010 2011 2012 2013 2014 2015 2016 2017 2018 2019 2020 (Fiscal                       2010 2011 2012 2013 2014 2015 2016 2017 2018 2019 2020 (Fiscal
                                                                Year)                                                                                Year)
                                                                           Development of             Enhance and expand the product portfolio with a focus on consulting-
   Development of profits designed to solve social issues such as                                     type products that cater to increasingly diverse needs such as for
                                                                           needs-focused
   the increasing burden on nursing and medical care                                                  lifetime gifting, inheritance and asset formation
                                                                              products
                                                                                                      Combine face-to-face and remote interactions in well-balanced ways
   Promote improved sales capabilities through life and non-life       Training of highly-            and provide support for improving the consulting sales capabilities in
   cross-selling channels                                              specialized agents             the field at financial institutions
   - Reduce interest risks by extending asset duration                                                - Promote ALM operation to enhance management efficiency while
                                                                        ERM-based asset               diversifying risk
   - Improve investment returns by reviewing the portfolio of assets
                                                                          management                  - Strengthen risk management and monitoring through more
   expected to generate income
                                                                                                      sophisticated internal models
                                                                                                                                                                           36
2.Domestic Life Insurance Business
(3) MSI Aioi Life Growth Strategy
 Towards solving social issues such as the increasing burden of nursing and medical care, provide products and
  services that consider progress in medical technology including advanced medical care, as well as the handling of
  nursing care and dementia.
 Promote cross-selling utilizing the sales base of Japan’s largest non-life insurance group.

 Products and Services that Respond to Customer Needs              Sales Capabilities Though Various Sales Channels

 Risk of no longer being able to work                  While cross-selling channels (non-life insurance professional, corporate,
 &LIFE New Comprehensive Income Protection Wide         dealers, etc.) as the base of sales, build and expand various channels
 &LIFE Lifestyle Support Insurance                      (financial institutions, life insurance agents with a nationwide presence,
 Risk of Illness or Injury                             etc.) as business partners.
 &LIFE New Medical Insurance A Premier                                                         Cross-Selling Ratio*
 &LIFE Cancer Insurance Smart
 Preparing for Nursing Care                                                                                                                                18.5%
                                                                                                                                    17.6%
 &LIFE New Comprehensive Income
 Protection Wide                                                                                              15.4%
 &LIFE Lifestyle Support Insurance                                                        14.9%
                                                                  14.1%
 &LIFE New Medical Insurance A Premier
 Nursing Care Sukoyaka Desk-Nursing Care
 and Dementia Consultation Desk                                     2017                  2018                 2019                  2020                  2021 (Fiscal
                                                                                                                                                          Target Year)
                                                        * Number of MSA Life in-force policy holders in cross-selling channels (professional, corporate, automobile, dealers)
                                                          divided by the number of MS&AD automobile and fire insurance policy holders (From FY2020 onwards, the above
                                                          number of MSA Life in-force policy holders includes those that come under the transition of long-term policies in the
                                                          third sector)

                                                         Schemes to Solicit Business While Avoiding Face-to-
                                                        Face Contact to Respond to Increasingly Diverse Needs
                                                        - Convenience store sales                                June 2020

                                                        - Web meeting and mail-order kit                         July 2020

                                                        - Web meeting consultation & solicitation                March 2021
                                                                                   (easy mode)
                                                        - Fully online sales (medical insurance)                 FY2021 2H

                                                                                                                                                                                  37
2.Domestic Life Insurance Business
 (4) MSI Aioi Life(Amount of Policies and Annualized Premiums)
        Amount of Policies in Force and Annualized Premiums                                           Amount of New Policies and Annualized Premiums
                         of Policies in Force                                                                        of New Policies
New Frontier                                                                          New Frontier
   2013
                 Next Challenge 2017                 Vision 2021                         2013
                                                                                                            Next Challenge 2017                Vision 2021

       Annualized premiums of policies in force (¥bn)                                           Annualized premiums of new policies (¥bn)
       Annualized premiums of policies in force for third sector insurance (¥bn)                Annualized premiums of new policies for third sector insurance (¥bn)
       Amount of policies in force (¥tn)                                                        Amount of new policies (¥tn)
                                            24.5     24.4    24.2     24.3
                                    23.8
                           23.2
                   22.5
          21.8                                                                                                                      3.1     Impact of suspension
21.1                                                                                                                                        of sales of products for
                                                    448.1 447.9 446.2
                                            431.5                                                                                           corporate customers
                                   412.3                                                2.6                                  2.6
                           401.0
                  375.7                                                                              2.4      2.4
                                                                                                                     2.3
         353.4
333.5
                                                                                                                     51.7           51.1      2.0
                                                                                                                                                               1.9
                                                                                                              48.1
                                                                                                     46.2                                            1.7
                                                                                       42.2
                                                                                                                            38.8

                                                                                                                                             29.3             29.4
                                                                                                                                                     26.2
                                                                154.0
                                                    138.1 146.0
                                            107.8                                                                                           19.2
                           88.4     96.7                                                                                            17.7                      16.2
                   78.7                                                                              14.4            15.2   13.9                     14.6
          70.5                                                                                                13.5
61.1                                                                                   10.9

2013      2014     2015     2016     2017    2018    2019     2020    2021 (Fiscal     2013          2014     2015   2016   2017    2018    2019     2020     2021 (Fiscal
                                                                     Forecast Year)                                                                          Forecast Year)

                                                                                                                                                                       38
2. Domestic Life Insurance Business
(5) MSI Primary Life Growth Strategy
 Respond quickly and flexibly to environmental changes to develop and provide highly unique products that cater to the diverse needs of
  customers.
 Improve the sales capabilities of financial institution agents and enhance the management structure and quality of selling insurance by
  providing sales and training support to agents through a combination of face-to-face and remote instruction, and through stronger after-
  sales follow-ups.
                                                                               Improving Sales Capabilities and the Management
                  Product Lineup That Caters to
                                                                               Structure and Quality of Insurance Sales Through
                    Diverse Customer Needs
                                                                                      Detailed Agency and Agent Support
    Asset inheritance needs                                               Implementing hybrid-type sales that combine face-to-face sales
     With Yasashisa-Tsunagu 2, an “Anniversary Function” allowing           and group-format education and training with remote activities
     life benefits to be received on an appointed day was added to
     lifetime gifting, which allows assets to pass smoothly to family.     Enhanced digital content supporting remote sale
                                                                            - New establishment of a video streaming studio equipped with
    Asset utilization needs
     Ashita-no-Yorokobi 2 offers a tontine pension to prepare for             the latest equipment
     longevity risk                                                         - Streaming of video content enabling agents to engage in self-
                                                                              learning remotely
    Asset formation needs
     Shiawase-Zutto 2 is a whole life insurance product to                 Enhanced after-sales follow-ups on policyholders in coordination
     accumulate assets in foreign currency                                  with agents
     Ashita-mo-Jujitsu is a level-payment tontine pension that can be       - Support for establishing and strengthening after-sales follow-
     used for asset building by a wide range of age groups                    ups at agents
    Death benefit needs                                                    - Enhanced data linking of policyholder information with agents
     Ohkina-Magokoro features death benefits that increase from one
     year after policy establishment and can also be used to prepare     ◆ Video streaming studio:         ◆ Agent training conducted
     for nursing care                                                      PRIMARY CREATIVE STUDIO           remotely

                                                                                                                                               39
2.Domestic Life Insurance Business
 (6) MSI Primary Life (Premium Income, Amount of Policies in Force and Net Income)
   Amount of Policies in Force and Premium Income                                                                               Net Income
New Frontier
                 Next Challenge 2017                            Vision                        New Frontier
                                                                                                               Next Challenge 2017                         Vision
   2013                                                          2021                            2013                                                       2021
                                                                                                                                                                            (¥bn)
                          Policies in force (¥tn)          Premium income (¥bn)
                  1,299.4
                                                                      FY2020 Premium Income                                      FY2020 Net Income/Losses
                                                                      - In the second half of the year there was a V-
                                                                      shaped recovery with a 125% year-on-year                   - We added ¥100.5 billion to
                                                                      increase.                                                  price fluctuation reserves to    43.1
                                             1,095.6                  - Cumulatively for FY2020, we achieved the                 ensure financial soundness.
  1,054.0                      1,071.1                                top share in the industry for over-the-counter
                                     1,015.6                          bank sales of one-time payment insurance for
                                                                      the second consecutive year (based on MSP
                                                             872.1    research).

826.4
                                                                                                                                      29.2
                                                                             700.0
                                                                     785.4
                                                                                                                                               23.3                       23.0
                                                                                                                               20.7                     20.3
                                                                                                17.9                    17.8
                                                    6.6      6.5     6.5       6.4
                                          6.0
                               5.6
                    4.9                                                                                    12.4
           4.4                                                                                                                        Over ¥20 billion for five
 4.0                                                                                                                                    consecutive years

 2013     2014     2015       2016      2017        2018     2019    2020    2021 (Fiscal       2013      2014          2015   2016   2017     2018     2019      2020    2021 (Fiscal
                                                                                     Year)                                                                                       Year)
                                                                            Forecast                                                                                     Forecast

                                                                                                                                                                                    40
2.Domestic Life Insurance Business
 (7) Embedded Value (EEV) from the End of FY2013 to the End of FY2020
                                 MSI Aioi Life                                                  (¥bn)                                   MSI Primary Life                                                   (¥bn)
          Net worth     Value of in-force business                                    1,065.3                          Net worth    Value of in-force business                                        557.4
                                                                              958.3
                                                                890.2                                                                                            416.2       436.1                    157.1
                                           835.5      819.4
                                 794.2                                                                                                              375.3
                                                                                                                                       333.8                                                348.4
           647.8                                                                        644.0                             310.2                                              141.8
 588.1                595.8                           304.0     384.0         537.0                                                                              132.1
                                 353.7     389.2
                                                                                 UFR                                                                122.3                                   54.9
                                                                                                             234.8         72.7         88.2
                      188.5                                                     applied
           379.4
 393.1                                                                                  4                                                                                                             400.2
                                                                                                             102.2
                                                                                        2                                                                        284.1       294.3          293.4
                                 440.4     446.3      515.4     506.1                   1                                 237.4        245.5        252.9
                      407.2                                                   421.2
 195.0     268.4                                                                        .                    132.6
                                                                                        2
                                                                                       UFR
                                                                                                 (End of                                                                             *1          *1         *1 (End of
  2013      2014      2015       2016      2017       2018       2019         2020                Fiscal      2013         2014        2015         2016         2017         2018          2019      2020     Fiscal
                                                                                      applied     Year)      *1 From FY 2018, unrealized gains/losses on securities related to insurance contracts are         Year)
                                                                  EEV Sensitivity                              included in the value of in-force business rather than net worth. EEV Sensitivity
   Changes in FY2020 (¥bn)                                    (at March 31, 2021, ¥bn)                         Changes in FY2020 (¥bn)                                    (at March 31, 2021, ¥bn)
               Factor                   Change                 Assumptions                      Change                     Factor                  Change                 Assumptions            Change
 Opening adjustments                        -4.9 Risk-free yield curve               Up 50bp         3.8    Opening adjustments                        -6.2      Reference yield curve   Up 50bp -14.1
 New business in reporting year             44.7 Risk-free yield curve          Down 50bp          -28.8    New business in reporting year *2         -10.8      Reference yield curve Down 50bp   15.1
 Expected existing business                          Equity and real estate                                 Expected existing business                           Equity and real estate
                                             5.9 values                          Down 10%            -3.1                                                2.1     values
                                                                                                                                                                                               Down 10%    -3.7
 contribution at the risk free rate                                                                         contribution at the reference rate
                                                     Maintenance expenses        Down 10%           29.9    Expected existing business                           Maintenance expenses          Down 10%    7.7
 Expected existing business                                                                                 contribution above reference rate
                                                                                                                                                         2.3
                                             4.4 Surrender and lapse                                                                                             Surrender and lapse
 contribution above risk free rate                   rates
                                                                                 Down 10%          -16.3                                                         rates
                                                                                                                                                                                               Down 10%    -2.2
                                                     Mortality and morbidity                                Operating experience variances               0.9
 Operating experience variances             -0.4                                  Down 5%           55.1                                                         Mortality and morbidity
                                                                                                                                                                                               Down 5%     1.0
                                                     rates for life insurance                                                                                    rates for life insurance
 Changes in operating                                Mortality and morbidity                                Changes in operating assumptions            -5.7
                                           -39.1     rates for annuity
                                                                                  Down 5%            -0.1
 assumptions                                                                                                Economic variances and changes to                    Mortality and morbidity
                                                     Equity and property                                                                              226.3      rates for annuity
                                                                                                                                                                                               Down 5%     -0.9
 Economic variances and                                                             Up 25%            0.0   economic assumptions
                                                     implied volatility
 changes to economic                        53.0     Swaption implied                                       Total                                     208.9      Equity and property
 assumptions                                                                        Up 25%         -20.7                                                         implied volatility
                                                                                                                                                                                                 Up 25%    -2.1
                                                     volatility
                                                     Required capital set at statutory                      *2 In the EEV calculation, the value of new
 Other operating movements                   4.4                                                      4.8     business reflects only a portion of the excess
                                                                                                                                                                 Swaption implied volatility     Up 25%    -2.4
                                                     minimum level
                                                                                                              spread above the risk-free rate. The substantial   Required capital set at statutory
 Total                                      68.1     Applying an Ultimate Forward Rate
                                                                                                              value of new business, taking into account the     minimum level
                                                                                                                                                                                                           2.2
                                                     (UFR) to extrapolate long term               107.0       excluded spread, is positive.
                                                     interest rates                                                                                              Nil illiquidity premium                  -13.9

                                                                                                                                                                                                               41
Ⅲ.   Growth Strategy by Business Domain

     1.Domestic Non-Life Insurance Business
     2.Domestic Life Insurance Business
     3.International Business
     4.Asset Management
3. International Business: (1) Current Status
                                                                                                                                   Profit expansion phase from FY2021
                                        Net Premiums               Written*1                                               Over the past ten years, the top line has been significantly
                                                    MS Amlin                  Lower premiums due to COVID-19                expanded through major acquisitions including MS Amlin and
     (¥bn)                                          acquisition              and stricter underwriting at MS Amlin          MSFC.
                                                                                                             968.0
                                                                        892.7 938.8 938.8
                                                              818.7                                 831.1                  In 2020, due to the impact of COVID-19 and stricter underwriting
                                                                                                                            at MS Amlin to focus on profitability, net premiums written
                                                                                                                            declined compared with the previous year.
                                              461.6                              MSFC
                                  369.0 415.9                                  acquisition
      264.3 262.2 287.8                                                                                                    In 2021, Group Adjusted Profit is expected to be ¥80.0 billion, an
                                                                                                                            ¥87.1 billion increase over the previous year, primarily due to the
                                                                                                                            elimination of special factors due to COVID-19 and increased
                                                                                                                            premiums from the international life insurance business.
       2010 2011 2012 2013 2014 2015 2016 2017 2018 2019 2020 2021 (Fiscal
                                                                                                                             Major Factors of Earnings Increase from FY2020 to
                                                              Plan Year)                                                                                                                          Estimated Increase (¥bn.)
                                                                                                                                                  FY2021

                                                                                                                                              - Measures to improve profitability at MS
                                                                                                                          MS Amlin            Amlin
                                        Group Adjusted                Profit*1                                                                - Capturing of market hardening
                                                                                                                                              - Asian retail market development
                                                     Highest ever insurance loss                                                              - Specialty market development (incl.
                                                                                                                                                                                                 +14.0
     (¥bn)                                             due to natural disasters
                                                                                                 COVID-19                 Asia, Europe        MGA)
                                                          occurring for two                                               and Americas
                                                         consecutive years                                     80.0
                                                                                                                                              - Impact of losses from North American                            +30.0
                                                                                                                                              cold wave
            Thai floods                                                                                                                       - Recovery of Challenger business
                                                                                             49.4
                                            38.2                                                                                                performance
                                                               34.6                                                       International
                                                      27.9                                                                Life Insurance
                                                                                                                                              - Dividend increase from Phoenix                   +16.0
                          13.5 18.0                                                                                                           - Making BoComm Life an equity-method
        1.8                                                                        5.4                                                          affiliate, etc.

                                                                                                                          Special             Recovery from negative factors such as
                                                                                                     -7.1                 Factors             COVID-19 impact                                          +57.0*2
               -112.3
                                         -125.0
      2010 2011 2012 2013 2014 2015 2016 2017 2018 2019 2020 2021 (Fiscal                                                    *2 Before tax: ¥62.3 billion (overseas subsidiaries ¥43.8 billion, others ¥18.5 billion)
                                                             Plan year)                                                      of COVID-19-related incurred losses in international business out of total ¥65.8 billion.
*1International Business: Business results of overseas consolidated subsidiaries and equity-method affiliates plus
  the business results of overseas branches of non-life insurance companies, overseas non-consolidated                                            ROR                                             2.9%
  subsidiaries, and non-life insurance companies’ head office inward reinsurance. Figures for FY2017 and beyond                                                                  (6.0% excl. impact of COVID-19)
  include Head Office Reinsurance Business. FY2010-FY2017: Group Core Profit).
                                                                                                                                (Average from FY2018 to FY2020)

                                                                                                                                                                                                                         43
You can also read