FOF OPTIMIZATION STATE-OF-THE-ART ANALYSIS - VERSION 3.8.0 - DATE: 08.3.2021 - CYBERFACTORY#1
←
→
Page content transcription
If your browser does not render page correctly, please read the page content below
FoF Optimization
State-of-the-Art Analysis – version 3.8.0

Date: 08.3.2021

 Page 1 of 89
Contents
Glossary ................................................................................................................................................. 4
1. Executive Summary ...................................................................................................................... 7
2. Introduction .................................................................................................................................... 8
 2.1. Purpose and Scope of this Document ..................................................................................... 9
 2.2. Deliverable Structure ............................................................................................................. 10
3. Real time asset sensing and tracking ....................................................................................... 11
 3.1. Real Time Location Systems (RTLS) .................................................................................... 11
 3.1.1. Components of a Real Time Asset Tracking System .................................................... 12
 3.1.2. Positioning Technologies............................................................................................... 15
 3.1.3. Data Collection .............................................................................................................. 20
 3.2. Industrial IoT Platforms.......................................................................................................... 25
 3.3. Conclusions and Limitations .................................................................................................. 29
4. Data lake exploitation .................................................................................................................. 32
 4.1. Data Lake Technologies ........................................................................................................ 33
 4.2. Data Lake Use Cases............................................................................................................ 34
 4.3. Big Data Technologies .......................................................................................................... 35
 4.4. Proprietary Platforms ............................................................................................................. 36
 4.5. Intelligent Techniques............................................................................................................ 37
 4.6. Concepts and techniques for machine learning and prediction of production dynamics ...... 38
 4.6.1. Mathematical and statistical modeling ........................................................................... 39
 4.6.2. Online Learning ............................................................................................................. 47
 4.6.3. Statistical Model of Time Patterns ................................................................................. 51
 4.6.4. Tools and Platforms for Machine Learning in Industry .................................................. 52
 4.7. Machine learning applied to Industry 4.0 ............................................................................... 53
 4.8. Conclusions and Limitations .................................................................................................. 58
5. H/M collaboration and optimization ........................................................................................... 59
 5.1. Learning by demonstration .................................................................................................... 59
 5.2. Definition ................................................................................................................................ 60
 5.3. Approaches............................................................................................................................ 61
 5.4. Current methods .................................................................................................................... 63
 5.4.1. Low level learning of individual motions ........................................................................ 63
 5.4.2. Teaching Force-Control Tasks ...................................................................................... 63
 5.4.3. Learning high-level action composition ......................................................................... 63
 5.5. Motion planning approaches ................................................................................................. 64
 5.5.1. Gaussian Mixture Model ................................................................................................ 64
 5.5.2. Dynamic Movement Primitives ...................................................................................... 64
 5.7. Limitations of current approaches and solutions ................................................................... 66
6. Distributed Manufacturing .......................................................................................................... 67

CyberFactory#1 | www.cyberfactory-1.org
State-of-the-Art on FoF Optimization
Date 03.03.2021

 6.1. Production Scheduling ........................................................................................................... 69
 6.1.1. Key concepts in scheduling ........................................................................................... 70
 6.1.2. Approaches.................................................................................................................... 72
 6.2. Distributed Production Scheduling ........................................................................................ 75
 6.2.1. Definition ........................................................................................................................ 76
 6.2.2. Approaches.................................................................................................................... 79
 6.2.3. Testing data integrity ..................................................................................................... 80
 6.3. Market Solutions .................................................................................................................... 81
 6.4. Safety assurance for adaptive SoS ....................................................................................... 82
 6.4.1. Definition ........................................................................................................................ 82
 6.4.2. Approaches.................................................................................................................... 83
 6.4.3. Limitation of current approaches ................................................................................... 84
 6.5. Limitations of Current Approaches and Solutions ................................................................. 85
7. Conclusions ................................................................................................................................. 88

CyberFactory#1 | www.cyberfactory-1.org 3
State-of-the-Art on FoF Optimization
Date 03.03.2021

 Glossary

 AI Artificial Intelligence

 AS Anomaly Score

 AIDC Automatic Identification and Data Capture

 AIDC Automatic Identification and Data Capture

 AMQP Advanced Message Queuing Protocol

 AOA Angle of Arrival

 BLE Bluetooth Low Energy

 CLARA Clustering LARge Applications

 CPS Cyber-Physical Systems

 CNN Convolutional Neural Net

 CAT-M1 Category M1

 CPS Cyber-Physical Systems

 CRM Customer Relations Management

 DIPC Data Integration Platform Cloud

 DSC Dynamic Safety Case

 DM Distributed Manufacturing

 DMP Dynamic Movement Primitive

 EAM Enterprise Asset Management

 EM Expectation-Maximization

 ERP Enterprise Resource Planning

 ETL Extract-Transformation-Load

 GATT Generic Attribute

 GSN Goal Structuring Notation

CyberFactory#1 | www.cyberfactory-1.org 4

State-of-the-Art on FoF Optimization
Date 03.03.2021

 GMM Gaussian Mixture Model

 GPS Global Positioning System

 HF High Frequency

 IIOT Industrial Internet of Things

 IOT Internet of Things

 JSON Java Script Object Notation

 K-S test Kolmogorov-Smirnov test

 LbD Learning by Demonstration

 LF Low Frequency

 LoRaWan Long Range Wide Area Network

 LoS Line of Sight

 LPWAN Low Power Wide Area Network

 LTE Long Term Evolution

 MDP Markov Decision Process

 M2M Machine to Machine

 MSC Modular Safety Case

 ML Machine learning

 MQTT Message Queuing Telemetry Transport

 MTU Maximum Transmission Unit

 NB-IOT Narrow Band Internet of Things

 OPC-UA Open Platform Communications – Unified Architecture

 PubSub Publish-Subscribe

 PAM Partitioning Around Medoids

 RATS Real-time Asset Tracking System

CyberFactory#1 | www.cyberfactory-1.org 5
State-of-the-Art on FoF Optimization
Date 03.03.2021

 RTLS Real Time Location System

 RNN Recurrent Neural Network

 RFID Radio Frequency Identification

 RSSI Received Signal Strength Indicator

 RTLS Real Time Location System

 RTT Round Trip Time

 SCADA Supervisory Control and Data Acquisition

 Sub-GHz Sub GigaHertz

 SVM Support vector machine

 TDOA Time Distance of Arrival

 TOA Time of Arrival

 TOF Time of Flight

 TSI Time Series Insights

 TWR Two Way Ranging

 UHF Ultra High Frequency

 UWB Ultra Wide Band

 WPS Wifi Positioning System

 XAI Explainable Artificial Intelligence

 6LoWPAN IPv6 over Low power Wireless Personal Area Networks

CyberFactory#1 | www.cyberfactory-1.org 6
State-of-the-Art on FoF Optimization
Date 03.03.2021

1. Executive Summary
CyberFactory#1 aims at designing, developing, integrating and demonstrating a set of key enabling
capabilities to foster optimization and resilience of the Factories of the Future (FoF). It will address
the needs of pilots from Transportation, Automotive, Electronics and Machine manufacturing
industries around use cases such as collaborative product design, autonomous machine
reconfiguration, continuous product improvement, distributed manufacturing and real time
situational awareness. It will also propose preventive and reactive capabilities to address cyber and
physical threats and safety concerns to FoF.
In comparison with other Industry 4.0 related projects, the differentiating factors of our approach
are threefold. First, the system considered is not a simple manufacturing asset, nor a sum of isolated
assets, but a network of factories, which is considered in a System of Systems (SoS) approach.
The challenge is to propose novel architectures, technologies and methodologies to optimize the
level of efficiency and security of this SoS in a context where every step towards digitization exposes
the manufacturing process to widening cyber-threats. Finally yet importantly, we intend to solve
more than the technological challenges of Industry 4.0 in this project. Many studies have shown
that demonstrating technical feasibility would not be enough to get the buy-in from workers,
managers, entrepreneurs, decision makers and customers about novel manufacturing approaches.
CyberFactory#1 will therefore embrace technical, economic, human and societal dimensions at
once.
A first step is to deliver realistic digital models of FoF and their ecosystem, enabling to perform
simulation-aided design, testing and validation of optimization and resilience components. A second
output will be the development of key technology bricks for optimization of the manufacturing cycle,
enabling real-time sensing and tracking of materials, humans and machines on the shop floor,
optimization of human / machine collaboration, distributed manufacturing scenarios, data lake
exploitation for process improvement and data-centric business creation. A third output will be to
address the need for enhanced resilience of FoF, starting with human / machine access & trust
management, human / machine behavior watch, robust machine learning and self-healing
mechanisms. The key capabilities will be demonstrated in realistic environments, reflecting the
variety of possible new factory types like user-centric plant or learning factories and taking into
account business model shifts like turning products into services or developing data services on top
of manufacturing activities.

CyberFactory#1 | www.cyberfactory-1.org 7
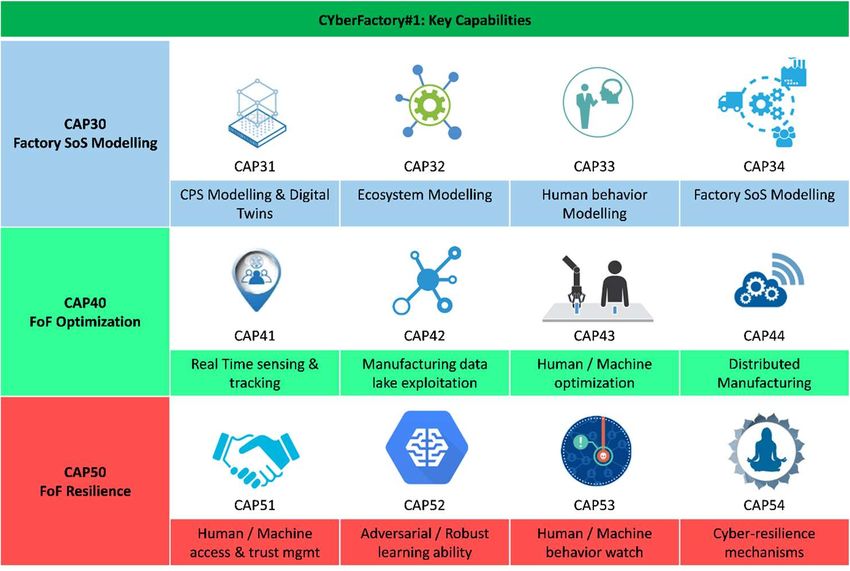
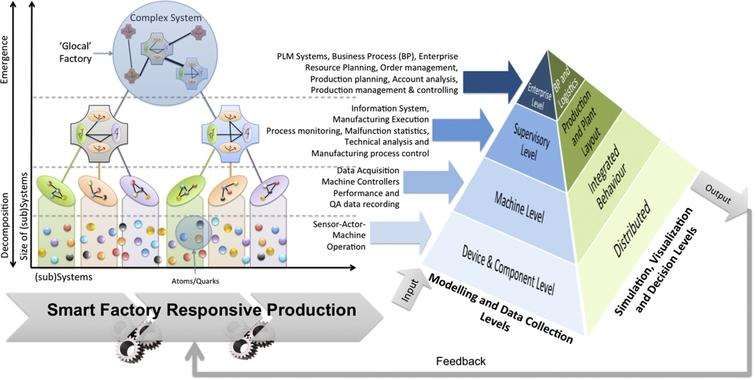
State-of-the-Art on FoF Optimization
Date 03.03.2021

2. Introduction
The system developed under CyberFactory#1 project largely fall into the category of SoS, which
have special characteristics that impose several challenges on the architecture design of the
solution. Initially the architecture modeling focused strongly on the business and operational level
while newer approaches tried to include also architectural aspects of the involved systems. 1990’s
PERA (Purdue Enterprise Reference Architecture1) is an example of the first category, which aims
at computer-integrated manufacturing. Architectures that are more recent have been created within
Industry 4.0 initiative, with the models proposed by Platform Industry 4.0 2 and Industrial Internet
Consortium (IIC), two of the largest organizations that research on topics related to industry and
Industrial Internet, respectively, the most mentioned. Other prominent architectures are also ENISA
Purdue Model, IBM Industry 4.0 and NIST Service-Oriented Architecture. These several reference
models support the definition of CyberFactory#1 system architecture, defined in this document.
The CyberFactory #1 project will result in the validation of all 12 key capabilities listed in Figure 1
through testing and demonstration on a mix of real and simulated factory environments.

 Figure 1 - Overview on key capabilities.

Each capability contributes to one of the 3 main Project outputs:
 - Modeling and simulation of Factory System of Systems: a set of modular capabilities
 enabling to virtually replicate a factory, including machines, humans and its vital environment
 (supply chain, customers) to support decision making for process optimization and resilience.
 - Factory of the Future Optimization: a set of modular capabilities enabling to optimize
 manufacturing and supply chain processes and develop data-centric business models
 generating new revenue streams, starting with improved management of factory shop floor
 through the use of the Industrial Internet of Things (IIoT), enhanced optimization of human and

1 The Purdue enterprise reference architecture. Williams, Theodore J. 1994, Computers in
Industry.
2 Plattform Industrie 4.0. Plattform Industrie 4.0. https://www.plattform-
i40.de/PI40/Navigation/EN/Home. [Accessed at March 13, 2020.]

CyberFactory#1 | www.cyberfactory-1.org 8
State-of-the-Art on FoF Optimization Date 03.03.2021 robot collaboration, manufacturing load balancing techniques and data lake exploitation techniques. - Factory of the Future Resilience: a set of modular capabilities enabling to enhance resilience of future factories, in particular by implementing permanent trust management techniques for physical and logical access control of critical assets, innovative techniques for anomaly / attack detection based on behavior analysis, offensive and defensive techniques for manipulation of artificial intelligence, and system self-healing mechanisms to ensure business continuity and recovery. 2.1. Purpose and Scope of this Document Nowadays, sensors are getter cheaper and more efficient; these are often embedded in machines and devices, from a simple smartphone to a wristband. The amount of data generated every single day worldwide is astonishing; by 2025, approximately 463 exabytes of data will be created3. At the same time, communication speed as well as increased protocols make connectivity cheaper and more reliable, where cloud technology and mobile devices provide information any time and any place. Such large and fast volumes of data and the need to extract knowledge close-to-real-time from them are industrial challenges that must be addressed. Furthermore, the joint usage of manufacturing control and data lake analytics through the industrial internet will produce huge opportunities in all manufacturing areas. As are new devices becoming more intelligent and interconnected, the integration of these in a production line, will offer a new set of possibilities, such as: better scheduling and maintenance strategies, a better quality prediction (zero-defect manufacturing), more reliable safety management and mechanisms, and any kind of operation requiring some “step by step” process (installation, assembly, etc.) can be improved. Yet a number of limitations of state-of-the-art technologies restrain the potential for factory optimization and self- improvement. The goal of this document is to first present state-of-art solutions for several constraints or limitations that exist nowadays on the transportation, automotive, electronics and manufacturing industries. Secondly, identify limitations on the current technologies or approaches and highlight how CyberFactory#1 will contribute with new solutions and approaches that might mitigate or eliminate them. Some of the topics discussed (but not limited) are: Real time situational awareness, asset location and tracking. The state-of-the-art indoor location technologies for LPWAN consist in having a tag listening to signals emitted by a nearby Bluetooth Low Energy (BLE) beacon, report the ID and the received power strength of the beacon to a location platform. Manufacturing data lake analytics and services. The data generated by real time situational awareness, asset location and tracking systems are going to populate a data lake, a large storage repository that holds a vast amount of raw data in its native format, without any connection, until it is needed. The goal now is to retrieve knowledge and patterns from these huge amounts of data, as the competitiveness and capacity for innovation depends on a company ability to manage and use knowledge. Using machine learning techniques, and large volumes of data with high quality and purity, several services such as anomaly 3 “How Much Data Do We Create Every Day? The Mind-Blowing Stats Everyone Should Read”https://www.forbes.com/sites/bernardmarr/2018/05/21/how-much-data-do-we-create-every- day-the-mind-blowing-stats-everyone-should-read/?sh=2034383660ba [Accessed at February 23, 2021], Forbes. CyberFactory#1 | www.cyberfactory-1.org 9
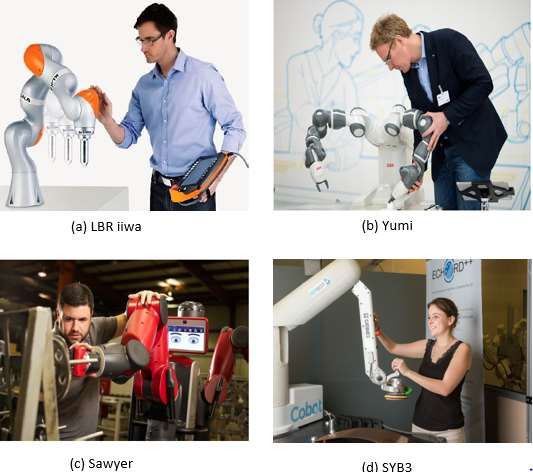
State-of-the-Art on FoF Optimization Date 03.03.2021 detection (measuring deviations from the normal behavior), condition monitoring in continuous processes, and other systems optimizations 4 5 6 have been proposed. A more collaborative human-machine interaction, where skills between humans and machines are shared. The current state of the art requires a robotic expert or a trained worker to program these cobots using teach-pendants. In the Factories of the Future (FoF), the collaborating worker should more intuitively program the cobots that they will be interacting with, based on their own preferences and experience to increase productivity and efficiency. Collaborative product design and distributed manufacturing. In the FoF, the manufacturing process is based on a network of geographically distributed, but connected, factories, suppliers, distributors, and end consumers. While digitalization and interlinkage of distributed manufacturing systems provide the basis to implement the FoF, these are heavily dependent and supported by machine learning algorithms, data lake or big data infrastructure and collaborative decision making techniques (highly dependent on a productive human-machine interaction), IoT and IioT platforms (highly dependent on cloud services) and asset location and tracking systems. The CyberFactory#1 challenge is to propose novel architectures, technologies and methodologies to optimize the level of efficiency and security of this FoF in a context where every step towards digitization exposes the manufacturing process to widening cyber-threats. Using the abroad experience and knowledge of both industrial and academic partners, synergies are going to be created and established through regular meetings, where experiences are going to be shared. In the process business, opportunities are going to be identified, from the different and cross-domains. 2.2. Deliverable Structure The document is divided into five main sections: - Section 3 is dedicated to the analysis of current technologies and applications concerning the real-time and near real-time sensing, tracking & supervision of materials and assets, both inside and outside of the factory. - Section 4 presents data lake and big data technologies applied to FoF. Furthermore, state- of-art artificial intelligence algorithms and their applications to Industry 4.0 are presented and studied. - Section 5 presents learning by demonstration state-of-art algorithms, mainly the limitation of the Dynamic Motion Primitives approaches and the propose solutions. - Section 6 focus on methodologies aiming to support the management of work-in-progress and manufacturing loads on the shop-floor, through a network of factories. - Conclusions presents the limitations of the current factory architecture, and the novelty and contributions made in CyberFactory#1 project. 4 Lee, Jay, Behrad Bagheri, and Hung-An Kao. "A cyber-physical systems architecture for industry 4.0-based manufacturing systems." Manufacturing Letters 3 (2015): 18-23. 5 Maier, Alexander, Sebastian Schriegel, and Oliver Niggemann. "Big Data and Machine Learning for the Smart Factory—Solutions for Condition Monitoring, Diagnosis and Optimization." Industrial Internet of Things. Springer International Publishing, 2017. 473-485. 6 Lee, Jay, Hung-An Kao, and Shanhu Yang. "Service innovation and smart analytics for industry 4.0 and big data environment." Procedia Cirp 16 (2014): 3-8. CyberFactory#1 | www.cyberfactory-1.org 10
State-of-the-Art on FoF Optimization
Date 03.03.2021

3. Real time asset sensing and tracking
The number of data sources on the shop floor has dramatically increased thanks to the fourth
industrial revolution. Due to successive advancements, developments and innovations in sensor
and networking technologies, their increased availability, affordability and the spread of industrial
internet have made it possible to have real time/ near real time visibility into the shop floor assets
and field operations. Digitized production processes offer controllability and traceability, in contrast
to the traditional sub-processes, which are executed through human interactions7. The importance
of digitization in production is well known and there is no sector in industry that has not recognized
it yet. Broadly speaking, digitization here means being able to gather all relevant data about
manufacturing processes / assets and use them to increase efficiency, productivity and control over
them. According to 2018 Manufacturing Vision Study8, manufacturers have already realized the real
benefits of data connectivity: increased visibility into the entire manufacturing process; an
accelerated pace in shipping and receiving; faster identification of points-of-failure; and deeper
insights into the interworking of their operations. This study shows that the amount of data being
captured but not connected to any system or staff to reduce from 21% to 11% through 2017 to 2022.
In a connected plant floor, every physical asset has a digital profile. Manufacturers use these
profiles to track real-time location, material allocation and condition of assets. The data can also be
used to improve the overall manufacturing process, eliminate bottlenecks, communicate with
suppliers and ensure quality. Although only 24% of those surveyed currently have technology-driven
tracking capabilities in place, it’s something manufacturers know they need. In five years, 63% of
those surveyed plan to increase their tracking with more than 28% planning to adopt real-time
monitoring 9. In CyberFactory #1 project, CAP41 focuses on real time or near real time data
collection from shop floor in the factories of the future. The data might be the position of a moving
robot, presence of pallet inside a factory, materials in the process or operating machines in
production lines. The operating machines are usually equipped with sensors to produce (a big
amount of) data as basis for the use of analytical techniques and methods. Since a lot of
applications in this area generate benefits by processing data from multiple machines and other
sources together, it is first necessary to transfer the data over a network to a server to be able to
apply analytical algorithms.
In this document, the state-of-the-art for RT or near-RT tracking technologies are examined in two
chapters. The first one is real time location systems (RTLS) which locates anything such as
manufacturing assets, people, products and anything that carries a RTLS tag on it inside a
predetermined area. The second one is the industrial IoT platforms, which provides connectivity to
shop floor and provides many additional features to users for facilitating production.

3.1. Real Time Location Systems (RTLS)
Real Time Locating Systems (RTLS) are wireless systems with the ability to locate the position of
an item anywhere in a defined space (local/campus, wide area/regional, global) at a point in time
that is, or is close to, real time. Position is derived by measurements of the physical properties of

7 Kerem Kayabay and others, ‘Big Data for Industry 4.0: A Conceptual Framework’, in 2016
International Conference on Computational Science and Computational Intelligence, 2016, pp.
431–34.
8 “2018 Manufacturing Vision Study… The Road Ahead.” [Online]. Available:
https://cssi.com/2018/04/20/2018-manufacturing-vision-study-the-road-ahead/. [Accessed at May
27, 2020].
9 ‘2018 Manufacturing Vision Study… The Road Ahead’ [Accessed at May 27, 2020].‘2018 Manufacturing
Vision Study. ‘

CyberFactory#1 | www.cyberfactory-1.org 11
State-of-the-Art on FoF Optimization Date 03.03.2021 the radio link 10. With the usage of RTLS systems in industry, companies can minimize production slowdowns, identify areas to improve, and provide workers with added safety features by tracking manufacturing assets and workers movement in real-time 10. 3.1.1. Components of a Real Time Asset Tracking System Figure 2 - Components of an Figure RTLS1 system (extracted from16). Every RTLS system incorporates a combination of hardware and software to create an enclosed positioning network. The infrastructure mainly consists of four main elements as shown in Figure 1. Tag / Beacon: Small element, which needs to be attached to the target that is being tracked. They are miniature devices that are enabled with location technology. Depending on the tag’s communication method with other parts of the RTLS, they are categorized as passive, semipassive or active. Passive tags are typically passive radio frequency identification (RFID) tags. The reader (interrogator) sends a radio signal that is received by the passive tags present in the RF field of the interrogator. Tags receive the signal via their antennas and then respond by transmitting their stored data. Passive RFID tags have no battery and obtain the operational power to transmit data from the RF field emitted by a corresponding interrogator11. Semipassive tags (or battery assisted passive tags) are very similar to passive tags. They do not initiate any communication, need to be in the RF field of the interrogator to be read, and send data to the interrogator using the same backscatter technique as passive tags. 10 2014 International Organization for Standardization, ‘ISO/IEC 24730-1:2014 Information Technology — Real-Time Locating Systems (RTLS) — Part 1: Application Programming Interface (API)’, 2014.2014 International Organization for Standardization, ‘ISO/IEC 24730-1:2014 Information Technology — Real-Time Locating Systems (RTLS) — Part 1: Application Programming Interface (API)’, 2014.2014 International Organization for Standardization, ‘ISO/IEC 24730-1:2014 Information Technology — Real-Time Locating Systems (RTLS) — Part 1: Application . 11 Rahul Bhattacharyya and Pavel Nikitin, ‘Guest Editorial: Special Issue on IEEE RFID 2019 Conference’, IEEE Journal of Radio Frequency Identification, 4.1 (2020), 1–2 . CyberFactory#1 | www.cyberfactory-1.org 12
State-of-the-Art on FoF Optimization Date 03.03.2021 However, semipassive tags have a small battery12. The battery’s main purpose is to either monitor environmental conditions or to offer greater range and reliability than passive tags. Note that the battery on semipassive tags is not used to generate RF energy. Active tags contain an onboard radio (transmitter or transceiver) and are typically powered by an internal battery13. Because they have onboard radio, they usually have a long range and can communicate without being prompted. For these reasons, these tags can be located in real time, say every second or any frequency needed by the application. However, the battery life becomes an important concern with increasing communication. Beacons are small always-on transmitters, which can use Wi-Fi, Bluetooth Low Energy (BLE), SubGHz NB-IoT, or other technology to broadcast signals to nearby portable devices, mainly BLE. They can be considered as a light house which repeatedly transmits a single signal that other devices can see 14. The beacon sensors usually transmit data, but do not receive them. A device like a smartphone can see a beacon once it is in the device’s range, and do what it is programmed to do when it sees the beacon. Antenna / anchor: They are devices within an RTLS that typically have a known position and detect the location of tags. Location sensors locate tags by using a physical parameter, or a measurement, that exists between the sensors and the tags. The physical parameter can be something as simple as visibility of the tag to anchor or it can be more complex, such as measuring the time a signal takes to travel from the tag to the sensor. The number of location sensors needed in a facility usually depends on the technology, the application, and the desired accuracy. For example, if you are implementing an RTLS for recording and monitor where a production asset is, you might need location sensors covering all the facility. In another example, if you are trying to implement an RTLS to monitor is an asset is in the building or not, you just need to locate an anchor at the gates. Central Server: It communicates with anchors and manages the antennas, calculates the locations (distance and position) of the tags, and makes those data available to be exploited to application software. It contains location engine that determines the location of the tags and the middleware, which resides among the pure RTLS technology components and the business applications as seen 12 Kasyap Suresh and others, ‘A Comparative Survey on Silicon Based and Surface Acoustic Wave (SAW)-Based RFID Tags: Potentials, Challenges, and Future Directions’, IEEE Access, 8 (2020), 91624–47 . 13 Arvind Lakshmanan and Vivek Maik, ‘Active RFID Tag with Better Tracking Range for Automotive Applications’, 2020, 165–69 . 14 Akshay Jayraj Suvarna, Avaneesh Pratap Singh, and H. K. Shashikala, ‘Beacon Technology’, International Journal of Computer Science and Mobile Computing, 8.6 (2019), 100–105. CyberFactory#1 | www.cyberfactory-1.org 13
State-of-the-Art on FoF Optimization
Date 03.03.2021

 Figure 3 - General RTLS
 Figure
 structure
 2: (extracted from16).

in Figure 2. In other words, the middleware resides among pure RTLS technology components and
business applications.
Location estimation consist of ranging techniques to estimate distance between the tag and anchor,
and position estimation techniques that derive the position of the tag.
Ranging techniques estimate distance, or range (usually in terms of feet or meters), between the tag
and the anchor. The physical variables that are commonly used to determine the estimated distance are
listed below 16:
1. Time of Arrival (TOA): The time it takes a signal to travel from the location sensors to the tag or vice
 versa. This time to travel, also known as propagation delay, can be converted into distance between
 the tag and the location sensor by multiplying it by the signal’s propagation speed.
2. Angle of Arrival (AOA): The angle between the propagation direction of signal and some reference
 direction, which is known as orientation. Here, direction sensitive antennas are used at anchor points
 to determine the direction and angle of the signal coming from a tag. Then, the tag position is
 estimated by finding the intersection of different signal propagation paths.
3. Time Distance of Arrival (TDOA): Similar to TOA but instead of exact TOA measurement TDOA
 measures the difference in transmission times between signals received from each of the
 transmitters to a tag or vice versa.
4. Time of flight (TOF): Uses measured elapsed time for a transmission between a tag and a location
 sensor based on the estimated propagation speed of a typical signal.
5. Round trip time (RTT): Uses the total time for a signal to start from the anchor and the
 acknowledgment to be received back.
6. Received signal strength indicator (RSSI): A measurement of the power present in a received radio
 signal. As a signal leaves its source, it attenuates, meaning that the power of the signal drops. The
 drop is logarithmic, and the signal attenuation in open space, as well as different medium, is well
 defined. Because the power levels at the start of transmission of a signal are known, RSSI can be
 used to estimate the distance the signal has traveled.
In general, no single variable can be used to provide accurate ranging estimation under all
circumstances. Each of them has its own advantages and limitations in terms of location accuracy and
generally, a combination of some of them is used.

CyberFactory#1 | www.cyberfactory-1.org 14
State-of-the-Art on FoF Optimization
Date 03.03.2021

Position estimation techniques derive the position of the tag. This includes making use of estimation
algorithms on all the estimated tag distances from the location sensors and the actual position of all the
anchors to the estimated tag position. Commonly used algorithms are15:
1. Trilateration: A technique in which you can estimate the position of something if you know the
 distance to three different locations.
2. Triangulation: A technique in which you can estimate the position of something if you know the line
 angle between that something and the three different locations with respect to a common reference
 line, such as a line pointing up.
3. Nearest neighbor: Simply neighbor relationships are used to estimate a position. A neighbor
 relationship is based on any of the ranging techniques, such as RSSI.
Many technologies are available that enable an RTLS with one of the variables and the algorithms
described in previous paragraphs. Bluetooth, RFID, ultra wideband (UWB), Wi-Fi, ZigBee and etc are
among those technologies which will be examined in detail later on in this document. Each of these
positioning technologies has certain level of accuracy and a service area where it performs better. Then,
you can’t rely on any one technology to provide accurate location information in all environments. Each
technology has its pros and cons as summarized in following chapters.
Application software16: The computer software interacts with the RTLS middleware to solve the
problems challenging end users, such as enabling users to achieve the tasks that they wish to
perform or solves problems for another application program. The application provides the end user
value, the real time actionable business intelligence that is accessible to the relevant systems and
people. It involves the establishment of alerts, alarms, actions, decisions, audit trails, and
documentation.

3.1.2. Positioning Technologies
The asset tracking in production aims to control parts, elements or tools that take action in the
production line, as well as the process itself, its disruptions and the data it produces. Nevertheless,
the components of an RTLS and its capabilities may depend on the technology used for its
implementation. In this document, focus is on the indoor positioning technologies. Therefore,
previously mentioned technologies such as such as, RFID, BLE and UWB and their components
will be reviewed in following parts:
Bluetooth Low Energy (BLE) Technology: It is a subset of the Bluetooth v4.0 standard (or
emerging standards such as Bluetooth 5)17. It has a completely new protocol stack in reference to
the OSI layer and oriented to simple connections in very low power applications. The technology is
primarily used for mapping and location services using the RSSI (received signal strength indicator)
estimate18. The broadcasted beacon signals can be captured by smart gadgets, like phones, to call
ad-hoc actions as shown in Figure 4.

15 Pouria Zand and others, ‘A High-Accuracy Concurrent Phase-Based Ranging for Large-Scale
Dense BLE Network’, IEEE International Symposium on Personal, Indoor and Mobile Radio
Communications, PIMRC, 2019-Septe (2019).
16 Ajay Malik, RTLS for Dummies (NJ: Wiley Publishing, 2009).
17 “BLE.” [Online]. Available: https://www.elt.es/en/ble. [Accessed at April 30, 2020].
18 “Mark up the world using beacons.” [Online]. Available:
https://developers.google.com/beacons. [Accessed at April 30, 2020].

CyberFactory#1 | www.cyberfactory-1.org 15
State-of-the-Art on FoF Optimization
Date 03.03.2021

 Figure 4 - BLE beacons (extracted from19).

Using a Bluetooth connection, the technology is cheaper than alternatives and easier to use and
support. The main components of a RTLS based on BLE technology are the beacons and gateways:
BLE Beacons: Beacons are small battery powered devices that emit a BLE signal that is picked up
by the BLE GW. The BLE beacon hardware consists of a microcontroller with a Bluetooth LE radio
chip and a battery. New radio chips are optimized for Bluetooth LE, whereas older versions were
designed for Bluetooth Classic, which had higher power consumption. Coin cell batteries are the
most popular choice for most beacons. These batteries are dense Lithium Ion cells and provide up-
to 1,000 mAh of stored power in a very small form factor. Commonly available coin cell sizes are
240 mAh (CR2032, small size), 620 mAh (CR2450, medium size) and 1,000 mAh (CR2477, large
size). Some beacons also use Alkaline AA batteries. A typical AA battery provides around 2,000
mAh power but at a significantly larger size than coin cell batteries. Lastly, some beacons are
externally powered. They can be installed in a wall outlet or a USB outlet. These beacons do not
need battery replacement and can be economical in certain situations. However, availability of a
power outlet, without running new wiring, at exact spots where a beacon is required may not always
be feasible.
Every beacon has a specific firmware, which is the logic (programmed code) that enables the
beacon hardware to operate. The firmware can control several characteristics that impact the
battery life:
 • Transmit Power (tx power): Beacon devices transmit a signal with a fixed base power,
 known as the tx power. As the signal travels in air, the received signal strength decreases
 with distance from the beacon. Higher tx power means, the signal can travel longer
 distances. Lower tx power means, less battery consumption but also smaller range.
 • Advertising Interval: It is the interval that a beacon emits a signal. An interval of 100ms
 means the signal is emitted every 100 milliseconds (or 10 times in a single second). A higher
 interval of 500 ms means the signal is emitted only twice per second, which means less
 battery drain for the beacon. As the advertising interval increases, the battery life of the
 beacon also increases, but the responsiveness of the phone decreases. There is no optimal
 choice of advertising intervals, and applications needing low latency should choose lower
 advertising intervals, and those needing higher battery life should increase the advertising
 interval.
Each beacon provides its own way of configuring the hardware and associated parameters (Tx
power and advertising interval). Some beacons provide their own proprietary app to configure the
beacons, normally to be installed in a smartphone with BLE interface available. Other beacons
provide open interface via any GATT client. The main advantage of beacons supporting GATT
method is that hundreds of beacons can be configured at once. Tx power and maximum coverage

19 ‘Apple Inc. (AAPL) iBeacon Technology Revolutionizes A New Vision For The Retail Industry’
[online]. Available: https://dazeinfo.com/2014/03/25/apple-inc-aapl-ibeacon-technology-retail-
industry-video/
CyberFactory#1 | www.cyberfactory-1.org 16
State-of-the-Art on FoF Optimization Date 03.03.2021 distance of beacon, in direct line of sight, is shown Figure 5. The range decreases if there are any obstacles between the beacon and the receiver. Figure 5 - Tx power and maximum coverage distance of a beacon (extracted from20). BLE Gateways: Normally BLE gateways are devices with two wireless interfaces, BLE and WiFi, that receives data via BLE and sends them via WiFi to the central server for further processing. In some cases the BLE can have additional intelligence so that it can process somehow the received signal, not just forwarding it. For instance, the GW can calculate the distance from the obtained RSSI from the beacon, or even smooth somehow the received RSSI so that to improve its quality. They can also provide additional functionalities such as device monitoring and security. We can define technology by its defined OSI layers: • Physical Layer: BLE technology is capable of using up to 40 2MHz channels in the 2.4 GHz ISM band. • Link Layer: Layer that manages the connection (HCI Protocol) and the definition of roles (Advertiser, Scanner, Master and Slave) in communication. • L2CAP Layer (Logic Link Control and Adaptation Protocol): Message format and encapsulation. MTU (27 Bytes). • GAP & GATT Layers: Visibility and Interaction between two devices. GATT is based on the Attribute Protocol (ATT). Radio Frequency Identification (RFID) Technology: It is the wireless non-contact technology use of radio frequency waves to transfer data, whereby digital data encoded in RFID tags are captured by a reader via radio waves. Tagging items with RFID tags allows users to automatically and uniquely identify and track inventory and assets. At a simple level, RFID systems consist of three components: an RFID tag, an RFID reader and an antenna. RFID readers are responsible for generating the waves that are emitted by the antennas towards the tags, and at the same time they also receive and decode the signal emitted by the tags that arrives through the antenna to the reader. The antenna and reader can be coupled into the same device or they can be two separate devices connected through a coaxial cable. This is why they are normally described together. The first option has the advantage of avoiding signal loss through the connection cable but, on the contrary, is more expensive as it normally implies to have always one reader per antenna. On the other hand, the second option has the advantage that multiple antennas can be added to the same reader (that is the most expensive device), but the signal loss through the coaxial cable must be considered and therefore lower power is emitted by the antenna and scope of the coverage is lower. Among several specifications, the three most important to take into account when selecting a RFID reader and antenna are frequency, polarization and gain. Frequency: RFID operates at several frequencies bands 21: 20 ‘The Hitchhikers Guide to iBeacon Hardware: A Comprehensive Report by Aislelabs’ [online] available: https://www.aislelabs.com/reports/beacon-guide-2014/ 21 Angell, I., Kietzmann, J. (2006). "RFID and the end of cash?"(PDF). Communications of the ACM. 49 (12): 90–96. CyberFactory#1 | www.cyberfactory-1.org 17
State-of-the-Art on FoF Optimization Date 03.03.2021 o Low Frequency (LF): This band covers 30 KHz to 300 KHz. Typically LF RFID systems operate at 125 KHz, although there are some that operate at 134 KHz. This frequency band provides a short read range of 10 cm, and has slower read speed than the higher frequencies, but is not very sensitive to radio wave interference. LF RFID applications include access control and livestock tracking. o High Frequency (HF): This band ranges from 3 to 30 MHz. Most HF RFID systems operate at 13.56 MHz with read ranges between 10 cm and 1 m. HF systems experience moderate sensitivity to interference. HF RFID is commonly used for ticketing, payment, and data transfer applications. o Ultra High Frequency (UHF): The UHF frequency band covers the range from 300 MHz to 3 GHz. Regarding UHF (Ultra High Frequency) RFID antennas, the most used frequencies are 902-928 MHz (US/FCC), 865-868 (EU/ETSI), 860-960 (Global). In Europe, there are two used bands, which are the low-band (865,6-867,6 MHz) and the high-band (915-921 MHz). Moreover, there is another important frequency, which is 433 MHz, that is widely used form large range vehicle identification, people/object control and security applications. The read range of passive UHF systems can be as long as 12 m, and UHF RFID has a faster data transfer rate than LF or HF. UHF RFID is the most sensitive to interference, but many UHF product manufacturers have found ways of designing tags, antennas, and readers to keep performance high even in difficult environments. Passive UHF tags are easier and cheaper to manufacture than LF and HF tags. The selected frequency for an application depends on their requirements. The higher frequency, the higher the distance and the reading speed, but also the cost. When selecting an RFID antenna and reader, it must be assured that the selected frequency range is suitable for the region / country where it will be deployed. Gain: A higher gain implies a thinner electromagnetic beam. Therefore, a higher gain creates a narrower but longer coverage area, achieving a larger reading distance. This is, the antenna will be more directive. The ideal gain and beam width will depend on the application requirements. For example, using antennas of 8,5-10 dbi or higher will allow to emit a higher power and to obtain a higher reading rate. Polarization: Most of the antennas have circular or linear polarization. If all the tags will be read in the same orientation and height in a specific application, the linear polarization fits better. On the other hand circular polarization antennas have the advantage of fitting better on applications where is difficult to foresee the orientation or location of the tag. Therefore, the use of circular polarized antennas is wider due to this flexibility. Taking all these aspects into consideration, the most suitable RFID deployment for a RTLS solution in an industrial environment should use UHF antennas and readers for European standards 865- 868 MHz (EU/ETSI). It should also be a directional antenna with high gain (8,5 – 10 dbi or higher) for achieving larger reading distance. In addition, with circular polarization, for being independent of the tag orientation. Some of the aspects to consider when selecting RFID tags are the type (label, protected, etc.), operation frequency (LF, HF, UHF), environment (metal, indoor, outdoor, etc.), fastening method (adhesive, pinned, etc.), reading distance and rate, size and cost, among others. Operation Frequency: The tag frequency selection depends on aspects such as the required reading distance, material where the tag will be located and the reading rate. For example, if large distances are required (higher that 1-3 meters) UHF tags are required. When working with UHF tags, devices that are compliant with the well-known and widely used Gen2 standard are recommended. Tag type: The tag type selection depends on the reading distance, cost, size, weight and application type. In short, there are passive and active tags. Passive ones use tags with no internal power source and instead are powered by the electromagnetic energy transmitted from an RFID reader. The lower price point per tag makes employing passive RFID systems economical for many industries. Active tags are battery-powered that continuously broadcast their own signal. Active tags provide a much longer read range than passive tags, but they are also much more expensive. CyberFactory#1 | www.cyberfactory-1.org 18
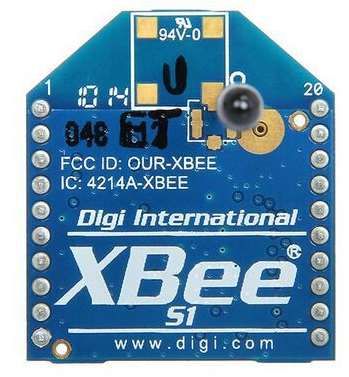
State-of-the-Art on FoF Optimization Date 03.03.2021 Environment: Regarding environment, it has to be considered that metal environments provoke signal to bounce and water environments absorb energy. There are solutions to the challenge of using RFID on metal and water, but specially designed tags are more expensive than generic tags that can be used on RF-friendly objects. For example, metal objects interfere with and disturb the tag functioning, especially on LF and HF. In this case, UHF tags are recommended and additionally they require a little separation between the tag and the metal surface. Orientation: The tag orientation regarding the antenna also affects the own tag performance. The best orientation is always when the tag and the antenna are in the parallel plane to each other. Like this, the tag can receive the whole energy from the antenna. While the tag turns, it presents a smaller effective area for the electromagnetic waves and, therefore, takes less amount of energy. The reading distance of the tag reduces as the obtained energy is smaller. This is why a small size tag will be readable to a shorter distance that a bigger tag. Considering all these aspects, the most suitable RFID tag for a RTLS solution in an industrial environment should use UHF tags for higher reading distance and metal specific tags (taking into account that these ones cannot be passive or small size). Ultra-Wide Band Technology: Indoor positioning with Ultra-Wide Band (UWB) has some significant advantages: The accuracy is 10-30 cm; latency time is very low (position request up to 100 times/second); height differences can be measured accurately. Anyway, the technique is a special solution which requires appropriate components that will summarized in this section. The base of the system is a set of anchors that are positioned in the area to be monitored, used as positioning reference. The other part of the system is one or multiple tags that are fixed to the object that are to be tracked. Both devices, anchor and tag, have very similar HW, they are usually equipped with a UWB module and power supply. In addition, they are then provisioned with tag or anchor firmware, depending on the role. For the UWB anchors, they are also provided with an additional interface (Ethernet, WiFi, LoRa, 3G, etc) for data transmission and configuration. Anchor is a referential device with a known position. In a RTLS context, anchors are electronic devices that detect UWB pulses emitted by UWB Tags and forward them to the location server for calculating tag positions. To cover the area with an indoor tracking system, a set of anchors needs to be installed above the area to create the location infrastructure, where tags are being located. An UWB RTLS Platform is fully scalable, allowing the unlimited expansion of monitored area just by adding extra anchors to the network. In a RTLS context, tags are small electronic devices that are attached to objects that need to be tracked. The tags send out blinks that are received by anchors and forwarded to the location server for calculating the tags’ position. RTLS Tags are used for asset tracking, vehicle tracking, material flow analysis and employee location tracking for safety reasons. Wi-Fi positioning systems (WPS): In WPS, multiple wireless access points measure the relative signal strength of assets to approximate their position inside a facility. Factories usually have a Wi- Fi network deployed and easy to make deployment of the system. GPS has a similar function on works outdoors. ZigBee: It is another wireless standard operating in an unlicensed segment of the broadcast spectrum. Its range is slightly greater than Bluetooth, but this comes at the cost of some reliability problems. A wireless connectivity module implementing ZigBee standard is shown in Figure 6. Advantages: • Simple Technology—ZigBee is an older, relatively simple wireless technology that’s easy to implement in any environment. • Cost for tags and receivers are durable and inexpensive. However, the signals can easily degrade in ‘complicated’ environments and have interferences. CyberFactory#1 | www.cyberfactory-1.org 19
State-of-the-Art on FoF Optimization
Date 03.03.2021

 Figure 6 - Example of Zigbee module (extracted from22).

Sensor and Micro-controllers: In commercial market, we have a multitude of sensors and
communication elements for IoT. One example is NodeMCU which is the development board based
on the ESP8266. It incorporates:
 • a low-consumption 32-bit MCU (Tensilica L106)
 • 2.4 GHz WiFi module
 • RAM of about 50 kB
 • 1 analog 10-bit input (ADC)
 • 17 GPIO input and output pins (general purpose)
Outdoor Tracking Systems, possibilities offered by 5G technology: Location technologies will
only get better with the advent of the new wireless standards within 5G. Location aware devices
and components will boost up capabilities of industry 4.0, medicine, smart city applications. High
positioning accuracy will be achieved with the help of large number of sensors, high bandwidth, low
latency and new frequency ranges. Drones, AGVs, further location aware devices maybe combined
with AR technologies to enrich logistics and asset tracking applications. Positioning accuracy in
cellular networks is expected to increase from 20 meters to a few decimeters in upcoming new
releases of 5G standards23.

3.1.3. Data Collection
In this section, a short introduction to data collection and big data will be given. Then, data collection
from RTLS technologies and other data sources will be described. Data collection is the process of
gathering and measuring information on variables of interest, in an established systematic fashion
that enables one to answer stated research questions, test hypotheses, and evaluate outcomes.
Big data can be defined as data sets or combinations of data sets whose size (weight or volume),
complexity (variability) and growth rate (speed and scalability) make it difficult to capture, manage,
process or analyze them using conventional technologies and tools, as conventional statistical and
relational databases or visualization packages, within the time necessary to be useful. The data set
in normal use of technology generally varies from 50 terabytes to several petabytes.
The different types of data are also:
 I. Types of unstructured data: documents, logs, social media videos, audios, etc.
 II. Semi-structured data types: software, spreadsheets, reports.
 III. Structured data types.

RTLS, as a two-way wireless communication system to share real time location data, is a reliable
and efficient real-time big data source to establish communication between tags and readers and
provides frequent updates.

22 ‘Digi XBee Zigbee Datasheet’[Online]. Available: https://www.digi.com/resources/library/data-
sheets/ds_xbee_zigbee [Accessed at April 30, 2020]
23 “Expected Positioning Accuracy of 5G.” [Online]. Available:
https://www.iis.fraunhofer.de/en/ff/lv/lok/5g/accuracy.html [Accessed at April 30, 2020].
CyberFactory#1 | www.cyberfactory-1.org 20
State-of-the-Art on FoF Optimization Date 03.03.2021 Nevertheless, data collection in a RTLS solution may depend on the technology used for its implementation. Therefore, data acquisition approaches of previously mentioned technologies will be summarized in this section. The central server of an RTLS system plays a crucial role in data collection. It is responsible for calculating the asset location based on the information received from the antennas and the proposed technologies. Data Collection in RFID: RFID belongs to a group of technologies referred to as Automatic Identification and Data Capture (AIDC). AIDC methods automatically identify objects, collect data about them, and enter those data directly into computer systems with little or no human intervention. RFID tags contain an integrated circuit and an antenna, which are used to transmit data to the RFID reader. The reader then converts the radio waves to a more usable form of data. Information collected from the tags is then transferred through a communications interface to a host computer system, where the data can be stored in a database and further analyzed. Information collected from tags and stored in the repository, is normally a tag ID detected by an antenna and a timestamp. Thanks to this information, if each tag ID is linked to a monitored asset and each antenna is linked to a monitored area, we can establish that an asset is or is not in a certain area. Due to this fact, RFID based solutions are mostly used for identification purposes than for accurate location tracking, but depending on the requirements of the use case it can provide useful location information. Data Collection in BLE: BLE beacons emit a BLE signal. The signal is picked up by the BLE gateway, and often transmitted to a central server. This central server processes the received signal strength indicator (RSSI) from each gateway to a same beacon, and based on this data it can estimate the distance from each gateway to the beacon. Then, thanks to trilateration techniques, at least the information from three gateways is needed, the beacon location is estimated. Due to the RSSI instability due to equipment and environment, the obtained location is not highly accurate, and therefore, BLE based solutions are more suitable for proximity evaluation. Data Collection in UWB: UWB measures that Time Of Flight (ToF), time that the light signal takes to cover the distance between the anchor and the tag. It is recommended to have line of sight between the tag and the anchor. UWB anchors transmit a very wide pulse over a GHz of spectrum. The anchors then listen for chirps from the UWB tags. These tags have a spark-gap-style exciter that generates a little pulse within them, which creates a short, coded, very wide, nearly instantaneous burst. Each anchor then reports very accurate time measurements from the tag back to a central server, which processes and combines the received ranging results of the anchors to each tag and calculates the tag location. Nevertheless, there are several modes of functioning Tag – Anchor, such as: Two Way Ranging (TWR), a technique adopted for determining the distance between two devices. One device sends a packet to the second one, which responds immediately. Then, the first device is able to determine the time elapsed between the time instants related to the first transmission and the response reception (the so-called round-trip time). Since the speed of light is known, the distance can be directly estimated from the round-trip time measure. By combining several TWR measurements between anchors and the tag, a tag can be localized. Time Difference of Arrival (TdoA), a location technique according to which the tag position is estimated by comparing the time delay between the receptions of signals coming from different nodes (anchors), as done by GPS receivers with satellites signals. The TDoA methodology enables the tracking of an unlimited number of tags within the system and thousands of them within a single area for tracking assets, monitoring forklifts or employee location tracking. Issues with Data Collection: the data collection process and their results are a challenging task and involve many issues that must be addressed before the data is collected and used. The main issues in the process of data collection and utilization are: The raw collected data may not be in the usable form right away and may require additional efforts or changes to make it usable. User privacy issues: Privacy and security data politics. Not all data can be collected and processed. Sometimes you have to apply anonymity algorithms to collect the data. The amount of data can cause a system size problem. Data extraction can be extended in time by its quantity or by its sampling. Ethical norms about the data: Honesty, Objectivity, Integrity, Non-Discrimination …etc. CyberFactory#1 | www.cyberfactory-1.org 21
You can also read