From Objective to Subjective Difficulty Evaluation in Video Games
←
→
Page content transcription
If your browser does not render page correctly, please read the page content below
From Objective to Subjective Difficulty
              Evaluation in Video Games

    Thomas Constant, Guillaume Levieux, Axel Buendia, and Stéphane Natkin

              Conservatoire National des Arts et Métiers, CNAM-Cédric
                    292 Rue St Martin, FR-75141 Paris Cedex 03
                              first.last@lecnam.net

        Abstract. This paper investigates the perception of difficulty in video
        games, defined as the players’ estimation of their chances of failure. We
        discuss our approach with regard to the psychophysical studies of subjec-
        tive difficulty and to the cognitive psychology research on overconfidence
        bias. We assume that the strong motivational pull of video games may
        lead players to be overconfident and underestimate their chances of fail-
        ure. Our method is tested within three games related to three types of
        difficulty, where the players have to bet on their capacity to win each
        challenge. Results confirm the existence of a gap between the players
        actual and self-evaluated chances of failure. More precisely, players seem
        to strongly underestimate high levels of difficulty. Results do not show
        any influence of the players gender, feeling of self-efficacy, risk aversion
        and gaming habits on the difficulty estimation error.

        Keywords: User Modelling · Affective HCI, Emotion, Motivational As-
        pects · Tools for Design, Modelling, Evaluation · Fun / Aesthetic Design

1     Introduction
Jesper Juul proposes to define a video game as “a rule-based formal system
with a variable and quantifiable outcome, where different outcomes are assigned
different values, the player exerts effort in order to influence the outcome, the
player feels attached to the outcome, and the consequences of the activity are
optional and negotiable” [1]. In this definition, the player exerts effort to influence
the outcome, which emphasizes the fact that a game must have a certain level
of difficulty to be considered as such.
    Many authors acknowledge challenge as one of the most fundamental aspect
of video games’ inherent appeal. Malone proposes three features of computer
games that make them so captivating: challenge, curiosity and fantasy [2]. In his
model, challenge is directly related to the game’s difficulty and corresponds to
the uncertainty for the player to reach the game’s goals. Lazzaro proposes a four
factor model, where Hard Fun is related to the feeling of overcoming difficult
tasks [3]. Sweetser et al see also challenge as one of the most important part
of their Game Flow framework [4]. Their work stems from Mihaly Csikszent-
mihalyi’s Theory of Flow [5], who has been trying to figure out the properties
2 Constant et al.
of activities showing a strong, intrinsic ability to motivate. Csikszentmihalyi re-
search states that these activities provide perceived challenges, or opportunities
for action, that stretch (neither overmatching nor underutilizing) existing skills
[5]. The study of large population of players in two commercial games confirm
that players prefer specific levels of difficulty[6] Ryan et al study as well intrin-
sic motivation and apply their Self-Determination Theory to video games. They
show how enjoyment is related to the feeling of competence, which relies on an
optimal level of challenge, and thus, to the game’s difficulty [7]. Jesper Juul
provided insight on how failure, and thus difficulty, is one of the core aspects of
video game enjoyment and learning progression [8, 9].
In order to foster and maintain the players’ motivation, it is thus fundamental
to correctly set the difficulty of a video game. One can provide different difficulty
settings for the player to select, or use an algorithm that adapts the gameplay’s
difficulty in real time to match the game designer’s theoretical difficulty curve
with regard to the current player skills [10–12].
It requires beforehand to evaluate the game’s difficulty. The game designer
might provide a heuristic which may or may not express the game’s difficulty.
We may use sensors to estimate workload or affective state, but currently only in
a lab setting and this question is still by itself a research topic [13, 14]. We could
also try to estimate the players’ chances of failure [15]. All these approaches
provide insight on a specific aspect of a game’s difficulty.
The point is, difficulty is by itself a complex notion. We may draw distinctions
between skill-based difficulty, effort-based difficulty [16], and between sensory,
logical and motor difficulty [15, 17]. Moreover, video games are created for an
aesthetic purpose, evoking specific emotion in the player [18]. Thus, we must
draw a fundamental distinction between objective difficulty and subjective dif-
ficulty. Objective difficulty is to be directly estimated by observing gameplay
variables and events, while subjective difficulty is a psychological construct of
the player. When adapting a game’s difficulty, especially when using a dynamic
difficulty adjustment (DDA) algorithm, we rely on an objective estimation of
difficulty, which may be quite different to what the player actually feels while
playing the game.
The main objective of this paper is to study the relationship between sub-
jective and objective difficulty, in the context of video games. We thus review
different studies on both subjective and objective difficulty estimation in the
next sections. First, we present the psychophysical approach of perceived diffi-
culty. Second, we report cognitive psychology studies on overconfidence. Then,
we introduce our method for measuring objective and subjective difficulty. Ob-
jective difficulty is modelized using a logit mixed effect regression to estimate
the player’s actual chances of failure for a given challenge. Subjective difficulty is
considered to be the player’s estimation of his chances of failure, that we gather
using an in-game bet system. We then present the three games we developed
for this study, allowing us to separate logical, motor and sensory gameplays. We
detail and discuss our results in the last sections.From Objective to Subjective Difficulty 3
2 Psychophysical approach to subjective difficulty
Many studies have tried to clarify the link between subjective and objective
difficulty in various tasks: Raven’s progressive matrices, digits memorization, vi-
sual search of letters, wire labyrinth [19, 20], Fitts’ tapping task [21, 22], dart
throwing on a moving target [23], rock climbing [24] or reaction time, even while
riding a bike [19, 25]. All these experiments take a psychophysical approach, try-
ing to estimate the link between objective difficulty as a stimulus, and subjective
difficulty as a perception or evaluation of this stimulus.
These studies use various techniques to estimate objective difficulty, and
often tend to draw a distinction between objective difficulty and performance.
For all the Fitts’s tapping task, authors use the Fitts’s law [26] as a measure
of objective difficulty, and time as a measure of performance. When such a law
is not available, they rely however solely on performance, e.g. response time or
success frequency [23, 20], or select a variable highly correlated with perceived
difficulty like electromyographic data from a specific muscle in the rock climbing
experiment [24]. Also, in these studies, objective difficulty is never assessed with
regard to each subject abilities, but across all or a few subgroups of subjects. In
our research, we do not rely on any specific objective difficulty estimation but
follow a more generic approach that allows cross-game comparisons. We estimate
a mapping between the challenge’s variables and the player’s probability to lose
this challenge. We also use a mixed effect model that can take into account each
player’s abilities.
In these studies, subjective difficulty is assessed by the subject using a free
scale. Very often, a reference value is given to the subject, e.g. subjective difficulty
of 10 for a specific task [21]. Deligniere has proposed the DPE-15 scale, a 7 points
Likert scale with intermediate values, for a more convenient and comparable
measure [23]. In our experiment, we integrate the measure to the gameplay
and will use a specific 7 points scale, described in section 4. To avoid personal
interpretation of the notion of difficulty evoked in the previous section, we will
concentrate on the success probability, as estimated by the player.
Except in Slifkin & Grilli [21], all subjective evaluations are done at the end
of the challenge, often after having repeated the challenge many times. We think
that to understand what the player feels while playing a video game, and not
when thinking back about a past game session, it might be interesting to have
a look at the player’s evaluation of the current difficulty, during each one of his
attempt to overcome a challenge. As our measure of subjective difficulty is an
estimation of failure chances, it can be integrated to the gameplay and thus be
repeated more often without pulling the player out of the game (see section 4).
3 Overconfidence and the Hard/Easy effect
We define subjective difficulty as the players’ own evaluation of their chances
of failure. This evaluation is a complex cognitive process, often rushed, based
on the interpretation of incomplete information about the game state, on in-
game performance feedback, and on assessments of the players own knowledge4 Constant et al.
and skills with respect to a specific challenge. Cognitive psychology research on
judgmental heuristics studies how such a reasoning can be biased, and can help
us understanding how players may have a wrong evaluation of their chances of
success.
Heuristic approach to judgment and decision-making has opened a vast field
of research to explain human behavior in a context of uncertainty. Kahneman
& Frederick [27, 28] consider that, confronted to a complex decision, people sub-
stitute one attribute of the decision to a simpler one, more available, to reduce
cognitive effort. In some cases, the use of judgmental heuristics can lead to fun-
damental errors, called cognitive biases by Kahneman & Tversky [29].
The overconfidence effect is one of those. Well-studied in the financial field,
this behavior relies on a surrealistic evaluation of our own knowledge and skills,
leading to an overestimation of our abilities or of those of others [30–34]. Over-
confidence seems particularly interesting to study with regard to video games as
those are essentially built to motivate their players. Self-efficacy theory of moti-
vation states that having a strong confidence in his future chances of success is
a key aspect of motivation [35]. Video games, using for instance a well crafted
difficulty curve, may manipulate the players’ perception of their success chances
to keep them motivated.
Overconfidence has already been studied in many games. During games of
bridge, beginners or amateurs players can misjudge both their performances and
play outcomes [36]. The same results were noticed about poker’s players, where
beginners show inferior capacity to predict their odds of winning [37], during
game tournament of poker and chess game [38], or associated with gambling
games [39, 40]. In brief, the overconfidence effect appears when the players have
a limited knowledge of the game and for any type of game, whether it is a pure
game of chance, like fruit machine, or a skill based game, like chess game.
There exist many situations and cognitive biases that influence the overesti-
mation or underestimation of one chances of success, like the level of expertise
[41, 42], the gambler’s fallacy [43, 44], the hot hand bias [45, 44], the illusion of
control [46, 47] or the hard/easy effect. All these aspects of overconfidence are
worth studying in the context of video games but for this research, we chose to
focus on the hard/easy effect. The hard/easy effect specifies that for low and high
level of difficulty, decision-makers cannot estimate the real difficulty of the task
[48]. For low levels, they will underestimate their chances of success, whereas for
high levels, they will overestimate them [41, 33].
Starting from the hard / easy effect, our research focuses on two main points.
First, from a methodological point of view, we want our experiment to be as close
as possible to a real video game. Thus, we use a dynamically adjusted difficulty
that starts from a low level of difficulty, which is a key element of game design.
We also do not evaluate players’ confidence by directly asking them if they
feel confident on a percentage scale, but instead we use a betting mechanism
integrated to the gameplay, avoiding to break the player’s immersion. Second,
our research distinguishes between three types of difficulty. We use three differentFrom Objective to Subjective Difficulty 5
games, each one of them focusing on a specific kind of difficulty. We fully describe
our experiment in the next section.
4 Experimentation
As stressed out in the previous sections, there exist different types of difficulties in
video games. In this experiment, we want to assess them separately, in an attempt
to distinguish between various facets of video games. We follow Levieux et al [17,
15] approach and consider three categories of difficulty in games: sensory, logical
and motor. Sensory difficulty relates to the effort needed to acquire information
about the game state. Logical difficulty corresponds to the effort needed to induce
or deduce, from the available information, the solution of a problem in terms
of action(s) to perform. Lastly, motor difficulty is related to the physical agility
needed to perform these actions. To realize an accurate analysis of the player’s
behavior for each of these types, the experiment is split between three specifically
designed games.
In this experiment, we choose a general, practical approach and estimate the
probability that a player has to fail at a specific challenge, with respect to his
current skills [15]. As the player will be asked to evaluate his chances of success,
there is no risk for the player to hesitate between effort-based and skill-based dif-
ficulty. Moreover, our definition of difficulty directly follows Malone’s definition
of challenge, as a source of uncertainty in video games [2]. Indeed, uncertainty
about success or failure is what Costikyan calls uncertainty of outcomes [49].
Also, to distinguish between logical, motor and sensory, we designed three dif-
ferent games which are described in section 4.3. In order to maximize the player
motivation and propose an experience as close as possible to an actual game,
the system adapts dynamically the difficulty, analyzing the player’s successes
or failures. Many games use a dynamic difficulty adaptation, like racing games
(mostly rubber banding like in Mario Kart series), RPG (e.g. Fallout series) or
FPS (e.g. Unreal Tournament series) where the difficulty to defeat an opponent
depends on the players level. Games without dynamic difficulty adaptation can
use a predetermined difficulty curve, based on the mean level of the players.
On the opposite, few games use a totally random difficulty, and for those (e.g.
FTL, The Binding of Isaac), there is still a global progression. Thus, randomness
would be more convenient for statistical analysis, but also highly questionable
from a game design perspective.
Furthermore, to avoid any memory bias on the past challenge and to better
monitor the actual feeling of the player, we measure the subjective difficulty
during the game session and not with post-experiment questionnaires [50]. To
be able to do so without pulling the player out of the game, we propose to use
a bet system, described in the next section.
4.1 Measuring Subjective difficulty
Our proposition adopts the cognitive psychology tools to measure overconfidence,
and integrates them to the gameplay. Our goal is to avoid any disturbance dur-6 Constant et al.
ing the game session, to keep a high level of engagement and motivation. The
measure is made before the players choices, as a pre-evaluation, but after giving
them all the elements useful to perform their judgment. We use a bet system
based on a 7 points Likert scale, which is integrated into the game progression
and, thus, is related to the players’ score. If the player wins, the amount of the
bet is added to his score; and if he loses, this amount is subtracted, improving
players concentration on their own evaluation. An in-game question is used as
instruction for betting and as a reminder for the players to strictly assess their
own confidence.
Measurement of the subjective difficulty is based on the players’ bet, noted
Dsubj . With b being the bet value we use the formula Dsubj = 1 − b−1 6 to get
the estimated chances of failure.
4.2 Measuring Objective difficulty
The objective difficulty of a challenge is estimated from the players’ failures
and successes for that challenge, as Levieux et al defined it [17, 15]. In order
to take into account personal differences, we estimate for each challenge the
objective difficulty by fitting a logit mixed-effects model [51]. Time and difficulty
parameter of each challenge (e.g. cursor speed, number of cells...) are used as
fixed effect parameters, and we add random intercepts. We use a mixed model
through repeated evaluations of the same subject. The random intercepts give us
a coefficient for each players that we use as a global evaluation of each player’s
level. The gap between the players’ objective difficulty and their evaluation of
odds of winning is called the difficulty estimation error. The design of the three
games, each one based on a difficulty type - logical, motor or sensory -, is detailed
in the next section.
4.3 Game’s description
The experiment is based on the observation of the players’ bet for the three
dimensions of difficulty. Each dimension is represented by a specific game, de-
scribed as follows, for which all the adjustment variables for the challenges are
pre-established and common for all players. A first series of playtests was also
conducted with the target audience, in the same settings used during the exper-
iments, for gameplay calibration.
A brief story was included in order to improve the player’s motivation and
to have a narrative justification of the bet system. In the game universe, the
players have to save citizens of a mysterious kingdom, transformed into sheep by
the local sorcerer. The players challenge the sorcerer during three tests, one for
each kind of difficulty. The players’ unique objective is to save as many sheep as
possible. Then, each game is an opportunity for the player to save doom citizens,
by betting one to seven sheep on their odds of winning.
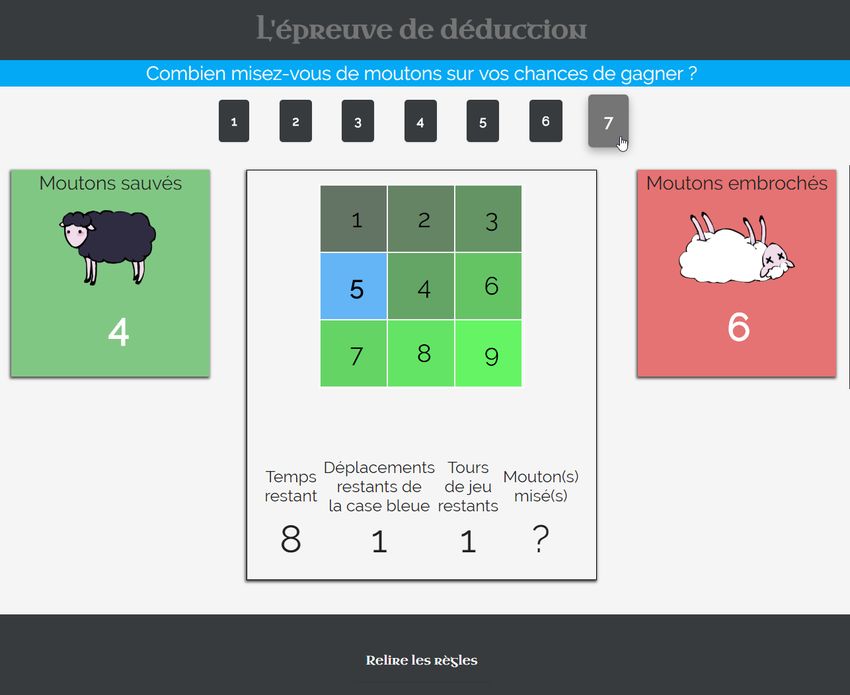
All games show a common user interface, except for the central frame that
depends on each sub-game (figure 1). All important information is displayed
at the bottom of the central frame, like the number of remaining turns, theFrom Objective to Subjective Difficulty 7
global score, and remaining number of actions for the logical game. Directives
are placed just below the main title, on a colored banner, blue for directives,
red for corrective feedbacks. A rules reminder is accessible at the bottom of the
screen.
Feedbacks are provided all along the player’s progression, right after the
results presentation. Positive (on green background) and negative ones (on red)
are displayed on the two sides of the screen, allowing the players to constantly
follow their amount of saved and lost sheep. Sounds are associated to them;
one bleating for a saved sheep, one sorcerer’s mocking laugh for a lost one.
Animations are used to aim for a more stimulating in-game interface.
For each game, we modify the difficulty using a difficulty parameter. This
parameter varies from 0 to 1 and is used to interpolate gameplay parameters,
defined in the next section. For all games, the difficulty parameter starts at 0.2,
and increases or decreases by 0.1 step after each turn based on players’ success
or failure.
(a) Logical task (b) Sensory task (c) Motor task
Fig. 1: Game interface for the logical, sensory and motor tasks. Logical task is shown
with the whole user interface, while we only show the center frame for the motor and
sensory task. Screenshots were taken for the easiest levels of difficulty.
Logical difficulty The logical task is based on a well-known sliding-puzzle
game. The players have to restore the numerical order of a 300 pixels wide
grid composed of 9 squares. The fifth square, originally placed on the middle of
the grid, is the only one that can be moved. This square can only be moved by
switching position with another, adjacent square (figure 1a). At the beginning of
each turn, before displaying the grid, the fifth square is randomly moved several
times, and the mixed up grid is displayed for 20 seconds before disappearing.
The players have all the information required to place a bet: the remaining
time is visible and the number of inversion is specified. After betting, the grid
will reappear and the players can begin to move the fifth square to restore the
numerical ordering. The difficulty parameter allows us to adapt the difficulty8 Constant et al.
by changing the number of steps during the randomization of the grid, linearly
from 1 to 11 steps.
Sensory difficulty For the sensory difficulty, we designed a 300 pixels wide
grid composed of multiple squares (figure 1b). At the end of a countdown timer,
five of them will fade out during a limited time, that we can approximate as
follows, with t being the fade out time and d as the difficulty parameter: t =
d2 − 0.24d + 1.21 . Then, the players have to find them back, by clicking on
the grid. The selected squares are displayed in a blue color, whereas the other
remains in a gray one, to avoid any color perception bias. The winning squares
will be shown after making a bet, over the players’ selection. By doing so, we
want to induce a near-miss effect, allowing the players to see if they selected
all, some or none of the winning squares. The countdown timer is blocked on 3
seconds. The number of squares will vary with the difficulty of the task: when
the player wins, the grid will gain one square on each side. But the surface of
the grid constantly remains the same, implying that the squares will become
smaller after a winning round. The maximum difficulty levels is a grid composed
of 11 squares on a side; the minimum levels is one composed of 4 squares. This
values are linearly interpolated for in-between difficulties using the difficulty
parameter. Winning squares’ random location is chosen to avoid the most simple
patterns, and thus, to minimize pattern-induced variations of difficulty for a
specific difficulty parameter value. For example, for a 5 squares sided grid, any
adjacent winning squares are forbidden.
Motor difficulty The motor difficulty is a basic and common reflex-based
task. A cursor goes back and forth along a horizontal segment, with a linear
speed. The players have to stop the cursor when it covers a black mark at the
center (figure 1c). They can only stop the cursor by clicking on a button. Before
that, the players have to bet on their chances to success. This evaluation is not
timed. The difficulty of the game is based on the cursor’s speed, ranging linearly
from 100 to 400 pixels per seconds. The sliding area is 320 pixels wide, the cursor
is 15 pixels wide, and the black target 2 pixels wide.
Protocol consistency These three tasks, although different in nature, do
share a similar protocol and always provide the player with the elements needed
to evaluate the difficulty. For the motor task, players can observe the moving
cursor before betting. For the logical task, the game displays the number of
inversions and let the player look at the problem for a fixed duration. For the
sensory one, where the visual memory is crucial, the player select tiles to solve the
problem, but without any feedback, before betting. Previous playtests showed
that the task was really frustrating if the player had to stop focusing on the
grid for betting without selecting the tiles. Each game has a specific gameplay,
as each one focuses on a specific dimension of difficulty. Results can thus be
compared between games, while carefully discussing the gameplay differences.
1
This equation is a quadratic regression of the fade out time. In the game, the color is
incrementally modified in the game loop, but plotting this equation is much clearer
than reading the color update code.From Objective to Subjective Difficulty 9
4.4 Procedures
Experiments were conducted in Paris at the Cité des sciences de l’industrie, a
national museum dedicated to science and critical thinking, during ten days of
the All Saint’s vacations. The target audience was composed of young gamers
and non-gamers population, and they were free to participate. A few declined
the invitation, judging their experience about video game as too weak, or by
lack of interest about participating in a science experiment.
Nine laptops, with the same configuration, were dispatched in an isolated
room. Each one had a mouse and a headset. The main program runs on a
web browser, and was developed with JS, HTML5 and CSS. Participants were
informed that the game’s goal was to save as much sheep as possible, and of the
duration of the experiment, approximately 40 minutes, questionnaire included.
They were not allowed to communicate between them during the session. Before
starting to play, the participants had to fill an online questionnaire employed to
realize several user profile:
– A gaming habits profile, based on the amount of time that participants
spent playing board games, video games (including social games) and gam-
bling games.
– A self-efficacy profile, based on General Self-Efficacy scales [52, 53] and
adapted to video games situations. This part of the questionnaire is only
accessible for the participants who answered yes to the question ”Do you
consider yourself as a video games player?” in the gaming habits section. The
purpose of it is to verify any negative or positive effect of the participant’s
gaming capacities self estimation on his confidence.
– A risk aversion profile, based on Holt and Laury Ten-Paired Lottery-
Choices [54] in order to evaluate the impact of risk incentive on the players’
confidence.
The game macro-progression is the same for all players:
– A prologue introduces the story before a random selection of the three
tasks.
– A specific page presents the rules of the mini-game, just before playing it.
Players can take as much time as they want to understand them.
– Each task, or mini-game, lasts 33 turns. The first three turns are used as a
practice phase. At the end of this practice phase, the score is reset to zero.
– The turn progression is identical for all the mini-games. First, players
have to observe the current game state in order to evaluate the difficulty.
Then, they have to bet from 1 to 7 sheep about their confidence to succeed.
The same question is always asked to the player: ”How much sheep are you
betting on your chances of winning?”. This question allows us to estimate
the players’ perception of his chances of failure. By validating the bet, the
system unlocks the game and players can try to beat the challenge. The result
is presented on screen and the score is updated at the same time. Then, a
new turn begins, with the adequate modification of the difficulty level: when
players win, the difficulty increases; when they lose, the difficulty decreases.10 Constant et al.
– After each task, a screen allows the player to check his/her progression and
score, and works as a game hub, enabling the connection to an other task.
– Then, by completing the three tasks, a brief epilogue of the story announces
the player final score, the sum of all sheep won and lost.
To avoid any order effect, the selection of the task is randomized. The best score
of the day was written on a board, visible by the players. At the end of each turn,
the designed difficulty of a challenge, the players’ bet, their score, are recorded
on CSV files.
5 Results
A total of 80 participants have played the games. Some of them have left the
experiment before the end, but we keep results for all completed games, giving
us a total of 6990 observations. For each task, we remove outliers, such as players
who did not use the bet to perform a self-assessment, placing always the same
bet, or players with outlying performance. A very low score may reflect some
user experience issues, and some players took advantage of the adaptive difficulty
system in order to maximize their score, by deliberately losing with a low bet,
then by placing a high bet on the next easier challenge and so on. Nine outliers
have been removed: one from the motor task, three from the perceptive task,
and six for logical one. We thus removed 300 observations from the dataset.
5.1 Modeling objective difficulty
As explained in section 4.2, we perform a logit mixed effect regression to evaluate
the objective difficulty. For each task, we report the conditional R2 , i.e. using
both fixed and random effects [55] and evaluate the model by performing a
10-fold cross-validation, using our model as a binary predictor of the challenge
outcome (figure 2).
Parameters / Tasks Logical Motor Sensory
4.88 3.23 9.1
Difficulty parameter
(p < 2e − 16)*** (p < 2e − 16)*** (p < 2e − 16)***
−1 −0.46 −0.37
Time
(p = 2e − 6)*** (p = 0.0051)** (p = 0.0454)*
σ(random intercepts) 1.24 0.83 0.76
R2 0.48 0.28 0.42
Cross Validation 0.66 0.61 0.69
Fig. 2: Modeling objective difficulty for each task: logit mixed effect regression results
for difficulty and time over failures.From Objective to Subjective Difficulty 11
As can be seen in figure 2, the difficulty parameter is always highly significant,
and has the strongest effect on failure probability, especially for the sensory
task, which means that we were indeed manipulating the objective difficulty by
changing this parameter.
The effect of time is always negative and significant. This means that, if
the difficulty parameter stays constant, objective difficulty seems to decrease
with time. This might indicate that players are actually learning as their success
rate improves with time for a given difficulty parameter value. Time effect is the
strongest for the logical task (−1) which is coherent with the fact that the player
should learn more from a logical problem than from a purely sensory motor one
(respectively, −0.46 and −0.37). Also, it may be noted that we have the highest
standard deviation of random intercept for the logical task, which means that
inter-individual differences are the highest for this task.
The link between the difficulty parameter and the objective difficulty of the
game can be plot to better understand each challenge difficulty dynamics. We
choose to plot objective difficulty over difficulty parameter at time t = 0. We
also used the random intercept to separate the player in three groups of levels
using k-means (fig. 3).
(a) Logical task (b) Motor task (c) Sensory task
Fig. 3: Objective difficulty for each task at t = 0. Blue dashed line is the median player,
red dashed lines show first and last quartiles. The less efficient players are in yellow,
medium players in cyan and best players in green.
Curves in figure 3 give us information about our design of each task’s dif-
ficulty. We can see that the logical task is the most balanced, with objective
difficulty being the closest to the difficulty parameter value. The motor task
is is a bit too hard for low difficulty levels: objective difficulty is around 0.25,
when the difficulty parameter is 0. Also, sensory task should vary more slowly :
objective difficulty is maxed when the difficulty parameter is only 0.5.
Figure 4 shows the progression of objective difficulty during the game. The
curves confirm the balancing of each task and the efficiency of the difficulty
adaptation system, as the players reach the average objective difficulty level (0.5)
in all cases. The logical task starts at 0.2 for medium players and goes up. The
motor task is too hard at the beginning, and thus bad players see a decrease of
difficulty with time. Sensory task shows a ”wavy” pattern which might be related
to the fact that the difficulty is less stable for this game. Indeed, the difficulty12 Constant et al.
Logical task Motor task Sensory task
All players
Good players
Medium players
Bad players
Fig. 4: Progression of objective difficulty with time for all tasks and players during the
whole play session. Blue line is the median players, dots represent the observations for
each turn.
parameter varies by 0.1 step for all tasks, but as the maximum objective difficulty
is already reached at 0.5, it varies approximately twice faster than for the logical
one.
Overall, the objective difficulty model is the weakest for the motor task with
a low conditional R2 (0.28) and the lowest prediction accuracy (0.61). R2 and
prediction accuracy are higher for the logical (R2 = 0.48, accuracy = 0.66) and
sensory task (R2 = 0.42, accuracy = 0.69).
5.2 Differences between objective and subjective difficulty
To investigate the differences between objective and subjective difficulty, we sep-
arate the data into 16 equally sized bins using the objective difficulty estimated
by the mixed effect model. In each bin, we compute, for each player, the mean
subjective difficulty. We thus have only one value by player in the bin, and eachFrom Objective to Subjective Difficulty 13
observation is thus independent from the others. Then, for each bin, we test the
null hypothesis that the bin’s median subjective difficulty’s is equal to the objec-
tive difficulty at the center of the bin’s interval. We use a Wilcoxon Signed Rank
Test and compute the 95% confidence interval (red bars) and pseudo median
(black dot and triangles), plotted in figure 5. We only show the pseudo median
and confidence intervals for bins with enough samples to run the Wilcoxon signed
rank test, and blue line represents our null hypothesis, where objective difficulty
equals subjective difficulty. Results allow us to safely reject the null hypothesis
for each median represented by an empty triangle in the plots, where Wilcoxon
signed rank test p-value is lower than 0.05.
Logical task Motor task Sensory task
All players
n̄ = 53.3 (σ=20.6) n̄ = 48.8 (σ=28.1) n̄ = 42.8 (σ=10.9)
Good players
n̄ = 20.8 (σ=6.51) n̄ = 15.8 (σ=4.44) n̄ = 5.46 (σ=1.39)
Medium players
n̄ = 19.8 (σ=5.73) n̄ = 36.2 (σ=16.7) n̄ = 23.7 (σ=6.57)
Bad players
n̄ = 17.5 (σ=6.93) n̄ = 7.57 (σ=2.3) n̄ = 13.9 (σ=5.12)
Fig. 5: Subjective and objective difficulty for all tasks and players. n̄ is the mean (sd)
number of players in each bin for each task and level.14 Constant et al.
There seems to be a strong hard effect for both logical and motor tasks.
For the sensory task, players seem to be slightly overconfident for all objective
difficulties. When split by levels, the effect seems stable for the motor task,
but the relatively low number of bad (n̄ = 7.57) and good players (n̄ = 15.8)
might lead to the non significance of the results. The same can be seen in the
sensory task where pseudo medians are always under the calibrated evaluation,
but results lose significance with the decrease of subjects number. However, for
the logical task, bins size are equivalent for the three conditions, but medium
players seem better calibrated. This result should be investigated further in a
specific experiment to provide more insightful results.
5.3 Influence of participants’ profiles on the subjective difficulty
We conduct several tests in order to analyze whether gender, gaming habits,
assessment of self efficacy and risk aversion have an impact on players’ levels
and difficulty estimation error. We take the random intercept of the objective
difficulty model as each player’s level.
Out of 80 participants 57 are males and 23 are females. 49 of them daily
play video games, and 12 weekly. 31 play board games monthly, and 36 almost
never. 58 are risk-averse, and for the 46 of the participants who answered the
self-efficacy questionnaire, 28 tend to see themselves as efficient players and all
esteem themselves as superior to a medium player.
First we tested gender influence on players’ levels and difficulty estimation
error with a Wilcoxon rank sum test. The null hypothesis is that both of them are
pulled from the same distribution for each gender. The test was only significant
for players’ level. Females players seem to be performing less on the motor game
(W = 255, p = 2.6e−5 ), with a difference in location of -0.67, and on the logical
game (W = 341, p < 0.01), with a difference in location of -0.82.
We tested how gaming habits, self efficacy and risk aversion impact on level
and difficulty estimation error using the Kendall’s rank based correlation test.
The test was only significant for the influence of risk aversion on players’ level,
for the sensory game (z = 3.3093, p < 0.001) with τ = 0.29 and for the logical
game (z = 3.2974, p < 0.001) with τ = 0.28, meaning that for both these games,
risk averse players tend to perform better. Thus, in our experiment, we did not
detect any impact of gender, playing habits, assessment of self efficacy and risk
aversion on difficulty estimation error, only on player’s actual performance.
6 Discussion
6.1 Influence of difficulty and hard effect
We observe that the players estimation of difficulty is always below the actual
objective difficulty, except for the logical and motor tasks on the easiest difficulty
levels. More precisely, motor and logical tasks show the existence of a strong hard
effect, namely, an overestimation of the players’ chances to success for the hard-
est levels of difficulty (figure 5). Contrarily to the cognitive psychology studiesFrom Objective to Subjective Difficulty 15
related to overconfidence, in addition to the hard effect, nothing seems to indi-
cate any easy effect, namely an underestimation of the chances of success for the
easiest tasks [48, 56].
The presence of a hard effect and absence of easy effect might be explained by
the players’ confidence towards the game designers: games are rarely impossible
to finish. What makes games different from many other tasks is that difficulty is
artificial created for entertainment, players know that given enough time, they
are almost always supposed to eventually win. This may drive us to be over
confident in their chances of success
Moreover, players’ overconfidence and hard effect may be stronger in our
games than in previous cognitive psychology studies because of player progres-
sion. Indeed, our games allow players to experiment, to learn from their failures
and, thus, to increase their performance. This feeling of progression and mas-
tery may help players to become more confident on their chances of success. In
cognitive psychology studies, where general culture questionnaires are very often
used, this might not be the case.
The player’s global confidence towards the game and their feeling of progres-
sion and mastery are also enhanced by the use of DDA algorithm. By presenting
the players challenges that are adapted to their current level, the game is neither
too boring nor too frustrating, allowing them to stay motivated and to believe
in the fairness of the game.
Also, during our experiment, it is to note that objective difficulty starts
below 0.5, and thus that players face more easy challenges at the beginning of
the game, when they do not know the game, than at the end. Previous studies
on the hard/easy effect relies on general culture questions and thus players may
be able to assess their knowledge and their chances to win from the very first
question. Thus, we may postulate that players assessment of easy challenges is
biased by their ignorance relative to the games’ procedures. However, the motor
task has an almost flat progression curve, and this task has no sign of an easy
effect. Also, for sensory and logical task, both have more easy challenges at the
beginning of the session, but for the logical task, we seem to be close to a small
easy effect, and for the sensory, it’s the opposite and player’s are overconfident for
easy challenges. There thus do not seem to have a clear impact of oversampling
easy challenges at the beginning of the session on easy effect.
We may explain the results’ differences between sensory against both the
logical and motor tasks by the nature of the subjective difficulty the players
have to assess. As defined in our method in section 4.3, the bet system focuses
on the players’ estimation of their performance, and this estimation is not always
performed in the exact same conditions. For the sensory game, the players can
select the squares before betting, making the play effort before interpreting their
chances of failure. Of course, they do not know about their actual performances,
but they go one step further toward the completion of the challenge than for
the two other games. Thus, they assess their chances of failure after having
realized the exercise, and thus may have a more accurate feeling of the quality
of their answer. For the two other games, they perform no manipulation and16 Constant et al.
have to guess all the next steps. This design choice for the sensory task was
made because we did not want to focus on memorization, but on the sensory
aspect of detecting blinking squares.
It is to note that our result are different from those of psychophysical studies
on subjective difficulty, where perceived difficulty seems to never reach a plateau
and have a more linear or exponential aspect. We think that this is mainly the
case because we ask player to predict the difficulty of a challenge, not to evaluate
it after many repetitions. We think that our approach, closer tho the cognitive
psychology approaches, may be closer to what a player really feels while playing.
Motor game is the task where the quality of our model is the lowest (R2 =
0.28). It is by far the fastest game to play, where participants can complete
quickly one turn after the other which may explain the higher objective difficulty
variability. However, such design is representative of action games. Slowing the
game’s pace may produce more stable results, but the experiment will be less
representative.
6.2 The player’s profile impact
We do not find any evidence of the influence of the players’ profile on their
estimation of difficulty. It seems to be contradictory to the studies about over-
confidence. Some aspects of the experiment may explain such results.
In a financial analysis field study, Barber & Odean [57] study overconfidence
in order to explain the difference of trading’s performance gender, concluding
that men have a tendency to be more overconfident and less risk averse than
women. We do not observe such behaviors, and we explain it mainly because our
experimentation’s protocol differ from Barber & Odean’s study. First, the median
age of our participants is 15 while their is 50. Then, their participants have a
certain degree of expertise about investment, whereas ours do not know the
content of the games before playing them. Moreover, we may postulate that our
tasks are very abstract and less prone to culturally induced gender differences.
Risk-aversion is also a determinant of an excessive confidence [57, 34]. How-
ever we do not find any influence of the risk on the difficulty estimation error.
Contrary to these studies, our participants’ age is quite young. Also, the ques-
tionnaire relies on mental calculus and probabilities and might be less efficient
on adolescents.
Stone [58] shows that initial and positive self-efficacy assessment may rein-
force the participants’ confidence and modify their performance, which is not
the case in our study. However, in Stone’s experiment, self-efficacy is assessed
with regard to the given task, i.e. participants are asked to estimate their per-
formance. In our study, we estimated self-efficacy using a general self efficacy
questionnaire [52, 53]. However, if we use players’ mean bet as a measure of self-
efficacy, there is a clear relationship between self-efficacy, i.e. how high the mean
bet is, and overconfidence, i.e. how high mean bet minus mean actual result is.
This is not surprising, as objective difficulty is adapted to 0.5 for each player.
Also, we do not find a link between mean bet and player performance.From Objective to Subjective Difficulty 17
6.3 Experiment’s limitations
There are some limitations relative to our approach, and in particular to the bet
system.
The bet system Our approach is based on the use of a bet system to
measure the players’ difficulty estimation error. First, this approach is limited to
specific tasks, where the interaction rhythm can be combined with a recurrent
question addressed to the player. Also, it is important to note that the bet
is not strictly related to the confidence, as measured in cognitive psychology
studies. For our games, the optimal strategy is to bet 7 when Dobjective > 0.5,
and 1 when Dobjective < 0.5. Thus, our evaluation might be less accurate than
confidence scales. Moreover, as we said in section 6.1, the bet system does not
allow us to clearly distinguish between effort-based and skill-based subjective
difficulties. New experiments can improve the separation between them.
Dynamic Difficulty Adjustment DDA is representative of how video
games are designed, and must have a notable impact on the hard / easy ef-
fect. Such an adjusted curve should allow players to be more confident in their
chances of success, and we should thus observe a weaker easy effect and a stronger
hard effect than in a pure random experiment. Our experiment shows than when
using DDA, players do develop a strong feeling of confidence in two of the three
tasks. Nevertheless, be able to point out DDA as responsible of this overconfi-
dence, we need and A/B experiment to compare our results to others based on
a random difficulty system.
Motivational influences The actual performance of a player is both de-
pendent on the task difficulty and on the players’ effort. If the player is not
motivated enough, he may correctly assess the difficulty but be less efficient
because he does not want to make the effort. Video games’ players experience
various states of emotion [59, 8], including sometimes boredom or anxiety. As
such, these emotions have to be taken into account in future experiment. We
also have to note that only sensory and motor tasks induce a near-miss effect,
while the players do not know if they were almost successful during the logical
task. The near-miss effect may convict the players that they were almost win-
ning, leading them to overestimate their chances of success for the next turn [39,
40].
7 Conclusion and Perspectives
In this paper, we investigate the players’ perception of difficulty. We extend
previous psychophysical and cognitive psychology studies by proposing a method
to evaluate objective difficulty and focusing on video games.
First, results demonstrate the efficiency of our objective difficulty estima-
tion. The mixed effect model allows us to easily take into account the difference
between players. Results show a predictive accuracy ranging from 61% for the
motor task, to almost 70% for the other tasks. Estimated objective difficulty is
coherent with DDA, showing a convergence of objective difficulty to 0.5, for all18 Constant et al.
groups and levels. We are also able to measure a learning effect, as a negative
effect of time on objective difficulty for a give difficulty parameter value. This
learning effect is coherent with the nature of the tasks, with a higher learning
effect for the logical task.
Then, results confirm the existence of an unrealistic evaluation of the players’
actual chances of failure. More specifically, players are always overconfident,
except for low level of difficulty in the motor and logical task. Results show a
strong hard effect for the motor and logical tasks, and no significant easy effect
for all tasks.
We postulate that players’ strong overconfidence might be explained by the
fact that our tasks are video games. First, players know that games are made to
be eventually beaten. Second, games allow players to get better and develop a
sense of progression and mastery. Even more, the use of DDA should reinforce
both of these experiment’s aspects.
The absence of a hard effect on the sensory task may be clarified by the
design of the sensory task itself, as the difficulty evaluation performed after
players actually tried to solve the problem, and thus, they may have a better
feeling of their performance.
New experiments will be conducted in order to improve our understanding
of difficulty perception in video games. We want to explore the use of a random
difficulty curve, to validate the impact of DDA on the hard / easy effect by com-
paring both experiments. Moreover, we plan to investigate the influence of the
previous turns on the players’ perception of difficulty. DDA creates a temporal
relationship between the difficulty of subsequent turns and thus prevented us to
realize the analysis on this experiment.
Then, we plan to verify the impact of feedbacks on the players’ assessment of
difficulty. Constant feedbacks about the decision process leads the participants to
re-evaluate their judgments during the task, reaching a more accurate level [60].
Continuous feedbacks about the user’s progression is a main feature of human
computer interaction and, in particular, video games. It implies to distinguish
between positive and negative feedbacks, or to test the influence of feedbacks’
accuracy. Video games adopts various types of feedback in order to affect the
players, to generate more uncertainty of the outcome and to improve enjoyment
[59, 49].
It is to note than from a game design perspective, the presence of a hard
effect has pro and cons. Hard effect is a good consequence of the game’s mo-
tivational mechanics : if the player believes in his chances of success, then he
may be motivated to play. However, having players believe that a challenge is
easier than it is, especially in high level of difficulty, may also lead players to
frustration because they will lose at challenges they thought they could win.
The motivational aspects of the discrepancies between subjective and objective
difficulty seems thus worthy of further investigation.
Finally, we plan to expand our approach with other measures of mental effort
like eye-tracking methods that have been used to assess cognitive load related to
computer interface [61], specially about memory and logical related tasks [62].From Objective to Subjective Difficulty 19
Acknowledgment
Authors would like to thank Daniel Andler, Jean Baratgin, Lauren Quiniou, and
Laurence Battais & Hélène Malcuit from Carrefour Numerique.
References
1. Juul, J.: The game, the player, the world: Looking for a heart of gameness. In
Raessens, J., ed.: Level Up: Digital Games Research Conference Proceedings. Vol-
ume 1. (2003) 30–45
2. Malone, T.W.: Heuristics for designing enjoyable user interfaces: Lessons from com-
puter games. Proceedings of the 1982 conference on Human factors in computing
systems (1982) 63–68
3. Lazzaro, N.: Why we play games: Four keys to more emotion without story. In:
Game Developers Conference. (March 2004)
4. Sweetser, P., Wyeth, P.: Gameflow: a model for evaluating player enjoyment in
games. Computers in Entertainment (CIE) 3(3) (2005) 3–3
5. Nakamura, J., Csikszentmihalyi, M.: The concept of flow. In: Flow and the foun-
dations of positive psychology. Springer (2014) 239–263
6. Allart, T., Levieux, G., Pierfitte, M., Guilloux, A., Natkin, S.: Difficulty influence
on motivation over time in video games using survival analysis. In: Foundation of
Digital Games. (2017)
7. Ryan, R.M., Rigby, C.S., Przybylski, A.: The motivational pull of video games: A
self-determination theory approach. Motivation and emotion 30(4) (2006) 344–360
8. Juul, J.: A Casual Revolution: Reinventing Video Games and Their Players. Mit
press edn., Cambridge, USA (2009)
9. Juul, J.: The Art of Failure. 1 edn. The MIT Press, Cambridge, USA (2013)
10. Hunicke, R.: The case for dynamic difficulty adjustment in games. In: Proceed-
ings of the 2005 ACM SIGCHI International Conference on Advances in computer
entertainment technology, ACM (2005) 429–433
11. Andrade, G., Ramalho, G., Santana, H., Corruble, V.: Extending reinforcement
learning to provide dynamic game balancing. In: Proceedings of the Workshop on
Reasoning, Representation, and Learning in Computer Games, 19th International
Joint Conference on Artificial Intelligence (IJCAI). (2005) 7–12
12. Vicencio-Moreira, R., Mandryk, R.L., Gutwin, C.: Now you can compete with
anyone: Balancing players of different skill levels in a first-person shooter game. In:
Proceedings of the 33rd Annual ACM Conference on Human Factors in Computing
Systems, ACM (2015) 2255–2264
13. Rani, P., Sarkar, N., Liu, C.: Maintaining optimal challenge in computer games
through real-time physiological feedback. In: Proceedings of the 11th international
conference on human computer interaction. Volume 58. (2005)
14. Afergan, D., Peck, E.M., Solovey, E.T., Jenkins, A., Hincks, S.W., Brown, E.T.,
Chang, R., Jacob, R.J.K.: Dynamic Difficulty Using Brain Metrics of Workload.
In Jones, M., Palanque, P., eds.: CHI ’14 Proceedings of the SIGCHI Conference
on Human Factors in Computing Systems, Toronto, Ontario, Canada, ACM New
York, NY, USA (2014) 3797–3806
15. Aponte, M.V., Levieux, G., Natkin, S.: Difficulty in Videogames: An Experimental
Validation of a Formal Definition. In Romão, T., ed.: Proceedings of the 8th
International Conference on Advances in Computer Entertainment Technology,
ACE 2011, Lisbon, Portugal, ACM New York, NY, USA (2011) 1–1820 Constant et al.
16. Passyn, K., Sujan, M.: Skill-based versus effort-based task difficulty: A task-
analysis approach to the role of specific emotions in motivating difficult actions.
Journal of Consumer Psychology 22(3) (2012) 461–468
17. Levieux, G.: Mesure de la difficulté dans les jeux vidéo. Thèse, Conservatoire
National des Arts et Métiers CNAM Paris (2011)
18. Hunicke, R., LeBlanc, M., Zubeck, R.: MDA: A Formal Approach to Game Design
and Game Research. In: Proceedings of the AAAI Workshop on Challenges in
Game AI, San Jose, CA, USA, AAAI Press (2004)
19. Delignières, D., Famose, J.: Perception de la difficulté et nature de la tâche. Science
et motricité 23 (1994) 39–47
20. Borg, G., Bratfisch, O., Dorni’c, S.: On the problems of perceived difficulty. Scan-
dinavian journal of psychology 12(1) (1971) 249–260
21. Slifkin, A.B., Grilli, S.M.: Aiming for the future: prospective action difficulty,
prescribed difficulty, and fitts law. Experimental Brain Research 174(4) (2006)
746–753
22. Delignières, D., Famose, J.P.: Perception de la difficulté, entropie et performance.
Science & sports 7(4) (1992) 245–252
23. Delignières, D., Famose, J.P., Genty, J.: Validation d’une échelle de catégories pour
la perception de la difficulté. Revue STAPS 34 (1994) 77–88
24. Delignières, D., Famose, J.P., Thépaut-Mathieu, C., Fleurance, P., et al.: A psy-
chophysical study of difficulty rating in rock climbing. International Journal of
Sport Psychology 24 (1993) 404–404
25. Delignières, D., Brisswalter, J., Legros, P.: Influence of physical exercise on choice
reaction time in sports experts: the mediating role of resource allocation. Journal
of Human Movement Studies 27(4) (1994) 173–188
26. Fitts, P.M.: The information capacity of the human motor system in controlling
the amplitude of movement. Journal of experimental psychology 47(6) (1954) 381
27. Kahneman, D., Frederick, S.: A model of heuristic judgment. In Holyoak, K.J.,
Morrison, R.G., eds.: The Cambridge Handbook of Thinking and Reasoning. 1
edn. Cambridge University Press, Cambridge, UK (2005) 267–293
28. Shah, A.K., Oppenheimer, D.M.: Heuristics made easy: an effort-reduction frame-
work. Psychological bulletin 134(2) (mar 2008) 207–22
29. Kahneman, D., Tversky, A.: Judgment under Uncertainty: Heuristics and Biases.
Science (New York, N.Y.) 185(4157) (sep 1974) 1124–31
30. Russo, J.E., Schoemaker, P.J.H.: Managing overconfidence. Sloan Management
Review 33(2) (1992) 7–17
31. Bessière, V.: Excès de confiance des dirigeants et décisions financières: une
synthèse. Finance Contrôle Stratégie 10 (2007) 39–66
32. Moore, D.A., Healy, P.J.: The Trouble with Overconfidence. Psychological review
115(2) (apr 2008) 502–17
33. Griffin, D., Tversky, A.: The weighing of evidence and the determinants of confi-
dence. Cognitive psychology 411435 (1992) 411–435
34. Johnson, D.D.P., Fowler, J.H.: The evolution of overconfidence. Nature 477(7364)
(sep 2011) 317–20
35. Bandura, A.: Self-efficacy: Toward a Unifying Theory of Behavioral Change. Psy-
chological Review 84(2) (1977) 191–215
36. Keren, G.: Facing uncertainty in the game of bridge: A calibration study. Organi-
zational Behavior and Human Decision Processes 39(1) (feb 1987) 98–114
37. Linnet, J., Gebauer, L., Shaffer, H., Mouridsen, K., Møller, A.: Experienced poker
players differ from inexperienced poker players in estimation bias and decision bias.
Journal of Gambling Issues (24) (2010) 86–100You can also read