Frontier currency Eurobonds and the TCX Frontier Index July
←
→
Page content transcription
If your browser does not render page correctly, please read the page content below
Frontier currency Eurobonds
  and the TCX Frontier Index
                 July | 2021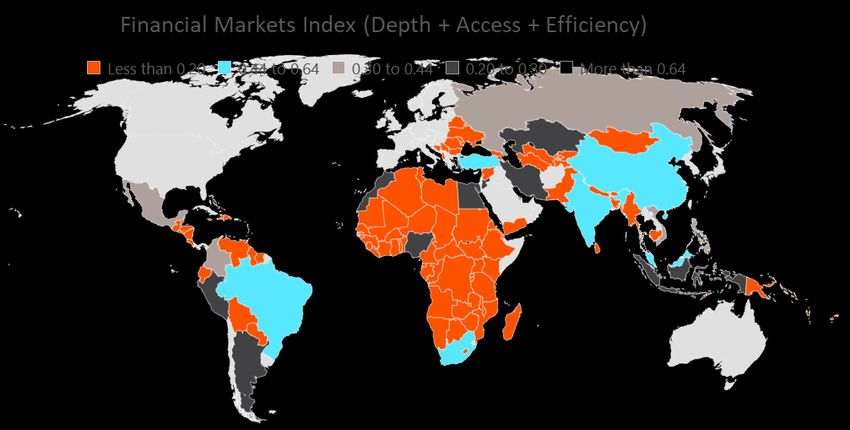
July 2021
Frontier currency Eurobonds and the TCX Frontier Index
Sustainable market creation
o Frontier-currency-denominated debt is gaining traction among investors.
o Frontier-currency-linked Eurobonds offer an accessible road to frontier exposure
o A frontier-currencies bond portfolio outperforms an EM similar portfolio in risk/return
and diversification terms
o TCX has launched a frontier currency bond index, the TCX FI1, to support markets’ growth
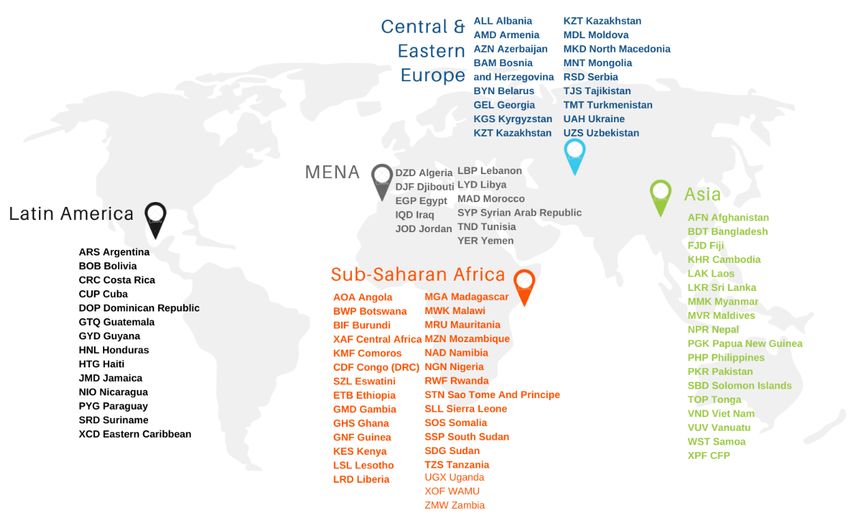
What’s in a name – what is a frontier market?
A precise, universal definition of a ‘frontier’ market does not exist. In TCX’s view, it includes about 114
countries with over 100 currencies, with widely varying degrees of financial development, market
accessibility, and liquidity conditions, but some common characteristics:
• High economic growth rates
• Low diversification, undiversified sources of income (e.g., commodities, remittances, tourism)
• Low social development indicators, and young and increasingly educated populations
• Underdeveloped financial markets, greater political and regulatory risk, and weak institutions2
These ‘frontier’ countries account for over 30% of the global population and 10% of global GDP3.
Figure 1. Frontier Markets Currencies (TCX, 2021)
1 Supported by KfW on behalf of the German Federal Ministry for Economic Cooperation and Development, (BMZ).
2 Aberdeen Standard, January 2020, Frontier markets – mainstream opportunity?
3 Aberdeen Standard, June 2018, The evolution of frontier markets
2July 2021
Frontier fixed income: A taxonomy
Frontier local currency fixed income is less familiar to investors as an investable asset class than frontier
equity or hard currency-denominated fixed income. One root cause for this lack of popularity may
be high illiquidity and risk; another - and we will address that in this article - can be the absence of
specific indices for frontier fixed income.
In terms of size, frontier equity is smaller than fixed income;
Figure 2. Frontier asset classes’ size, USD
estimates of equity market cap are USD510Bn 4 , vs.
Bn USD2.5Tn of bonds from frontier markets’ issuers or linked to
5
frontier currencies. Total hard currency-denominated debt
is estimated to be around USD1.2Tn, vs. USD1.3Tn of bonds
denominated or linked to local currencies.
As of February 2021, three of the major index providers 6
were publishing frontier equity markets indices (less than 1%
of the world’s indices), while only one provider was tracking
hard-currency-denominated frontier bonds. An index
tracking global frontier local currency debt did not exist.
Frontier fixed income securities greatly differ in terms of performance and investor base, depending
on their denomination currency and the markets where they trade.
Hard-currency-denominated debt from frontier issuers has been around for several decades; it trades
similarly to emerging-market Euro-clearable debt and it is mostly subject to the same global risk,
liquidity, and volatility dynamics. It has an estimated market capitalization of USD1.2Tn.
The most widely used index for frontier hard-currency-denominated debt is the J.P. Morgan NEXGEM,
tracking sovereign and quasi-sovereign from 35 countries. The index’s market cap has grown to
represent up to 25% of the broader emerging markets’ EMBI index from 5% ten years ago. It is important
to note, though, that most dedicated frontier investors are active investors, and use the NEXGEM to
benchmark their performance against, not to passively replicate the index.
Local-currency debt denominated in or linked to frontier currencies has a market capitalization of around
USD 1.3Tn7 and significantly lower foreign investor participation (7 to 20%8%). This debt is composed
mostly of government bonds and held predominantly by local institutional investors, particularly local
banks. Here, risks are more idiosyncratic, with local macroeconomic and political variables having a
stronger return impact. Interest in local debt has grown, because of its perceived attractive risk/return
profile. Local currency debt is characterized by high yields – in response to perceived structural
weaknesses –, however, still low historical default rates.
While the local investor base has deepened, foreign investors remain underinvested in most local
frontier bond markets, outside of the most developed countries (“quasi-emerging”) 9 , perhaps
because they face practical challenges and ‘friction costs’. Foreign Investors in local debt markets
face convertibility and transfer risks, but also need to open local custody and bank accounts and
understand diverging legal, tax, and capital control frameworks. Moreover, price information is
typically opaque and uneven.
4 Bloomberg, July 2020, What Are Frontier Markets And Why Invest in Them?
5 Bloomberg, TCX, May 2021, ex-ARS domiciled issuers and ARS denominated bonds. Incl. ARS total is 3.2Tn.
6 MSCI, FTSE Russell and S&P Dow Jones
7 Bloomberg, TCX, May 2021, ex-ARS domiciled issuers and ARS denominated/inked bonds.
8 International Monetary Fund. 2020. The Evolution of Public Debt Vulnerabilities in Lower Income Economies.
9 Range of 20-30% for Ghana, Zambia, Egypt, Nigeria, Pakistan, Ukraine, Serbia, as per IMF, 2020. Ibid, p.61. The
African Development Bank estimates participation rates of 40% and 60% for Egypt and Ghana, respectively.
3July 2021
Figure 3. Frontier Markets Debt Taxonomy10
As of February 2021, an index tracking debt denominated in frontier local currencies or linked to them did not exist.
Thus, most dedicated funds used EM local-debt indices 11 as a proxy for risk guidance or return
benchmarking purposes. The then-existing global EM local-currency debt indexes only included seven
countries currently considered frontier by country classification of the main index providers 12 :
Bangladesh, Kenya, Morocco, Nigeria, Pakistan, Sri Lanka, and Vietnam.
The rationale for TCX to develop a frontier local-currency debt index
TCX, The Currency Exchange Fund, N.V., is a multilateral 13 effort to improve the resilience of cross-
border debt flows. It is mandated to support the development of local markets and provide solutions
to cross-border flows whenever markets for hedging products are thin or inexistent. TCX follows four
key operating principles: reliability, market-reflective pricing, no speculation, and additionality. The
latter means that TCX is only present in those currencies where markets do not offer a viable
commercial solution by themselves.
TCX has developed an indicative index of frontier local-currency-denominated debt, as part of its
market development mandate. The instruments included on this index, launched on March 31, 2021,
are offshore bonds issued by development finance institutions and co-structured (hedged) by TCX,
denominated, or linked to the performance of frontier local currencies, settled in dollars or euros.
10 Excludes Argentina domiciled issuers and ARS denominated/linked bonds
11 At least six major providers publish EM local currency debt indices: J.P. Morgan’s GBI-EM fares highest in AUM.
12 MSCI and FTSE country classification methodologies, as of Nov 2020. Costa Rica, Dominican Republic, and
Egypt are included in the major global EM local indices but are not included on the country classifications.
13 TCX’s Investors include multilateral and bilateral development finance institutions (DFIs) and specialized
Microfinance Investment Vehicles (MIVs), which address the UN’s Sustainable Development Goals (SDGs).
4July 2021
The indicative index aims to offer information on local currency frontier fixed income as an asset class,
thus, increasing price transparency. TCX will contribute to raising investor awareness about frontier
markets through this visibility of the price dynamics. Awareness should foster supply and demand
growth, ultimately supporting local currency market development.
Moreover, developing local markets may contribute to alleviating the impact of a future crisis. Looking
at the World Bank’s Financial Market’s Index, frontier economies' development levels are at almost
half of those for emerging countries14. IMF’s analysis of COVID-19 market turbulence15 suggests that
frontier economies with a larger participation of speculative portfolio flows (e.g., Nigeria, Egypt)
suffered higher yield volatility and foreign exchange rate pressure during episodes of market
turbulence. Through the index publication, TCX aims to foster local markets’ depth and overall
financial development, helping them to attract more buy-and-hold foreign investors.
This initiative was made possible by the support of KfW on behalf of the German Federal Ministry for
Economic Cooperation and Development (BMZ).
From the investor perspective, several studies have explored the behavior of a foreign-exchange
portfolio of local currencies from the frontier and emerging markets in terms of returns and asset
diversification.
ICBC Standard Bank released a paper in July 2018 detailing the conclusions16 of analyzing a portfolio
of short-term FX forwards in 22 currencies from frontier markets for 12 years. That portfolio surpassed EM
and DM portfolios in alpha-generation terms: it generated a higher carry and presented lower
volatility, even at tail risks, had a lower beta and lower own-sample cross-correlations. Nevertheless,
an investor looking to replicate this portfolio would find that some of the securities are not accessible
or would present high ‘friction costs’ from entry and maintenance. Convertibility and transfer risks were
also not taken into account.
Why there was not already an index for frontier local currency bonds? TCX interviewed several major index
providers on this. The conclusion is they do not generate it due to a) lack of assets widely available to
investors, b) absence of price information, and c) not enough investor demand to justify it from a
commercial standpoint. Ironically, when asking investors, some of them stated that they would explore
frontier FX and fixed income assets if price information and an index were available. Interest in a
regional African effort led by the African Development Bank 17 further confirms the latter.
TCX thus took the next step and performed a feasibility study for an index in 2019, examining the
performance of a portfolio of short-term money-market local instruments denominated in 71 frontier
currencies during a 5, 10, and 15-year period. The results confirmed earlier findings of consistent
positive carry generation and lower volatility relative to EM and DM on a portfolio basis, as well as high
diversification vs. other asset classes and low intra-portfolio correlation.
However, this again was just a theoretical result because the rates used came from illiquid money-
market instruments and local bank deposits. Many of these instruments are not investable, or, at best,
require a huge risk-management effort to deal with the individual regulation, tax, custody, liquidity,
capital controls, and convertibility issues per currency.
14 World Bank, 2019. Global Financial Development Report: Bank Regulation and Supervision a Decade after the
Global Financial Crisis. Washington, D.C. See Appendix for details.
15 International Monetary Fund, 2020. Global Financial Stability Report: Markets in the Time of COVID-19.
Washington, DC, April.
16 ICBC Standard, July 2018, Frontier FX: Portfolio and Return Characteristics.
17 AFMI Bloomberg African Bond Family of Indices
5July 2021
The TCX FI index and frontier currency-linked Eurobonds
Here is where a new asset class comes into play. Offshore synthetic local currency bonds in frontier
currencies have increasingly found demand from investors. The asset class is rapidly growing, totaling
USD24Bn to May 2021 across 43 currencies.
Some of the largest International Financial Institutions have issued offshore synthetic local currency
bonds to fund SGD-related initiatives in frontier countries. The bonds, linked to frontier currencies, are
settled in hard currency, allowing investors an accessible road to frontier exposure, with minimal credit
risk and no convertibility nor transfer risk. DFIs have issued USD6.1Bn of bonds across 40 countries from
2006 to May 2021.
TCX has visibility of the price information for a portion of the bonds, as it has participated as a hedging
provider for some of its shareholders issuing them. With this, TCX structured an informational index
composed of a portfolio of the bonds, the TCX FI. The pricing source is the internal valuation data for these
offshore bonds where TCX acted as a hedge provider (thus, not independent).
Concerning country selection, TCX, following the additionality principle, from 106 currencies included
in the DAC list of ODA recipients, those not included in two out of three major local currency debt
indices are eligible for the index. The current final universe is based on the bonds where TCX has acted
as a hedging counterparty for the bond’s issuer.
As of June 2021, this index covered 78 bonds in 19 currencies. Bonds’ cash flows are immediately
reinvested across outstanding securities. The index is rebalanced, based on market value weights,
daily. The average coupon for the bonds was 9.05%, for a 2.8-year average tenor. The index covers a
broad portfolio, without regional nor country caps.
Looking at the portfolio since January 2018 shows the outperformance of the frontier bonds index in
return/volatility terms vs. a comparable EM local bond index 18. Interestingly, during the risk sell-off of
early 2020 originated by COVID-19, the frontier index also outperformed the comparable EM index in
both return and volatility terms. Between February and September, it exhibited better performance,
with rolling 10- and 60-day max drawdowns of less than a half of those shown by the EM comparable.
The frontier index also recovered faster than the EM index, reaching 2019 average levels seven weeks
after April 1st, 2020 lows. One potential explanation for this is the relative isolation of frontier currency
bonds from global flows and risk appetite/aversion dynamics present in EM.
Graph 2. Comparative performance of Frontier Local Currency Bond Index, 2018 – Jun 2021
120
115
110
105
100
95
90
85
80
TCX FI EM Local Bond Index
18Comparable EM local bond index: J.P. Morgan Government Bond Index Emerging Markets Global Core
(GBIEMCOR), rebased to Jan 2018 = 100
6July 2021
Table 1. Index Relative Performance19
Since Inception Last 12 Months COVID-19 Disruption
(Jan 18 – Jun 21) (Jun 20 – Jun 21) Feb 1 – Sep 1, 2020
Frontier LCY EM LCY20 Frontier LCY EM LCY Frontier LCY EM LCY
Return for the period (%) 13.70% 1.93% 7.54% 6.63% -2.14% -3.18%
Annualized daily volatility 5.22% 8.84% 3.53% 7.29% 9.12% 14.43%
Ann. avg
2.32% -0.55% 7.50% 6.97% -2.20% -5.04%
daily excess Return
Sharpe ratio 0.44 -0.06 2.13 0.96 -0.24 -0.35
10-day Max drawdown -7.47% -17.09% -1.31% -4.60% -7.47% -17.09%
60-day Max drawdown -9.61% -20.58% -1.04% -7.94% -9.61% -20.58%
When looking at the correlations vs. other assets, the index showcases the potential value that frontier
local currency debt offers for diversification, especially versus US Equities, US Treasuries, and
Commodities, as can be seen in Table 2 below.
Table 2. Cross Asset Correlations, 2yrs21
Frontier LCY Commo-
EM HCY Debt EM LCY Debt US HY Debt 3y UST S&P 500
Debt dities
EM HCY Debt 0.49 1.00
EM LCY Debt 0.41 0.82 1.00
US HY Debt 0.35 0.91 0.72 1.00
3y UST 0.35 0.34 0.29 0.49 1.00
S&P 500 0.10 0.62 0.56 0.78 0.38 1.00
Commodities 0.34 0.58 0.59 0.69 0.53 0.65 1.00
Metrics: EM HCY Debt (JPM EMBI Global), EM LCY Debt (J.P. Morgan GBI-EM Global Core), US HY Debt (S&P U.S.
High Yield Corporate Bond Index), US Treasuries (US Generic Govt 3yr), S&P 500 Index (SPX) and Commodities
(Bloomberg Commodity Index Total Return)
19 As of June 30, 2021
20 J.P. Morgan Government Bond Index Emerging Markets Global Core (GBIEMCOR), rebased to Jan 2018 = 100
21 As of May 31, 2021
7July 2021
Art of the Possible: the first frontier currency debt index
TCX has launched this informative index, the TCX FI. The rationale for doing so is to increase investor
awareness around frontier assets available, contribute to price transparency, foster through financial
innovation the development of local markets, and increase local currency usage for financing and
hedging.
In this process, there is a wide number of options for TCX to explore. A flagship index and a family of
informative regional, thematic, and tailor-made indices is a logical and probable route. Including
bonds where TCX has not been involved as a hedging provider could be another extension. TCX is
interested to analyze potential collaborations with commercial partners. The index could trigger the surge of exciting
new investment, financing, and hedging solutions that support the development of frontier local markets.
As with any other initiative, there are several practical challenges to surmount. Liquidity, currency and
regional concentration, instrument size, and pricing issues will need to be managed. However, the
advantages that the asset class presents outnumber these limitations; frontier markets offer a unique
combination of attractive risk/return profile, high growth potential, and superior diversification properties, along with
a positive contribution to stable development and poverty alleviation.
On the demand side, the combination of low-interest rates and unprecedented liquidity conditions
due to central banks’ stimuli responses have exacerbated the hunt of investors for yield and alpha
generation outside traditional markets. In addition, more and more financial institutions look for ways
to generate positive impact; ESG-related initiatives and instruments reflect this appetite. Finance
institutions are increasingly aware of their responsibility to act as agents of change. Investing in a bond
issued by a Development Finance Institutions ensures the proceeds are used in an ESG compliant way.
Frontier currency debt is evolving to become an active, vibrant asset class. Frontier capital markets
becoming mainstream will be key for local markets development, and ultimately, for currency
financing in developing countries to become as standard as it is in developed markets today.
8July 2021
Appendix
Graph 3. TCX FI Currency Distribution, as of June 2021
Graph 4. TCX LCY Bond Program, as of June 2021
9July 2021
Graph 5 and 6. Financial Development and Financial Markets Index, IMF (2019)22
22World Bank, 2019. Global Financial Development Report: Bank Regulation and Supervision a Decade after the
Global Financial Crisis. Washington, D.C
10July 2021
The Currency Exchange Fund N.V. (“TCX” or “the Fund”) is an Alternative Investment Fund within the meaning of
article 4:1 of the European Alternative Investment Fund Managers Directive. It is based in Amsterdam, The
Netherlands, and is open to Professional Investors only.
TCX’s fund manager is TCX Investment Management Company B.V. (“TIM”), a company based in Amsterdam, The
Netherlands, that is licensed as an Alternative Investment Fund Manager by the Financial Markets Authority of The
Netherlands.
TIM has passports in place to market the Fund in certain EU countries only. The marketing of the Fund outside the
EU may also be restricted by law. TIM is dedicated to complying at all times with all applicable rules. Accordingly,
please note that no communications from TIM may be construed as an offer or invitation to invest in the Fund in
any form in any jurisdiction where TIM has not yet taken steps to comply with the prevailing laws and regulations
on the marketing of funds.
Performance Disclaimer
This document lists an informative calculation ("the index”, or the “TCX FI”) based on the outstanding note issuances
that TCX Investment Management, Company B.V. ("TCX" or "The Fund”) has hedged on behalf of (some of) its
shareholders. The data shown is calculated through a proxy for the 'dirty price' for the notes, which is obtained
from the mark-to-market ("MTM") of the Local Currency Leg of the corresponding hedges and the notes notional
amount. The MTM is calculated based on regularly updated internal valuation curves. Other information comes
from either TCX's back office or is publicly available on Bloomberg or other sources. This document, including all its
content, is provided for informational purposes only. Unless otherwise explicitly stated, all content reflects the
opinion of TCX and has been researched and expressed to the best of its knowledge and belief. Though TCX
believes these figures to be reliable and accurate, it does not guarantee their completeness or accuracy. TCX
does not accept any liability for claims related to acts of any party based on the information provided.
Additionally, the information enclosed does not constitute an offer, or a solicitation of an offer, to conclude any
transaction at the prices noted. The prices are prepared as of a particular date and time as stated and do not
always reflect the latest changes. Past performance of an informative index is not an indication or guarantee of
future results.
General Disclaimer
It is not possible to invest directly in an index. Exposure to an asset class represented by an index may be available
through investable instruments based on that index. TCX Investment Management, B.V. does not sponsor, endorse,
sell, promote, or manage any investment fund or other investment vehicle that is offered by third parties and that
seeks to provide an investment return based on the performance of any index. TCX Investment Management, B.V.
makes no representation nor assurance that investment products based on an index will accurately track index
performance or provide positive investment returns. TCX Investment Management, B.V. is not an investment
advisor, and TCX Investment Management, B.V. makes no representation regarding the advisability of investing in
any such investment fund or other investment vehicle. A decision to invest in any such investment fund or other
investment vehicle should not be made in reliance on any of the statements set forth in this document. Prospective
investors are advised to make an investment in any such fund or other vehicle only after carefully considering the
risks associated with investing in such funds, as detailed in an offering memorandum or similar document that is
prepared by or on behalf of the issuer of the investment fund or other investment product or vehicle. TCX
Investment Management, B.V. is not a tax advisor. A tax advisor should be consulted to evaluate the impact of
any tax-exempt securities on portfolios and the tax consequences of making any particular investment decision.
Inclusion of a security within an index is not a recommendation by TCX Investment Management, B.V. to buy, sell,
or hold such security, nor is it considered to be investment advice. “TCX FI” is a registered trademark of TCX
Investment Management, B.V. All trademarks, trade names, and other product and service names and logos on
this document, whether registered or unregistered, are the property of their respective owners and protected by
applicable laws.
Recommended citation
TCX, The Currency Exchange Fund. 2021. Frontier currency Eurobonds and the TCX Frontier Index: Sustainable
market creation. Amsterdam, The Netherlands, July.
11You can also read