FULL YEAR RESULTS TO 31 DECEMBER 2015 - Scentre Group
←
→
Page content transcription
If your browser does not render page correctly, please read the page content below
FULL YEAR RESULTS

TO 31 DECEMBER 2015

Scentre Group Limited ABN 66 001 671 496
All amounts in Australian dollars unless otherwise specified

The financial information included in this release is based on the Scentre Group’s
IFRS financial statements. Non IFRS financial information included in this release
has not been audited or reviewed.
This release contains forward-looking statements, including statements
regarding future earnings and distributions that are based on information and
assumptions available to us as of the date of this presentation. Actual results,
performance or achievements could be significantly different from those
expressed in, or implied by, these forward-looking statements. These forward-
looking statements are not guarantees or predictions of future performance, and
involve known and unknown risks, uncertainties and other factors, many of
which are beyond our control, and which may cause actual results to differ
materially from those expressed in the statements contained in this release. You
should not place undue reliance on these forward-looking statements.
Except as required by law or regulation (including the ASX Listing Rules) we
undertake no obligation to update these forward-looking statements.
STRATEGY
Scentre Group’s strategy is to create extraordinary Since the establishment of Scentre Group:
places connecting and enriching communities by
owning, managing and developing the best retail assets Asset Management - disposition of seven assets in Australia
and New Zealand; introduction of joint venture partner into
in Australia and New Zealand
five assets in New Zealand; resulting in further improvement
in operating metrics of the pre-eminent portfolio of shopping
Asset Management centres in Australia and New Zealand
Own the highest quality shopping centres and focus on Developments - the Group has commenced projects of
maximising the operating performance of centres via ongoing $1.3bn, and has completed developments at Garden City,
portfolio review and development of long term asset plans Miranda, Hurstville, Kotara, Chatswood and North Lakes
Developments (Stage 1) achieving IRRs of at least 15%.
Future development pipeline in excess of $3bn
Invest in the Group’s centres at attractive total returns to ensure
the assets continue to represent extraordinary retail spaces for Capital Management - at 31 December 2015: gearing of
retailers and shoppers 33.3% within target range of 30-35%; liquidity at $3.7bn;
Capital Management credit rating A1 (Stable) from Moody’s and A (Stable) from
Standard and Poors; weighted average debt maturity 5.6
Focus on optimising cost of capital and maintaining years; interest cover 3.5 times
conservatively positioned funding and liquidity
Retailer and Shopper Initiatives Retailer and Shopper initiatives - recently-opened
developments featured new experiential precincts and
Focus on the integration of food, fashion, leisure and offerings for shoppers. In-house digital advertising network
entertainment experiences in each of its shopping centres to successfully launched with 1,200 SmartScreens providing
curate a retail environment that connects shoppers with our retail and brand partners with a sophisticated promotional
retail partners, goods and services that will resonate with the channel for brands and offers
local community
Scentre Group - Full Year Results 2015 // Page 2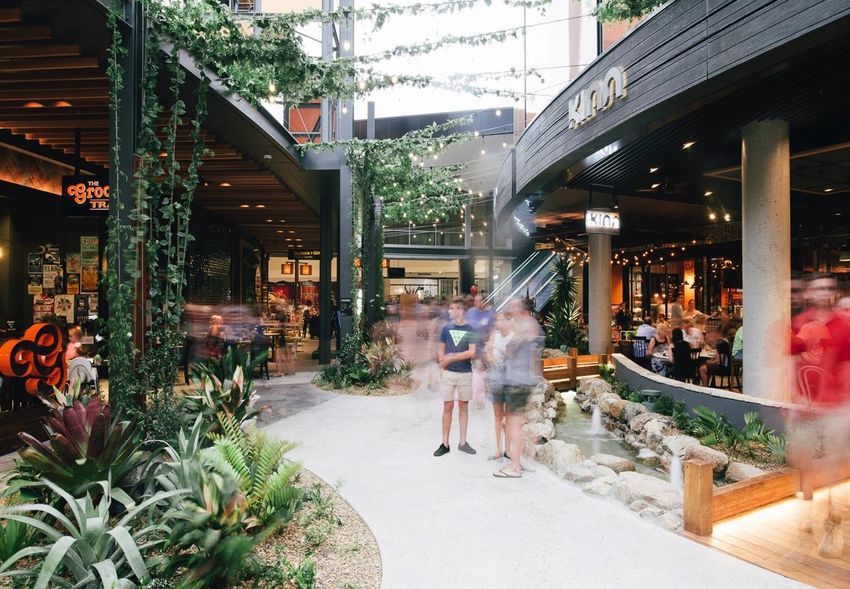
HIGHLIGHTS
Key highlights for 2015 include: Overview 12 months to 31 December 2015
Assets Under Management 1 $42.1bn
Earnings – FFO of $1.199bn or 22.58 cents per security, Profit $2,708m
representing growth of 3.8%, above previous market guidance Funds from Operations (FFO) $1,199m
of 3.5%.
FFO per security 22.58 cents
• Strong underlying operating performance has more than
Distribution per security 20.90 cents
offset the FFO earnings impact of asset sales
• Excluding the impact of transactions, underlying FFO Return on Contributed Equity 4 11.4%
Comparable NOI Growth 2 2.6%
increased by approximately 5%
Gearing 3 33.3%
Comparable NOI Growth of 2.6% above forecast range of 2.0 –
2.5% Outlook 2016 Full Year Forecast
Funds from Operations Approximately 3% growth
Commenced $830m (SCG share $583m) of developments in Distribution per security 21.3 cents
2015 with four openings at Chatswood, Hurstville, Kotara and 2% growth
North Lakes all trading well. In 2016 has already commenced Comparable NOI growth 2.5 – 3.0%
$495m (SCG share $425m) of developments at Chermside and
North Lakes Stage 2
1. Assets under management at year end is pro forma post sale of 2 New Zealand assets
Shopping centre valuations were $1.5bn higher, reflecting 2. Comparable NOI growth for the 12 months to December 2015 is pro forma post sale of four
Australian assets and three New Zealand assets
growth in shopping centre NOI, increase in value post 3. Pro forma post sale of two New Zealand assets, gearing would be 32.3%
completion of developments and capitalisation rates firming by 4. FFO/Contributed Equity
38bp to 5.57%
2016 FFO forecast to increase by approximately 3% with
distribution forecast to increase by 2% to 21.3 cents per
security. Underlying earnings increase approximately 5% if
full year impact of asset sales taken into account
Full Year Results 2015 // Page 3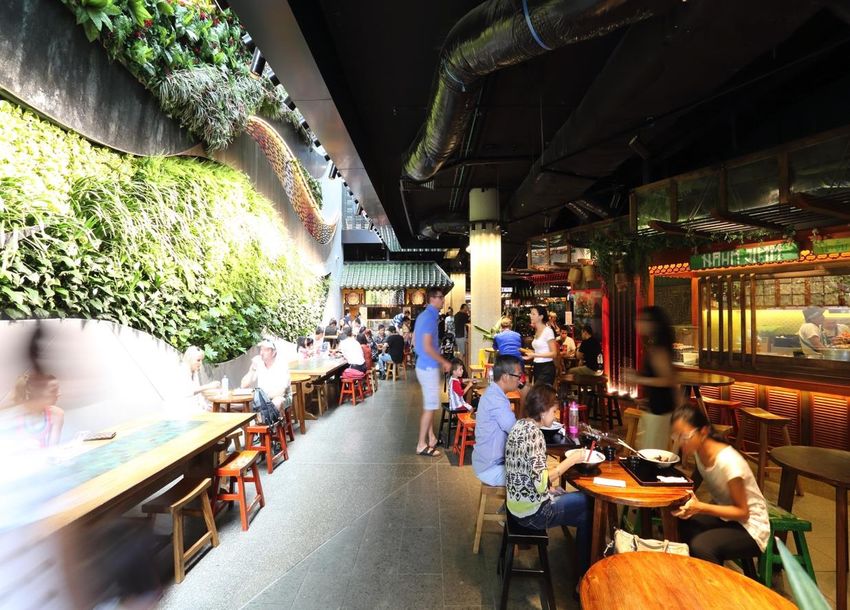
FUNDS FROM
OPERATIONS   FUNDS FROM OPERATIONS
             $m                                                12 months to
                                                          31 December 2015
             Net Property Income
             - Australia                                             1,668
             - New Zealand                                             156
             Total Net Property Income                               1,824
             Management income                                          46
             Project income                                             85
             Gross income                                            1,955
             Overheads                                                (91)
             EBIT                                                    1,864
             Net interest                                            (499)
             Earnings before Tax                                     1,365
             Tax                                                      (72)
             Minority interest                                        (94)
             Funds from Operations                                   1,199

             DISTRIBUTION
             $m                                                12 months to
                                                          31 December 2015

             Funds from Operations                                   1,199
             Retained earnings                                        (89)
             Distribution                                            1,110

             Number of securities (million)                        5,311.6

             Funds from Operations per Security (cents)              22.58

             Distribution per Security (cents)                       20.90

                                                                              Full Year Results 2015 // Page 4
BALANCE
SHEET
          BALANCE SHEET - PROPORTIONATE
          $m                                                    31 December 2015    31 December 2014
          Cash                                                               153                 190
          Property investments

          - Shopping centres                                              29,513              28,920

          - Development projects and construction in progress                565                 374

          Total Property investments                                      30,078              29,294

          Assets held for sale                                               417               1,005

          Deferred tax assets                                                 83                  98

          Other assets                                                     1,217                 833

          Total assets                                                    31,948              31,420

          Interest bearing liabilities

          - Current                                                        1,713                 579

          - Non-current                                                    9,391              11,316

          Finance lease liabilities                                           54                  57

          Deferred tax liabilities                                           236                 314

          Other liabilities                                                1,492               1,316

          Total liabilities                                               12,886              13,582

          Net Assets                                                      19,062              17,838

          Minority interest                                               (1,422)             (1,667)

          Net Assets attributable to Scentre Group                        17,640              16,171

                                                                                                        Full Year Results 2015 // Page 5
OUR OPERATIONS
As at 31 December 2015 1 Australia New Zealand Total 2
Centres 34 6 40
Number of Retail Outlets 10,693 977 11,670
Gross Lettable Area (m sqm) 3.3 0.3 3.6
SCG Interest (bn) 3 $28.9 NZ$1.3 $30.1
JV Partner Interests (bn) 3 $11.0 NZ$1.1 $12.0
Assets Under Management (bn) 3 $39.9 NZ$2.4 $42.1
Weighted Average Capitalisation Rate 5.51% 6.98% 5.57%
The portfolio remained in excess of 99.5% leased
2.6% Comparable NOI Growth for the 12 months
to 31 December
Comparable Specialty Retail Sales Growth of 5.3%
in Australia to $10,826 psm, and 6.6% in New
Zealand to NZ$12,117 psm
17.8% Specialty Store Occupancy Cost
1. Pro forma post sale of two New Zealand assets
2. Period end exchange rate AUD/NZD 1.0665
3. Includes construction in progress and assets held for development
Full Year Results 2015 // Page 6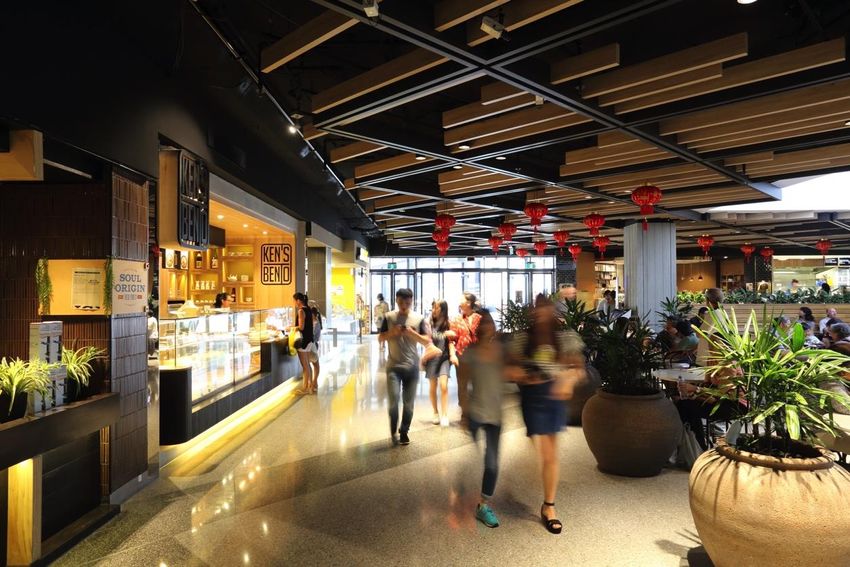
COMPARABLE RETAIL SALES GROWTH

Pro forma post sale of four Australian assets and three New Zealand assets

                                                                             Full Year Results 2015 // Page 7
COMPARABLE RETAIL SALES GROWTH

Pro forma post sale of four Australian assets and three New Zealand assets
Total stable portfolio including mini majors and specialties

                                                                             Full Year Results 2015 // Page 8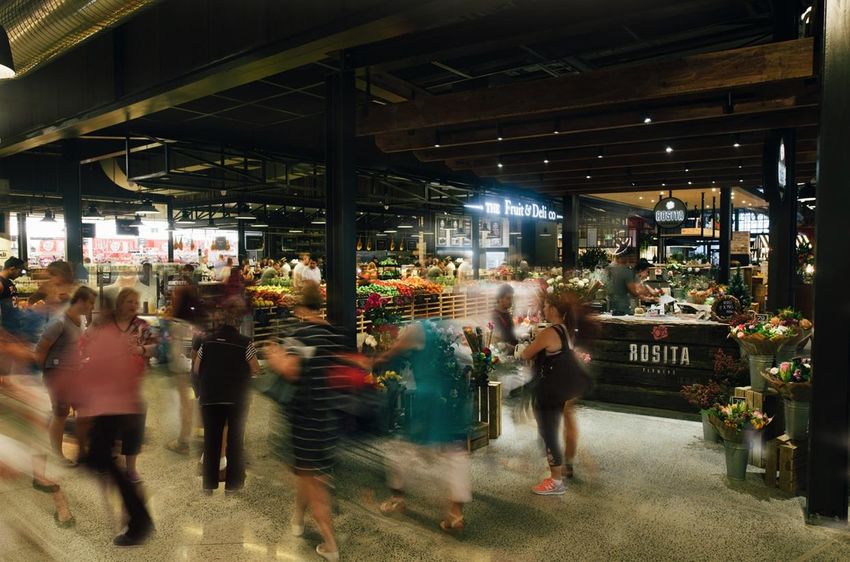
OPERATING PERFORMANCE

 12 months to 31 December 2015                                                Australia   New Zealand             Total
 Moving Annual Turnover (incl. GST) bn                                           $20.6        NZ$1.9             $22.3
 Specialty Store Retail Sales (incl. GST) (psm)                               $10,826      NZ$12,117         $10,867
 Specialty Store Rent (psm)                                                    $1,606       NZ$1,289           $1,569
 Comparable NOI growth                                                            2.7%          0.9%              2.6%
 Portfolio Leased                                                                                             >99.5%
 Specialty Store Occupancy Cost                                                                                 17.8%
 Lease Deals Completed Number                                                                                    2,432
 Lease Deals Completed Area (sqm)                                                                            341,773

 Pro forma post sale of four Australian assets and three New Zealand assets

                                                                                                        Full Year Results 2015 // Page 9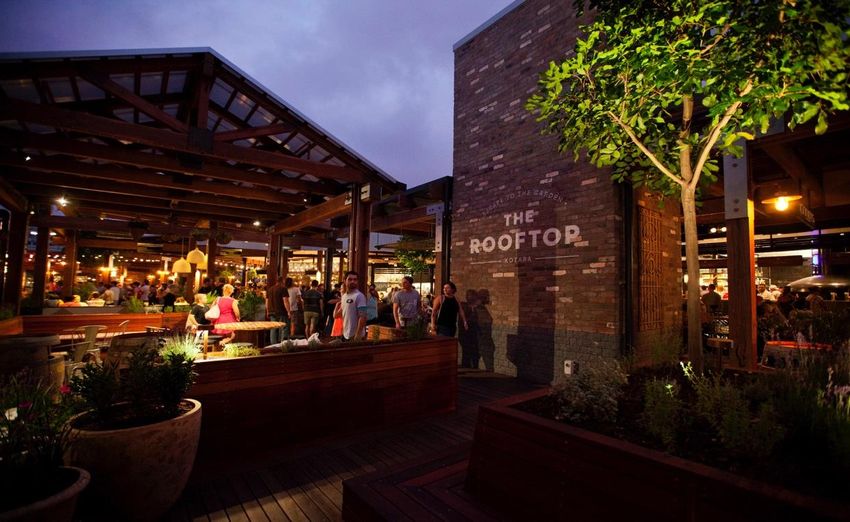
PROJECT DETAILS                                         ACTIVE PROJECTS              Total     SCG Share   Project Yield        Anticipated
                                                                                   Project                       Range          Completion
                                                                                       $m            $m
                                                        Scentre Group
                                                        2016 Starts
                                                        Chermside                    355            355                                2017
                                                        North Lakes – Stage 2        140             70                                2016
                                                                                     495            425
                                                        2015 Starts
                                                        Warringah Mall               310            155                                2016
                                                        Casey Central                155            155                                2016
                                                                                     465            310

                                                                                     960            735     7.0 - 7.5%
                                                        Third Party
                                                        Pacific Fair                 670               -                               2016
                                                        Total                       1,630           735

              -   Commenced $830m of developments during 2015 (SCG share: $583m)
              -   Completed developments at Hurstville, Chatswood, Kotara, North Lakes and Miranda during 2015
              -   2016 commenced developments at Chermside and North Lakes with a combined value of $495m (SCG share: $425m)

        FUTURE PIPELINE

        The Group is undertaking pre-development activity on future development opportunities in excess of $3bn.

        Albany (NZ)               Knox (VIC)                      St Lukes (NZ)
        Carousel (WA)             Marion (SA)                     Tea Tree Plaza (SA)
        Coomera (QLD)             Newmarket (NZ)                  Warringah Mall - Stage 2 (NSW)
        Innaloo (WA)              Plenty Valley (VIC)             Whitford City (WA)

                                                                                                           Full Year Results 2015 // Page 10
APPENDICES
Scentre Group - Full Year Results 2015 // Page 11DEVELOPMENTS
ACTIVE PROJECTS
WESTFIELD CHERMSIDE
The $355m redevelopment of Westfield Chermside
includes the construction of a second level gallery mall
that will connect with the upper levels of Myer and
David Jones department stores, and a new lifestyle and
entertainment precinct.
The gallery mall will be home to approximately 95
retailers including a number of large-format tenancies
with local and international mini-major stores, providing
a point of difference in the Brisbane market.
More than 12 large restaurant tenancies and 13
small-format street food stores will form the basis of a
lifestyle and entertainment precinct that links directly to
an existing Event Cinemas complex with 2 Gold Class,
2 Vmax and 12 standard auditoriums.
On completion of the redevelopment, which is the first
major project since 2007, Westfield Chermside will be
156,643sqm retail GLA.
The new gallery mall is scheduled to open in April 2017,
with the entertainment and lifestyle precinct to follow
some months after.
Full Year Results 2015 // Page 12DEVELOPMENTS
ACTIVE PROJECTS
WESTFIELD NORTH LAKES - Stage 2
A $140m redevelopment of Westfield North Lakes is
underway with the construction of a new 60-store retail
mall that will link the new 29,000sqm IKEA-owned store
currently under construction with the existing centre.
The new retail mall will also be anchored by a Kmart
discount department store and JB Hi-Fi HOME. The
redevelopment will improve North Lakes’ customer offer,
creating one of the most comprehensive retail centres in
Brisbane’s north.
Construction of the IKEA store is progressing on schedule
and is due for completion in late 2016 to coincide with the
opening of the new retail mall.
On completion of the redevelopment Westfield North
Lakes will be around 113,000sqm GLA.
In November 2015 Stage 1 of Westfield North Lakes’
redevelopment opened with two new precincts – The
Marketplace fresh food and The Laneway al fresco dining –
as part of the $80m project, which also includes a brand
new Event Cinemas complex due to open at Easter.
The Stage 1 project included 17 new specialty retailers and
a state-of-the-art children’s playground serving the centre’s
local family-based community.
Full Year Results 2015 // Page 13DEVELOPMENTS
ACTIVE PROJECTS
WESTFIELD WARRINGAH MALL
Construction at Westfield Warringah Mall is progressing
well and on track to open in 2016.
A new two-level parallel mall, anchored by a reconfigured
Myer department store and large format mini-major
retailers across both levels, will connect through to
Woolworths on Level 1 and BIG W on Level 2. Myer’s
reconfiguration and refurbishment is a key part of the
$310m redevelopment with the former three-level
21,822sqm store to be transformed into a new two-level
15,000sqm store.
Approximately 70 new retailers will be introduced to the
centre, complemented by the refurbishment of the existing
fresh food precinct.
The project’s design will highlight the outdoor elements
with a roof-top canopy providing ambience and
protection over parts of the centre’s open areas. A
number of dedicated spaces will be created for hosting
events and installations.
Westfield Warringah Mall will be 134,000sqm GLA
on completion.
Full Year Results 2015 // Page 14DEVELOPMENTS
ACTIVE PROJECTS
CASEY CENTRAL
Work is progressing well on the $155m project at
Casey Central which is on track for completion with
the first stage opening in March and final stage in
September 2016.
Casey Central, in which the Group acquired its initial
interest in 2006, will transform from a small
neighbourhood centre with a total GLA of 6,500sqm,
23 shops and a Coles to a 28,700sqm retail centre with
northern and southern pavilions linked by a retail mall,
a new full-line Coles supermarket adjacent to a fresh
food precinct, a Woolworths supermarket (opening
September), an Aldi supermarket and a new-format
Target discount department store.
Casey Central is located on a 10-hectare site in Narre
Warren in Melbourne’s south-eastern growth corridor.
On completion in September, Casey Central will
comprise 84 retail stores and will also feature a
casual dining precinct adjoining an external children’s
play area.
Full Year Results 2015 // Page 15DEVELOPMENTS
COMPLETED PROJECTS
WESTFIELD HURSTVILLE
In November 2015 Westfield Hurstville’s $105m
redevelopment opened with a full refurbishment, an
ambience upgrade and the introduction of ticketless
parking.
A highlight of the project is the rooftop dining and
entertainment precinct which has a range of late-
trading casual dining outlets. The new precinct links
directly to the refurbished Event Cinemas that now
features one of the largest Vmax screens in Australia.
New retailers to the centre include a Woolworths
supermarket, BIG W discount department store,
JB Hi-Fi HOME, Cotton On Mega Store and Rebel Sport.
Full Year Results 2015 // Page 16DEVELOPMENTS COMPLETED PROJECTS WESTFIELD CHATSWOOD In November 2015 the first stage of Westfield Chatswood’s $125m redevelopment opened with a new five-level mall on Victoria Avenue replacing the existing two-level mall, and a reconfiguration and upgrade of two levels of the existing multi- storey mall. The Asian dining market Hawker Lane also opened with 14 street- food style operators trading in an open kitchen late night environment. Hawker Lane links to an outdoor laneway decorated with public artwork and activated with food truck vendors. The redeveloped centre’s improved fashion offer features four new large-format tenancies including the newly opened Uniqlo and H&M stores, a relocated Rebel Sport and the flagship two- storey Topshop Topman facing Victoria Avenue. Existing major tenants Target and Hoyts are currently undertaking full refurbishments to their latest model stores. Around 45 new retailers, including the international mini-majors, have been added to the centre which has increased to 80,000sqm GLA. WESTFIELD KOTARA In November 2015 Westfield Kotara’s $55m redevelopment opened with a new rooftop dining and entertainment precinct set in an open-air landscaped garden space with nine restaurants and food outlets. The precinct has transformed Newcastle’s family entertainment options with a new eight-screen Event Cinemas complex with Gold Class and Vmax auditoriums, creating a genuine Full Year Results 2015 // Page 17 entertainment and lifestyle addition for the local community.
DEVELOPMENTS
COMPLETED PROJECTS

WESTFIELD MIRANDA
Westfield Miranda opened in October 2014 with the launch
of a gourmet fresh food market and a three-level galleria
fashion mall and an al fresco dining precinct with nine
restaurants, cafes and food operators set around a
landscaped public space.

Opening at the same time was the providore-style food
market with 20 specialty suppliers, a state-of-the-art
demonstration kitchen and the most comprehensive
selection of fresh food in Sydney’s south, in an environment
representing the very latest in food retail design.

During 2015 a rooftop dining precinct with six restaurants
opened, linking directly to the relocated ten-screen Event
Cinemas complex with Gold Class and Vmax auditoriums.
Later in the year a Coles supermarket was introduced to the
centre, anchoring a fully refurbished fresh food precinct on
Level 2.

The project’s final precinct, in the former cinema space, is
scheduled to open around Easter 2016 with the addition of
Skyzone; Playtime and a range of family dining options.

Westfield Miranda is now 129,000sqm GLA with an additional
100 specialty retailers on completion of the redevelopment.

                           Full Year Results 2015 // Page 18
FINANCING
Diversified funding including bonds and bank facilities from 19 banks
FACILITIES
FACILITIES LIQUIDITY
Total Committed $14.0bn
Amount Drawn $(10.4)bn
Undrawn $3.6bn
Cash $0.1bn
Liquidity $3.7bn
MATURITY PROFILE
As at 31 December 2015 with foreign currency bonds at fully hedged A$ equivalent face value
Full Year Results 2015 // Page 19KEY RATIOS KEY METRICS 31 December 2015
Gearing (look through basis) 33.3% 1
Weighted Average Debt Maturity 5.6 years
Investment Grade Ratings A1 (Stable) Moody's
A (Stable) S&P
BOND COVENANTS Requirement 31 December 2015
Net Debt/ Net Assets Not greater than 65% 34.6% 2
Secured Debt/ Total Assets Not greater than 45% 0.7%
Interest Coverage At least 1.5 times 3.5 times 3
Unencumbered Leverage Not less than 125% 285%
1. On a pro forma basis post sale of two New Zealand assets gearing would be 32.3%
2. On a pro forma basis post sale of two New Zealand assets Net Debt/ Net Assets would be 33.7%
3. For the 12 months to 31 December 2015
86% Hedged at 31 December 2015
INTEREST 74% Hedged on average for next 3 years 1
HEDGING $ FIXED RATE DEBT
$ debt payable $ swap payable
DERIVATIVES HEDGING FLOATING RATE $ & NZ$ DEBT
NZ$ swap payable NZ$ collar payable
PROFILE 31 Dec 1 $m Fixed Rate $m Fixed Rate NZ$m Fixed Rate NZ$m Strike Rates
2015 (1,380.0) 4.70% (7,122.5) 2.93% (435.0) 4.07% (70.0) 3.39%/5.25%
2016 (580.0) 3.25% (7,717.5) 2.92% (320.0) 4.00% (70.0) 3.39%/5.25%
2017 (580.0) 3.25% (7,508.5) 2.90% (230.0) 3.80% (70.0) 3.39%/5.25%
2018 (580.0) 3.25% (7,095.0) 2.89% (150.0) 3.62% (70.0) 3.39%/5.25%
2019 (430.0) 3.31% (5,730.0) 2.86% (150.0) 3.62% - -
2020 (430.0) 3.31% (3,960.0) 2.96% (100.0) 3.68% - -
2021 (30.0) 3.81% (2,260.0) 3.06% - - - -
2022 - - (750.0) 3.10% - - - -
1. As at 31 December 2015. All rates exclude borrowing margin
Full Year Results 2015 // Page 20PROFIT
AND FFO
PROFIT AND FFO
$m PROFIT FFO FFO Financial
12 months to Adjustments 1 12 months to Statement Notes
31 December 2015 31 December 2015
A B C=A+B
Net Property Income
- Australia 1,632 36 1,668 Note 4(a)(iv)
- New Zealand 154 2 156 Note 4(a)(iv)
Total Net Property Income 1,786 38 1,824 Note 4(a)(iv)
Management income 2 46 - 46
Project income 3 85 - 85
Gross income 1,917 38 1,955
Overheads (91) - (91) Note 4(a)(i)
Revaluations 1,539 (1,539) - Note 4(a)(i)
Gain in respect of capital transactions 19 (19) - Note 4(a)(i)
EBIT 3,384 (1,520) 1,864
Net interest 4 (613) 114 (499)
Currency derivatives 103 (103) - Note 4(a)(i)
Earnings before Tax 2,874 (1,509) 1,365
Tax (38) (34) (72) Note 4(a)(i), Note 9, Note 16(a)
Minority interest 5 (128) 34 (94)
Profit after Tax/ Funds from Operations 2,708 (1,509) 1,199
Retained earnings (89)
Distribution 1,110
1. FFO adjustments relate to revaluations, mark to market of interest rate and currency derivatives, tenant allowance amortisation, deferred tax benefit and gain on sale of capital
transactions.
2. Management income $57m less management expenses $11m = $46m.
3. Project income $683m less project expenses $598m = $85m.
4. Financing costs $727m (Note 4(a)(i)) less interest income $8m (Note 4(a)(i)) less interest expense on other financial liabilities $81m (Note 7) less net fair value loss on other financial
liabilities $25m (Note 7) = $613m.
5. Minority interest $22m (Note 4(a)(i)) plus interest expense on other financial liabilities $81m (Note 7) plus net fair value loss on other financial liabilities $25m (Note 7) = $128m.
Full Year Results 2015 // Page 21BALANCE
SHEET
BALANCE SHEET PROPORTIONATE 1
$m Consolidated Equity Accounted 31 December 2015
A B C=A+B
Cash 143 10 153
Property investments
- Shopping centres 27,161 2,352 29,513
- Development projects and construction in 494 71 565
progress
Total Property investments 27,655 2,423 30,078
Assets held for sale 417 417
Equity accounted investments 2,333 (2,333) -
Deferred tax assets 83 - 83
Other assets 1,211 6 1,217
Total assets 31,842 106 31,948
Interest bearing liabilities
- Current 1,713 - 1,713
- Non-current 9,391 - 9,391
Finance lease liabilities 39 15 54
Deferred tax liabilities 180 56 236
Other liabilities 1,457 35 1,492
Total liabilities 12,780 106 12,886
Net Assets 19,062 - 19,062
Minority interest 2 (1,422) - (1,422)
Net Assets attributable to Scentre Group 17,640 - 17,640
1. Period end AUD/NZD exchange rate 1.0665 at 31 December 2015
2. Includes $1,155m of Property Linked Notes shown in minority interest given their equity characteristics, and $267m relating to Carindale
Full Year Results 2015 // Page 22You can also read