Future of Home Care Services in Manitoba - The Government of Manitoba Minister of Health, Seniors and Active Living Reg Toews, Project Consultant
←
→
Page content transcription
If your browser does not render page correctly, please read the page content below
DECEMBER 2016

Future of Home Care Services in Manitoba

                    The Government of Manitoba
     Minister of Health, Seniors and Active Living

                   Reg Toews, Project Consultant

                  CONSULTANT REPORT
EXECUTIVE SUMMARY
The Review was commissioned to develop a comprehensive home care plan for the future that will
ensure that Manitoba has a home care service that is safe, reliable, responsive, equitable and
sustainable and that will strengthen Manitoba’s universal and publicly funded home care services,
and provide a follow-up to the Office of the Auditor General report recommendations. A specific
impetus for this project was the growing demand for services from the baby boomer generation of
seniors.
The review process involved broad consultation with the different levels of home care personnel,
clients, family and informal caregivers and stakeholders, including an online opportunity for
public input, demographic/clinical data analysis, and a review of the professional literature and
internal documents. A twelve member Leadership Team was established to provide input and
guidance to the Consultant. A four member Support Unit, composed of home care services staff,
supported and enriched the review process.
Home Care services were established in 1974. Its primary purpose was to allow people to remain
at home for as long as possible. In 1997, the newly established Regional Health Authorities (RHA)
took over responsibility for the operation of home care services. For the past number of years
home care has annually served approximately 39,000 clients with approximately 15,000
admissions and 15,000 discharges annually.
Key demographic and clinical changes include:
As part of the process for developing a comprehensive plan for the future a thorough demographic
and clinical analysis was completed. This process identified the following.
The Manitoba Bureau of Statistics projects that Manitobans age 65 and older will nearly
double by the year 2038. The greatest increase in numbers will be found among the 75 to
84 age cohort.
The prevalence of chronic conditions has increased and co-occurring conditions are
experienced at higher rates in seniors.
Based on a 5-year average of admissions, utilization is greatest from age 75+ with over half
of the provincial home care admissions coming from this age group. Seventy-two percent of
home care admissions were 65+ years of age.
Among the changes in Winnipeg Regional Health Authority (WRHA) home care clients is an
increase in the prevalence of cognitive impairment and the presence of multi-morbidity –
the co-occurrence of two or more chronic medical conditions.
All of the regions in Manitoba are projected to experience an increase in home care
admissions over the next 20 years (till 2037). Based on a year-over-year percentage change
calculation this increase would be between 2%-3% per year, or a yearly increase
equivalent to 3.5%
The prevalence of cognitive impairment will increase as will Activities of Daily Living (ADL)
impairment where hands on assistance is required. The proportion of clients with complex
care needs is estimated to increase at the same rate as the increase in the number of clients.
If projections hold true, home care services in Manitoba will essentially have to double
their efforts within 20 years to provide the required service needs of clients.
2Key findings from the review include:
Family and informal caregivers are an essential component of home care but may be a
diminishing resource in the future.
Home care is not standardized across the province to the degree it should be.
Home care is under continuing pressure to facilitate the discharge of patients from the
hospital. This has the effect of pushing home care in the direction of a health/medical
service model.
Self and Family Managed Care (SFMC) program is growing and seniors, in addition to
younger adults with physical disabilities, are making increased use of it.
The complexity and acuity of client need is continuing to increase.
Nurses are delegating more tasks to Home Care Attendants (HCAs).
The lack of continuity in the assignment of HCAs and insufficient time allocated to complete
the assigned task remains an issue.
Information Communication Technology (ICT) programs currently available in home care
are generally inadequate – frequently what does exist is old.
The Continuing Care Branch (CCB) is unable to fulfill its assigned role due to insufficient
resources.
Recruitment and retention of home care personnel is a constant challenge – at any one time
there is a vacancy rate of 8-10%.
Key implementation recommendations from the review include:
Endorse the foundational components of the future home care services as outlined in the
Report: purpose, objectives and service delivery structure, basket of core services, and
ongoing role of family and informal caregivers.
Develop a single standardized list of core services.
Develop a caregiver care plan separate from the client care plan at the time of the needs
assessments.
Outline a partnership relationship between the client/caregiver and home care, and put
less emphasis on the word “supplemental” which has become too limiting a term.
As the needs of clients increase ensure training and education opportunities are available
to the caregiver with funding attached to allow for implementation.
Continue SFMC as a valid option available to clients.
Ensure home care and acute care work together to develop deliberate and effective
discharge plans and sufficient personnel are in place so that home care does not
increasingly become a health care/medical program only.
Set a timeline to complete the amalgamation of home care services in each of the
rural/northern RHAs.
Continue to expand, as appropriate and resources allow, the use of the delegated task
process.
Provide the CCB with the appropriate resources for it to fulfill its defined leadership role.
Develop a comprehensive central policy manual that reinforces consistent province-wide
home care services.
Post provincial performance/clinical data on-line once available.
3 Develop a detailed financial projection for the next 3-5 years.
Efforts should continue undiminished to ensure that all HCAs in home care are certified.
Develop a system-wide Human Resource (HR) strategy for home care that would include,
but not be limited to, strategies that are designed to attract and retain millenials and
immigrant workers in the workforce.
Develop a standard provincial curriculum to be followed by all provincial institutions –
public and private – when educating HCAs.
RHAs provide mandatory education/training for all Direct Service Workers (DSWs) on
dementia, managing challenging behaviour, mental health and other emerging health
issues.
Develop a comprehensive province-wide ICT strategic plan for home care.
In the short term, explore making appropriate mobile technology available to DSWs, Direct
Service Nurses (DSNs), Case Coordinators (CCs) and Resource Coordinators (RCs).
Sustainability
There are two areas that have primary impact on the future sustainability of home care – financial
and HR/Workforce – and to a lesser extent ICT and other costs. While it is solely a government
responsibility to determine the amount of resources to be allocated to home care the following
illustrative scenarios can be of assistance in arriving at such a decision. Approximately 5.5%-6%
of total health expenditures are annually spent on home care.
Scenario 1 – The Manitoba Bureau of Statistics completed a study entitled Health Care
Spending in Manitoba 2012 to 2037 in which it projects that health care expenditures will
double in that period. Applying this to home care would result in expenditures increasing
from $324m in 2014/15 to $648m in 2037.
Scenario 2 – The second scenario is based on the assumption that the future will look very
similar to the past. For a 15 year period (1999/2000-2014/15) home care funding
increased by a total of 116% or a yearly increase equivalent to 7.7%. Based on that
experience a future 22 year period (2015-2037) would represent an increase in funding of
170 percent or an increase of approximately $550m for a total home care funding by 2037
of $874 million.
Scenario 3 – This scenario is based on future fixed cost increases and volume growth.
Volume growth is projected for the next 22 years at a yearly increase equivalent to 3.5%.
Extrapolating from information provided by the Provincial Health Labour Relations on
cumulative compensation increases for the past 19 years compensation costs going
forward might increase at a yearly rate of 4-4.5% plus any increases in benefits/pension.
Fixed costs are primarily determined through the collective agreement negotiating process
– so fixed costs may be higher or lower than in previous years. Combining volume increase
and fixed cost over a 22 year period the total increase would be approximately 177% or
$573m for total home care funding of $897m by 2037.
The above scenarios do not provide for increased spending on ICT and other related costs. What
can be said with some certainty is that home care funding will need to increase in the future.
Due to a projected yearly growth in units of service (unit equals one hour) equivalent to 3.6% or
80% over the next 22 years approximately an additional 2000 HCA/Home Support Worker (DSW)
EFTs will be required – approximately 90-100 new EFTs each year. During that same period an
4additional 310 DSN EFTs will be required. In addition to the above front line workers there will
also be a need for more Scheduling Clerks (SCs), CCs, RCs and administrative staff. It goes without
saying that recruiting all of these additional personnel will represent an extreme challenge,
particularly since at any one time home care has a vacancy rate of 8-10%.
Office of Auditor General and Inquest Recommendations
The CCB and the RHAs continue to plan and implement their responses to the above
recommendations.
The Way Forward
While this review has looked primarily at the long term demands on home care the
implementation process for select major recommendations cannot be delayed – the way forward
begins now. These major recommendations include: developing an effective province-wide ICT
system for home care; providing the CCB with adequate resources so that it can provide strong
provincial leadership, and addressing pressing HR issues.
There are also a number of items requiring future work. These items include: studying the whole
area of home-based technology and its application, completing a study on the broad area of HR in
home care, carrying out a study on housing with health services models to determine which
models are most beneficial for home care and the client, and researching different funding models
for home care services.
5Table of Contents
EXECUTIVE SUMMARY ..................................................................................................................................................... 2
TERMS OF REFERENCE AND PROJECT CHARTER ................................................................................................. 9
METHODOLOGY ................................................................................................................................................................ 10
INTRODUCTION ................................................................................................................................................................ 11
Historical......................................................................................................................................................................... 11
Provincial Overview ................................................................................................................................................... 12
I. DEMOGRAPHIC AND CLINICAL CHANGES ......................................................................................................... 13
A. Change in Demographics ..................................................................................................................................... 13
B. Clinical Developments in Home Care.............................................................................................................. 19
C. Home Care Projections ......................................................................................................................................... 25
D. Summary.................................................................................................................................................................... 32
II. CONSULATION AND DATA FINDINGS ................................................................................................................ 33
A. What was Learned from the Consultation Process ................................................................................... 33
Consultation with Home Care Personnel ...................................................................................................... 33
Consultation with Clients/Caregivers ............................................................................................................ 35
Consultation with Stakeholders ........................................................................................................................ 36
Public Consultation ................................................................................................................................................ 36
B. What Statistics and Data tell us about Home Care .................................................................................... 36
III. PROGRAM AND SERVICE DELIVERY ................................................................................................................. 39
A. Foundational Components of Future Home Care Services .................................................................... 39
a. Purpose, Objectives and Service Delivery Structure ............................................................................ 39
b. Core Services........................................................................................................................................................ 40
c. Family and Informal Caregivers ................................................................................................................... 42
B. Client Groups ............................................................................................................................................................ 44
a. Seniors .................................................................................................................................................................... 45
b. Adults with Physical Disabilities .................................................................................................................. 45
c. Children with Disabilities ................................................................................................................................ 47
d. Adults with Intellectual Disabilities............................................................................................................ 48
C. Delivery of the Services ........................................................................................................................................ 50
a. Self and Family Managed Care ...................................................................................................................... 50
b. Hospital Discharges........................................................................................................................................... 53
c. Personal Care Home and Supportive Housing Placements ................................................................ 55
d. Housing with Health Services ....................................................................................................................... 56
e. Specialized Services .......................................................................................................................................... 57
f. Community Services and Clinics ................................................................................................................... 57
g. Restorative Approach ....................................................................................................................................... 59
h. Integration with Other Services ................................................................................................................... 60
i. Standardization of Baseline Services........................................................................................................... 62
j. Delegated Tasks .................................................................................................................................................. 63
k. EFT Project Related Issues ............................................................................................................................. 65
IV. OPERATIONS AND SYSTEMS ................................................................................................................................ 66
A. Leadership and Organization............................................................................................................................. 66
B. Public Accountability ............................................................................................................................................ 69
C. Finances...................................................................................................................................................................... 71
6D. Human Resources .................................................................................................................................................. 71
E. Information Communication Technology and Home-Based Technology ......................................... 77
F. Equipment and Supplies ...................................................................................................................................... 81
V. NATIONAL/INTERNATIONAL LITERATURE SCAN ....................................................................................... 82
A. National Scan............................................................................................................................................................ 82
B. International Scan .................................................................................................................................................. 83
VI. SUSTAINABILITY ....................................................................................................................................................... 85
A. Financial ..................................................................................................................................................................... 85
B. Human Resources................................................................................................................................................... 87
VII. RESPONSE TO OAG REPORT AND SINCLAIR/ALEXANDER INQUESTS ............................................. 89
A. Response to OAG Report...................................................................................................................................... 89
B. Response to Brian Sinclair and Frank Alexander Inquests .................................................................... 91
VIII. THE WAY FORWARD ............................................................................................................................................ 92
IX. ITEMS REQUIRING FUTURE WORK.................................................................................................................... 93
APPENDIX A ....................................................................................................................................................................... 94
HOME CARE LEADERSHIP TEAM MEMBERS ................................................................................................... 94
APPENDIX B ....................................................................................................................................................................... 95
HOME CARE SUPPORT UNIT .................................................................................................................................. 95
APPENDIX C........................................................................................................................................................................ 95
SUPPORT UNIT PRESENTATIONS TO THE LEADERSHIP TEAM .............................................................. 95
REFERENCES ..................................................................................................................................................................... 96
7Table of Figures
Figure I.1: Population aged 0 to 14 years and 65 years and older, 1995 to 2035, Canada ................. 14
Figure I.2: Distribution of the total population by age group ......................................................................... 15
Figure I.3: Population Aged 65 and Over: Select Age Groups ......................................................................... 16
Figure I.4: Observed (1990-2012) and Projected (2013-2042) Population of Manitoba by Age
Group for Three Projection Scenarios...................................................................................................................... 17
Figure I.5: Average Age and Percent Female, Long-Stay HC Clients in WRHA, 2002-2015 ................ 20
Figure I.6: Prevalence of Cognitive Impairment and Dementia, Long-Stay HC Clients in WRHA,
2002-2015 .......................................................................................................................................................................... 21
Figure I.7: Prevalence of Psychiatric Diagnosis, Long-Stay HC Clients in WRHA, 2002-2015 ........... 21
Figure I.8: Prevalence of Certain Diagnoses, Long-Stay HC Clients in WRHA, 2002-2015.................. 22
Figure I.9: Prevalence of 5+ Disease Diagnoses and ADL Impairment, Long-Stay HC Clients in
WRHA, 2002-2015 ........................................................................................................................................................... 23
Figure I.10: Prevalence of High/Very High MAPLe Scores and Risk for Institutionalization, Long-
Stay HC Clients in WRHA, 2002-2015 ...................................................................................................................... 24
Figure I.11: Prevalence of Caregiver (CG) Distress, by Live-In Status with Client, WRHA 2002-2015
................................................................................................................................................................................................. 24
Figure I.12: Number of Home Care Admissions in Manitoba and Regions, Projected for 2016-2037
................................................................................................................................................................................................. 26
Figure I.13: Number of Home Care Clients in Manitoba and Regions, Projected for 2016-2037 .... 27
Figure I.14: Number of WRHA Clients with Cognitive Impairment, Age 20+, Projected for 2016-
2037....................................................................................................................................................................................... 28
Figure I.15: Number of WRHA Clients with ADL Impairment, Age 20+, Projected for 2016-2037 29
Figure I.16: Number of WRHA Clients in High/Very High Care Priorities, Age 20+, Projected for
2016-2037 .......................................................................................................................................................................... 29
Figure I.17: Home Care HCA/HSW Service Hours in Manitoba, Projected for 2016-2037 ................. 30
Figure I.18: Home Care Nursing Hours in WRHA, by Age Group, Projected for 2016-2037 .............. 31
Table of Tables
Table I.1: Manitoba Regional Statistical Home Care Admissions Summary: 5-Year Average
(2008/09 – 2012/13) ..................................................................................................................................................... 18
Table I.2: WRHA Home Care Clients by Age Category, 2015 ........................................................................... 18
Table I.3: Number of WRHA Long-Stay Home Care Clients Assessed with RAI-HC, 2002-2015 ...... 19
Table I.4: WRHA Home Care Service Hours, 2015 ............................................................................................. 31
Table IV.1: Manitoba Home Care Workforce ......................................................................................................... 73
8TERMS OF REFERENCE AND PROJECT CHARTER
In August 2015 it was announced that a Home Care Leadership Team led by Reg Toews was to be
appointed to develop a comprehensive plan to guide home care services in the future and to guide
the province’s response to a recent report by the Office of the Auditor General (OAG). The Home
Care leadership Team will use the OAG recommendations, the Brian Sinclair and Frank Alexander
inquest recommendations, and the valuable insights of home care staff, clients and families, and
stakeholders to shape a plan to ensure Manitoba continues to be a leader in providing home care
services into the future.
The Project Charter intent is to provide the opportunity to develop a comprehensive home care
plan for the future where Manitoba has a home care service that is safe, reliable, responsive,
equitable and sustainable and will strengthen Manitoba’s universal and publicly funded home care
services. Recommendations were to address:
Manitoba has the capacity and resources to deliver the home care services and respond to
the growing demands for the services;
Alignment with other sectors of the health system;
Public accountability;
Financial and operational sustainability.
Identify long term health human resource planning strategies needed to maintain these
important services for Manitobans into the future
The full scope of this project includes the following additional items:
Provide recommendations on the most appropriate and efficient structure for the delivery
of home care in Manitoba;
Develop a plan to address the health human resource requirements for the future of home
care in Manitoba;
Develop a strategy to standardize and clarify baseline services offered through home care
across Manitoba;
Place home care services for Manitoba in the national context, by examining leading
practices from other jurisdictions nationally and internationally;
Ensure that plans to address the recommendations resulting from the OAG report and
inquests are developed;
Engage stakeholder groups, families and caregivers to provide their insights into the future
of home care in Manitoba;
Articulate implementation considerations.
A few clarifying comments on the scope of the project are in order. A specific impetus for this
project is the growing demand for services from the baby boomer generation of seniors. The size
and expectation of this population cohort will put extreme pressure on all health services,
including home care. The primary purpose of this project is to provide guidance to Manitoba
Health, Seniors and Active Living (MHSAL – more usually referred to as “the Department”) on the
future of home care services and what steps will need to be taken to address the growing demand
9for home care services. Secondly, the scope of this project does not include an in depth
examination of the current home care services but does include an overall understanding of the
various services and any issues and concerns confronting home care. This understanding of the
current services, and any issues and concerns, is important when making projections on the future
of home care.
METHODOLOGY
The methodology involved a four-part process: consultation, demographic/clinical data analysis,
literature review and review of internal documents.
Creation of a Leadership Team
A project requirement was the establishment of a Leadership Team (LT) with the Consultant as
chair. The LT worked with and provided input and guidance to the Consultant in completing the
project. The LT also reviewed all the report recommendations while they were still in draft form.
The twelve member Leadership Team (see Appendix A for a list of the members) was composed of
representatives from home care staff, Regional Health Authorities (RHA), the Continuing Care
Branch (CCB), clients, family/ informal caregivers and stakeholders. The home care staff consisted
of home care attendants (HCA), case coordinators (CC), resource coordinators (RC), direct service
nurses (DSN), and leadership staff. The membership included three staff members from the
Winnipeg Regional Health Authority (WRHA), four members from the rural RHAs, and four
members representing clients/caregivers /stakeholders. The LT met monthly (10 meetings) over
the length of the project. The LT also developed a stakeholder/client/caregiver engagement
process that complemented the work of the LT by drawing in additional individuals from within
the home care sector.
Consultation Process
The consultation process formed a very important component of the methodology. This process
involved interactive conversations with all levels of home care personnel, clients/caregivers and
stakeholders as well an online opportunity for public input.
The Consultant’s interviews/meetings with service providers, clients/caregivers and stakeholders
were completed over a 5-6 month period. This process involved over 90 meetings with a few
hundred individuals meeting either as individuals or in groups. These meetings took place in all
five RHAs and were structured as separate meetings with home care leadership, CCs, RCs, DSNs,
and HCAs. The Consultant also interviewed Department personnel. Additionally, in each RHA
meetings were held with a small group of clients/caregivers/stakeholders. Some client/caregiver
phone interviews were also completed. Separate meetings/interviews were held with stakeholder,
agency, and various advisory council representatives drawn from the different sectors of home
care.
10Finally, as part of the consultation process Manitobans were invited to share online their
perspectives and concerns regarding the current home care services and their suggestions for the
future of home care. Over 300 responses were received which were subsequently analyzed for
themes.
Demographic/ Clinical and Data Analysis
A home care program researcher seconded part-time to the Support Unit (SU – the Support Unit
will be described in detail at the end of this section) from the WRHA, was primarily responsible for
demographic and clinical trend analysis as it related to both current and future home care
services. The Consultant and other SU members also contributed to this process.
Literature Review
The Consultant and the Support Unit members were all involved in a review of both national and
international literature. While numerous sources were accessed the Internet was a valuable
resource for articles, reports and literature on the various aspects of home care. The appendix
contains a list of the major articles read as part of this review.
Review of Internal Documents
The major source for internal documents on home care services was the Continuing Care Branch.
These documents were supplemented with information from other sources, e.g. other
divisions/programs within the Department, RHAs, other government departments (specifically
Department of Families) etc.
Establishment of a Support Unit
A four member Support Unit (SU), composed of home care services staff, supported and enriched
the work of the Consultant (see Appendix B for a list of the members). The SU members brought to
their assignment many years of experience in home care, other health care programs, and related
non-governmental experience. The members were seconded from their regular duties with the
WRHA, a rural RHA and the CCB. Besides one full time secondment all the other secondments
were part-time. Typically, the Consultant and the SU met on a monthly basis. The SU members also
participated in the monthly LT meetings. Individual members of the SU prepared presentations for
the LT meetings on eight major home care review topics (see Appendix C for a list of the
presentations and the names of the presenters).
INTRODUCTION
Historical
The Manitoba Home Care Program (MHCP) was established in 1974. Its primary purpose was to
allow people to remain at home as long as possible living as independently as possible. The
Department of Health and Social Development in its1974 Annual Report describes in some detail
the responsibilities of the Office of Continuing Care which was created to co-ordinate the existing
home care services delivered through hospitals, private agencies, and departmental offices into
one community-based, province-wide program; to develop needed home care resources; and to
11integrate the assessment for placement in personal care homes with the assessment for Home
Care to assure the most appropriate utilization of care services and care facilities.
In addition to the program being community-based and province-wide it was to be government-
funded (no cost to the client), centrally managed with decentralized delivery of service, based on
an assessment of need and utilizing professional and non-professional personnel as well as
volunteers. Services were to be provided to individuals that required them to function adequately
at home by reason of aging, physical health disability, personal crisis or illness, or the disability of
the parent usually able to provide care to a child, and who, without services, would likely be
unable to remain at home. Additionally, the program was intended to relieve some of the
inappropriate pressure on acute and personal care home beds resulting from the absence of
comprehensive alternative care in the home.
The program was to provide a range of services including nursing services, social services,
rehabilitation services, health promotion services, and support services as required to maintain a
person in their own home. Also included in these services were household maintenance, personal
care and hygiene, health treatment and maintenance, counselling services, and home care
equipment and specialized services.
From its inception the program met an immediate need, particularly in rural areas. It grew quickly
from 5,000 persons served in April 1974 to 6500 in November 1974. As well approximately 300
persons were assessed and panelled for placement in December 1974. Over the intervening
decades the program continued to grow and evolve while remaining true to its original purpose
and objectives. It increasingly became an essential component in the provincial health care
system.
Provincial Overview
Between 1974 and 1997 when the RHAs assumed responsibility for the administration and
operation of home care services, with the Department providing policy direction and oversight,
there have been significant changes. Self and Family Managed Care, Palliative Care and more
specialized services have been added. The complexity and acuity of cases has increased, as have
the incidence of cognitive impairment, mental illness and the prevalence of two or more chronic
medical conditions among home care clients. The delegation of tasks by the direct service nurse to
the HCAs was introduced and these numbers continue to grow. The pressure from the hospitals to
discharge patients to their own home continues to increase the expectation on home care to
provide the necessary services in a timely manner. A regularized workforce of equivalent full time
(EFT) personnel has replaced the former “casual” workforce of HCAs and Home Support Workers
(HSWs). New housing models, such as Supportive Housing and Assisted Living, have been
introduced requiring home care to provide the personal care to these tenants. What remains
unchanged is the purpose of home care - to help people stay in their own home for as long as
possible - and for home care to assess all clients for placement in Personal Care Homes (PCH) and
Supportive Housing (SH).
12According to the recently completed RHA regional scan, the RHAs provided the following core
services: personal care, nursing, therapy services (occupational therapy [OT] and physiotherapy
[PT]), household maintenance, meal preparation, laundry, respite and off-site services. In addition,
the RHAs also provided a variety of specialized services as well as equipment and supplies.
In 2015 the five RHAs employed the equivalent of approximately 3,500 full time personnel plus
additional casual staff to provide the home care services. The annual funding provided by the
Department has been stable for the past five or six years. According to the information provided
by the Continuing Care Branch in 2014/15 the RHAs received $324m in funding from the
Department. In the past 15 years (1999/2000 to 2014/15) the funding from the Department has
more than doubled.
Since 2006/07 home care has annually served approximately 39,000 clients. In the past 15 years
the number of clients served has increased by approximately 9%. In 2012/13, according to the
most recent information available, there were approximately 15,500 admissions and
approximately 15,700 discharges. These numbers have remained stable for the past five years.
I. DEMOGRAPHIC AND CLINICAL CHANGES
Part I of this report reviews several topics fundamentally important to understanding the current
state of home care in Manitoba and the future of the service. Section A reviews population aging
in Canada in general and in Manitoba specifically, and how the changing demographics impact
home care. Section B examines the current profile of home care clients in Manitoba and recent
trends leading up to the current client status. The final section provides a glimpse into the future
of home care through projections of various home care indicators.
A. Change in Demographics
Canada’s population is aging – there is an increasing share of older persons in the population.
Statistics Canada reported that in 2015 there were more Canadians aged 65 years and older than
children ages 0 to 14 (Statistics Canada, 2015a). That year the growth rate of seniors in Canada
was approximately four times the growth rate of the total population. This phenomenon is
expected to intensify over the next few decades as the aging of Canada’s baby boomers takes place.
Statistics Canada estimates in the next 20 years, the proportion of older Canadians should
continue to grow and increase the gap with the proportion of Canadians age 14 and younger
(Figure I.1).
13Figure I.1: Population aged 0 to 14 years and 65 years and older, 1995 to 2035, Canada
Source: Statistics Canada, 2015a; p. 51
Statistics Canada (2015b) estimates the greatest aging of the country will occur between 2026 and
2045 as the baby boom cohort ages into age 65 and older categories. Based on different scenarios
reflective of Canada’s historical trends in fertility, life expectancy, and migration rates, Statistics
Canada’s estimates of the distribution of Canada’s projected population, by age group, is provided
in Figure I.2.
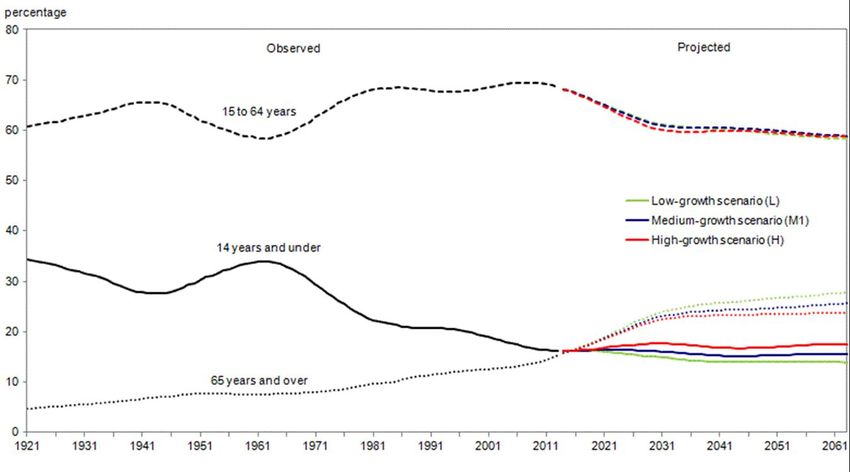
14Figure I.2: Distribution of the total population by age group, observed (1921 to 2013) and
projected (2014 to 2063) according to low-growth (L), medium-growth (M1) and high-
growth (H) scenarios, Canada
Source: Statistics Canada, 2015b; p. 13
The province of Manitoba is experiencing similar population aging, although not quite at the same
rate as the overall Canadian population. Manitoba is on average a younger province than Canada
as a whole, but still aging nonetheless. Two recent Manitoba publications highlight this change
through examination of population change from decades past to projections of Manitoba’s
population growth and demographic changes in decades to come. The Manitoba Bureau of
Statistics’ 2015 report ‘Impacts of Demographic Change on Manitoba’ and the 2014 report from
Yan and colleagues at the George and Fay Yee Centre for Healthcare Innovation, ‘Manitoba
Population Projections: 2013-2042’, both reviewed historical trends in Manitoba’s fertility, life
expectancy, and migration rates to project future demographic scenarios for the province. The
projections from both reports point to a future with a significant increase in the number of seniors
in the Manitoba population. The examination from the Manitoba Bureau of Statistics (MBS, 2015)
projects that Manitobans age 65 and older will nearly double by the year 2038. The greatest
increase in numbers will be found among the 75 to 84 age cohort (Figure I.3).
15Figure I.3: Population Aged 65 and Over: Select Age Groups
Source: MBS (2015); p. 4
Similar projections were reported by Yan and colleagues (2014). The authors project that the
number of seniors will more than double the size found in 2013 by the year 2042, regardless of
the scenario investigated.1 The overall number of seniors, and the proportion of the population
they comprise, will grow substantially and is less influenced by different scenarios (Figure I.4).
There seems to be greater certainty about the growth in the number of seniors in Manitoba.
Within the next 25 years the older cohort of Manitobans may be equal to or greater than the
number in the 0 to 19 age cohort.
Population Aging and Home Care
The projected changes in Manitoba’s demographics have implications for Manitoba’s healthcare
system generally, and home care services in particular. We know that use of health care services
increases with age. With age a person’s health status declines. The prevalence of chronic
conditions increases and co-occurring chronic conditions are experienced at higher rates in
seniors. Activity restrictions increase, physical disability increases, and cognitive impairment
increases. The primarily chronic conditions experienced with older age are often not curable and
instead require long-term support and care. As such, demands for home care related services
increase with age (Chappell, 2011).
1
The authors projected population changes based on low (L), medium (M), or high (H) assumptions about fertility, life
expectancy, and migration rates.
16Figure I.4: Observed (1990-2012) and Projected (2013-2042) Population of Manitoba by
Age Group for Three Projection Scenarios
Source: Yan et al., 2014; p.19
Manitoba’s senior population’s reliance on home care is evident in Tables I.1 and I.2. Home care
admission statistics provided by the Department demonstrate that the population aged 65 and
older represents the vast majority of clients admitted to the service in Manitoba between 2008/09
and 2012/13 (Table I.1). Based on a 5-year average of admissions, utilization is greatest from age
75 onwards with over half of home care admissions in the province being comprised of that age
group. Each Regional Health Authority in the province has the largest proportion of home care
admissions coming from the seniors in their region.
The age-related admission patterns translate into seniors being the largest users of home care
service throughout the year. The Winnipeg Regional Health Authority (WRHA) home care
program reviewed intake, community assessment, and community service data for 2015 and
found over 20,000 different individuals accessed the service. Over three-quarters of these clients
were age 65 or older (76%), with a full 61% of the clients being age 75 or older (Table I.2).
Given seniors’ utilization of home care services, the changing demographics and aging of the
population that Manitoba will face in the next few decades does indicate there will be an increased
need for formal home care support. The utilization of the service may be heightened further by
other factors, such as potential less availability of family caregivers due to lower fertility rates or
seniors’ increasing demand for care options in the community so they can age in place. Some of
these factors are placing current and possible future pressure on home care and are explored in
other sections in this report.
17Table I.1: Manitoba Regional Statistical Home Care Admissions Summary: 5-Year Average (2008/09 –
2012/13)
Region # Clients # Clients # Clients # Clients # Clients Total
Age < 18 Age 19-44 Age 45-64 Age 65-74 Age 75+ Average #
(% of total) (% of total) (% of total) (% of total) (% of total) Admission
s
Interlake-
Eastern RHA 25 (2%) 105 (7%) 321 (22%) 300 (21%) 709 (49%) 1,461
(IERHA)
Northern RHA
(NRHA) 11 (3%) 55 (15%) 116 (31%) 85 (22%) 111 (29%) 378
Prairie Mountain
Health (PMH) 28 (1%) 142 (5%) 440 (16%) 449 (16%) 1,769 (63%) 2,828
Southern Health
(SHSS) 34 (3%) 78 (7%) 206 (17%) 218 (18%) 642 (54%) 1,179
Winnipeg RHA
(WRHA) 38 (0.4%) 649 (7%) 1,978 (21%) 1,702 (18%) 5,103 (54%) 9,470
Manitoba
137 (1%) 1,028 (7%) 3,062 (20%) 2,754 (18%) 8,335 (54%) 15,316
Source: Provincial Home Care Regional Statistical Admissions Summary
Table I.2: WRHA Home Care Clients by Age Category, 2015
Age Category Female Male Total # % of Total
Clients Clients
0-19 127 117 244 1%
20-44 653 735 1,388 7%
45-64 1,585 1,667 3,252 16%
65-74 1,702 1,332 3,034 15%
75+ 8,083 4,328 12,411 61%
Total 12,150 8,179 20,329
Source: WRHA Home Care
18B. Clinical Developments in Home Care
Just as Manitoba’s demographic make-up has been changing, so has the profile and clinical status
of the province’s home care clients, likely in part to the aging of the population. A good example of
client change comes from the WRHA where client status and the changing composition have been
tracked by home care for over a decade. Clients in WRHA home care account for over 60% of
home care clients in Manitoba and therefore strongly influence the status of home care in the
province. For example, as seen in the previous section in Table I.1, the WRHA accounted for 62%
of admissions to home care in Manitoba over the five year period examined.
WRHA clinical assessment data collected on all long-stay home care clients were examined for
changes in client indicators. All WRHA Home Care clients who are anticipated to need service for
greater than 60 days are assessed with the interRAI assessment tool for home care, the RAI-HC
(Morris et al., 2002). The tool is a reliable assessment that informs Home Care Case Coordinators
about client need and guides care and service planning. Table I.3 identifies the number of long-
stay home care clients in Winnipeg assessed with the RAI-HC from 2002 to 2015. These clients
represent those individuals who require sustained, long-term care, often due to chronic issues.
Their ages range from approximately 16 and upwards, so they are considered an ‘adult’ long-stay
client population.
Table I.3: Number of WRHA Long-Stay Home Care Clients Assessed with RAI-HC, 2002-2015
2002 2003 2004 2005 2006 2007 2008 2009 2010 2011 2012 2013 2014 2015
2742 3024 3263 3317 3453 3590 3543 3489 3575 3510 3531 3579 3546 3916
Male
Female
6441 6979 7523 7500 7773 7820 7780 7419 7527 7390 7276 7136 6961 7295
Total
9183 10003 10786 10817 11226 11410 11323 10908 11102 10900 10807 10715 10507 11211
The following graphs highlight the changing profile of the adult long-stay home care client
population in Winnipeg, based on their RAI-HC data. Figure I.5 reveals that just as the population
of Manitoba has been aging over time, so has the population of long-stay home care clients. The
average age of clients was 76 years old in 2002 and rose to 79 years old by 2015. Alongside that
demographic change is a slight change in the gender composition of home care clients, with the
proportion of clients being female dropping over time to a current proportion of 65%.
19Figure I.5: Average Age and Percent Female, Long-Stay HC Clients in WRHA, 2002-2015
One of the most striking changes in WRHA home care clients is the prevalence of cognitive
impairment2. Figure I.6 clearly shows a significant increase in cognitive impairment among
clients, rising from 26% in 2002 to 42% of long-stay clients having cognitive impairment by 2015.
This dramatic increase in cognitive impairment is not driven exclusively by an increase in the
prevalence of dementia. Dementia among clients has not risen at the same rate as cognitive
impairment in this time period, growing from a prevalence of 16% in 2002 to 20% in 2015 (Figure
I.6). It may be that a certain proportion of the current rate of cognitive impairment is due to
undiagnosed dementias, but the WRHA Home Care Program does indicate that increases in the
prevalence of other neurological conditions and mental health conditions are contributing to that
increased rate of cognitive impairment seen today as well.
2Cognitive impairment levels measured on the RAI-HC during clinical assessment; Figure I.6 depicts the prevalence of
cognitive impairment that ranges from mild to very severe.
20Figure I.6: Prevalence of Cognitive Impairment and Dementia, Long-Stay HC Clients in
WRHA, 2002-2015
The increase over time in the prevalence of psychiatric diagnoses among long-stay clients is
presented in Figure I.7. The rate has nearly doubled in 14 years, growing from 12% in 2002 to
22% by 2015. Depression is not the condition contributing to this trend since its prevalence
among WRHA Home Care clients has remained relatively unchanged at 9% in this period (Figure
I.7).
Figure I.7: Prevalence of Psychiatric Diagnosis, Long-Stay HC Clients in WRHA, 2002-2015
Similar to depression, some other chronic diseases were found to be quite stable in their
prevalence over time. For example, stroke, congestive heart failure (CHF), coronary artery disease
(CAD), and chronic obstructive pulmonary disease (COPD) are depicted in Figure I.8. All four
diagnoses ranged between a prevalence of 15% to 17% in 2002; the range changed to 13% to 19%
21by 2015. The rate of COPD had the greatest change, increasing from 15% to 19% over time. CAD
also increased, but seems to be declining and is currently at 16% (up from 15% in 2002). CHF has
declined as well, decreasing from 15% in 2002 to 13% in 2015. Prevalence of stroke however
remains fairly stable around 17% throughout.
Figure I.8: Prevalence of Certain Diagnoses, Long-Stay HC Clients in WRHA, 2002-2015
Even though certain chronic diseases did not change considerably in their prevalence over time,
the presence of multi-morbidity – the co-occurrence of two or more chronic medical conditions in
a client – is now prevalent at a higher rate among clients. Based on the number of diseases
assessed as present with clients in their clinical RAI-HC assessments, a count of disorders per
client can be obtained. Nearly all long-stay clients have the co-occurrence of two chronic
conditions, but as Figure I.9 reveals, the prevalence of multiple conditions among clients is rising.
The proportion of long-stay home care clients in the WRHA with five or more disease diagnoses
rose from 49% in 2002 to 57% in 2015. Home care clients are dealing with multiple disease
conditions at once, increasingly so, and this has implications on clients’ functioning and care
needs.
Not surprisingly the proportion of clients requiring assistance with their Activities of Daily Living
(ADLs; e.g., dressing, bathing, eating, toileting) has risen over time, and at a rate that is very
similar to the pattern seen for the prevalence of 5+ diseases (Figure I.9). The proportion of long-
stay home care clients in the WRHA who require hands on assistance with their ADLs rose from
20% in 2002 to 26% by 2015. A client’s increased need for support with these daily self-care
activities can increase the demands on both the informal and formal care network.
22Figure I.9: Prevalence of 5+ Disease Diagnoses and ADL Impairment, Long-Stay HC
Clients in WRHA, 2002-2015
The changes over time in the WRHA’s Home Care clients’ clinical profile have resulted in a
significant increase in overall client complexity and care needs. Figure I.10 provides a view of this
change in clients based on two key indicators:
1) Clients who are screened as high or very high (scores of 4 & 5) on the MAPLe algorithm
(Method for Assigning Priority Levels (Hirdes et al., 2008)); a client’s MAPLe score can be
used to prioritize clients needing community- or facility-based services and to help plan
allocation of resources. Clients who are screened as high or very high on the MAPLe
algorithm are at the greater priority levels and are at higher risk for adverse outcomes.
These clients are more likely to be admitted to a long-term care facility and their caregivers
are at greater risk for stress;
2) Clients’ at risk for institutionalization in a long-term care facility, identified from the risk
indicators identified in RAI-HC assessments.
Over the past 14 years, the proportion of long-stay home care clients in the WRHA who are
high/very high in priority for care based on the MAPLe score has steadily and significantly
increased, rising from 27% of clients in 2002 to 36% of clients in 2015. A nearly identical
prevalence and increase in the proportion of home care clients who are at risk to be placed in
long-term care was found over the same time period (Figure I.10). Currently over one-third of
clients have greater and more complex care needs that place them at greatest need for community
care and even at risk for needing to be cared for in a residential setting.
23Figure I.10: Prevalence of High/Very High MAPLe Scores and Risk for Institutionalization,
Long-Stay HC Clients in WRHA, 2002-2015
With the change over time in the clinical make-up of home care clients, not surprisingly there is a
change in the informal caregivers as well. The prevalence of caregiver distress has increased,
most notably among caregivers who live with the clients. Shown in Figure I.11, the rate of distress
for caregivers who live with the client rose from 22% in 2002 to 26% in 2015.
Figure I.11: Prevalence of Caregiver (CG) Distress, by Live-In Status with Client, WRHA
2002-2015
The review of the clinical profile of home care clients in Manitoba’s largest health region identifies
that clients in Winnipeg have changed significantly in a 14-year period in several key areas. It is
likely that similar client change is being experienced in the other Manitoba regions as well. The
overall result is that clients in home care today present with higher rates of cognitive impairment,
24physical impairment, mental health issues, multimorbidities and care needs, which subsequently
puts them at greater risk for institutional placement and their caregivers at greater risk for
distress.
These clinical developments increase the pressure on home care, and point to areas where
increased resources and support for staff may be needed, such as education to better manage and
care for clients with cognitive and mental health needs, or education to clients and caregivers for
management of chronic disease and increased caregiver support. The clinical changes
experienced by home care clients also have implications for home care in the future. The next
section of the report examines some of those potential scenarios as Manitoba’s population
continues to age.
C. Home Care Projections
The previous sections of the report identified that Manitoba’s demographic composition has
changed, and that home care clients have changed as well. Considering the population projections
displayed for Manitoba, what may the future of home care service provision look like? To examine
this question, this section of the report combines home care data with population projections to
make projections specific to home care and to examine what home care demand may be like in the
coming decades. It is vitally important to appreciate what the future may hold for home care in
Manitoba so that appropriate policies and programs can be developed.
The following home care projections serve to offer insight into future home care scenarios; they
are in no way meant to accurately predict the future of home care but instead provide illustration
of a possible future with the service based on what is currently known in the province. As such,
the projections reported here should be considered as indicators of likely future home care
demands and expenditures if home care policies are unchanged and the drivers of demand remain
unchanged, i.e., if current status quo in home care is maintained. In this manner, such projections
can provide understanding into how to prepare for possibilities, as well as what may need to be
done to shift towards a more preferable future for home care.
Projection Methods
Various forms of home care prevalence data were combined with the Manitoba population
projections produced by Yan and colleagues (2014). Specifically, to project the various home care
indicators, age- and sex-specific rates in the home care data were multiplied by the age- and sex-
specific population projections produced for Manitoba. Sensitivity analysis was conducted by
varying the population projections available (low-growth scenarios, medium-growth scenarios,
and high-growth scenarios) with home care data. The projections provided in this report are
based on medium-growth population projections only since the low-growth and high-growth
scenarios did not yield drastically different results due to similar projections for older adults (the
primary consumers of home care services) regardless of the scenario (see Figure I.4). Moreover,
the Manitoba Bureau of Statistics (2015) also assumed in their report that a medium-growth
scenario was most likely to occur for Manitoba.
25You can also read