FY2020 Results Presentation
12 months ended 30 June

30 October 2020
←
→
Page content transcription
If your browser does not render page correctly, please read the page content below
FY2020 Results Presentation 12 months ended 30 June 30 October 2020
Content

                          Notice:
01 Business Overview      This announcement has been prepared by the Company and its contents have been
                          reviewed by the Company’s Sponsor, Hong Leong Finance Limited. It has not been examined
02 Business Highlights    or approved by the Exchange and the Exchange assumes no responsibility for the contents
                          of this announcement, including the correctness of any of the statements or opinions made,
                          or reports contained in this announcement.
03 COVID-19 Updates
                          The contact person for the Sponsor is Mr Kaeson Chui, Vice President, at 16 Raffles Quay,
                          #01-05 Hong Leong Building, Singapore 048581, Telephone (65) 6415 9886.
04 Financial Highlights
05 Outlook & Plans
    Q & As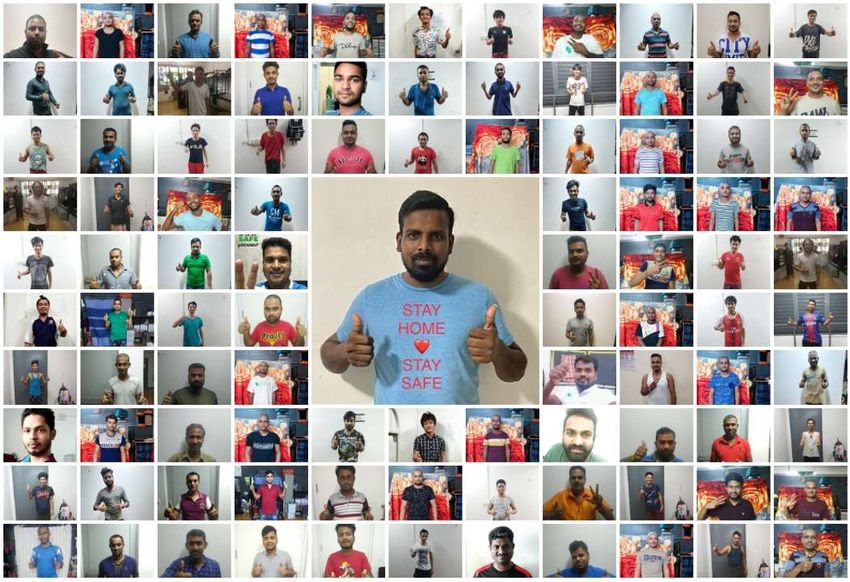
01
Business Overview

                    3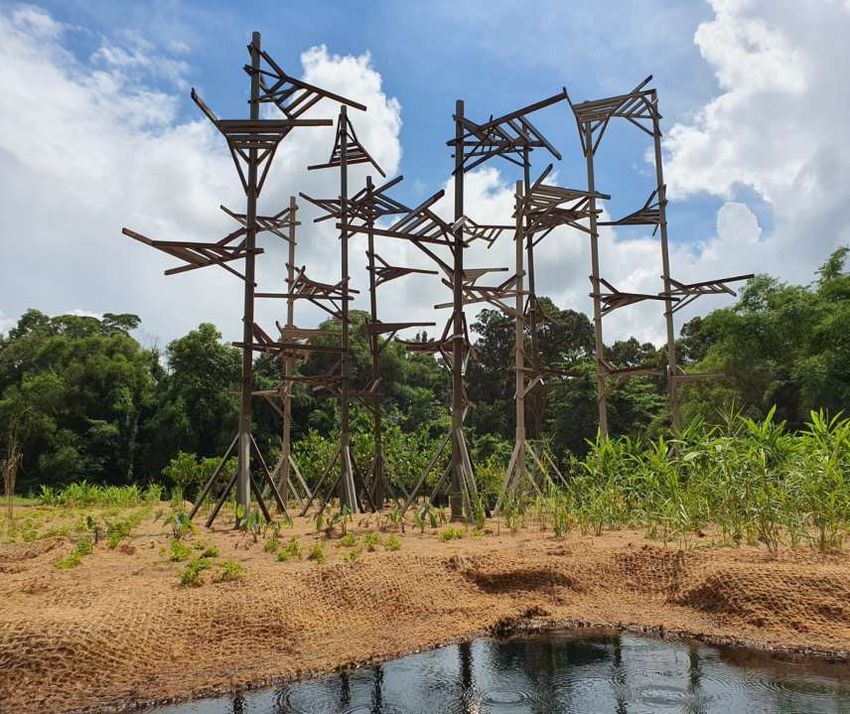
About Us

Established in 1998, we are a leading R&R, A&A and
complementary niche specialist services provider for
                the built environment
                                                                   >500                        >5,000
                                                                   projects                    buildings
    Founded in Singapore, with a reputation for
             eco-conscious solutions

                         • 20+ year track record                    •   Industry recognised safety and
         Competitive
                         • One-stop provider with multi-                management systems
         Strengths
                           disciplinary capabilities                •   Broad and growing range of services
                         • Established stakeholder relationships    •   Early mover in green solutions
                         • Experienced and professional             •   Leading brand focused on growth
                           management team                              and innovative solutions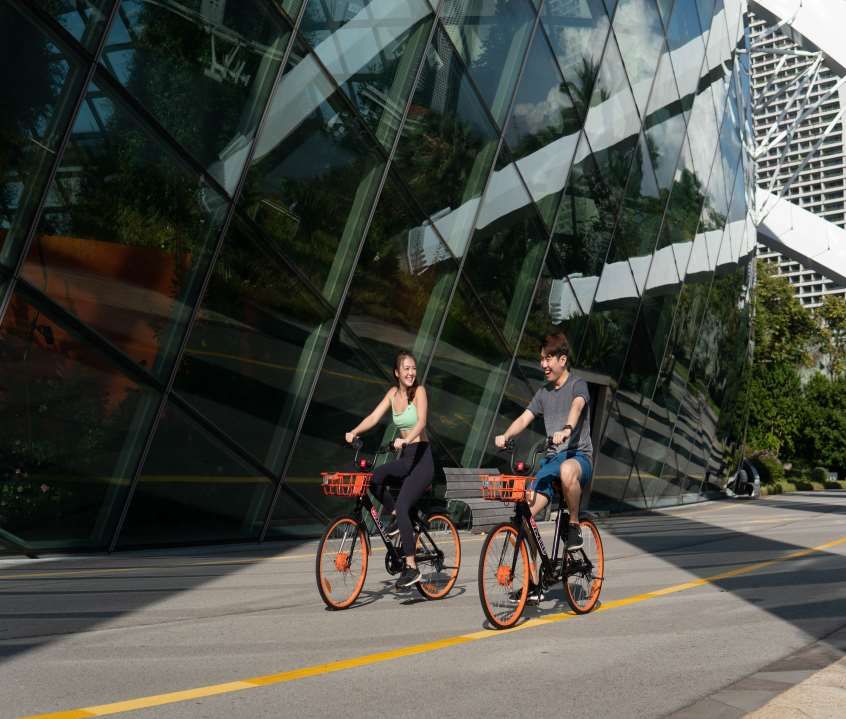
Multi-disciplinary Capabilities
                   We provide sustainable solutions for a better built environment

                            Value                                              Design & Build
                                                                                 Solutions:                                                      Project
                        Engineering:
   Life Cycle                                          Energy                  Architectural,               Green Mobility                    Management &
                           Project
 Maintenance                                        Management              Interior Design, Fit-           Products: Bike                     Construction
                      management and
Solutions: R&R                                     Solutions: M&E             out, Engineering                 sharing                         Management
                      buildability advice

                 02                         04                        06                            08                           10

    01                       03                           05                        07                            09                               11

           Property/Estate        Integrated Facilities           Electrical &                 Environmental                   Renewable
            Enhancement              Maintenance                  Mechanical                   Sustainability                    Energy
              Solutions:               Solutions:                Engineering                     Solutions:                   Installation:
            A&A and C&P             Landscaping and             Solutions: M&E                CnO, Eco-friendly               Rooftop and
                                       Handyman                                                   products                   Floating solar
                                                                                                                                systems

5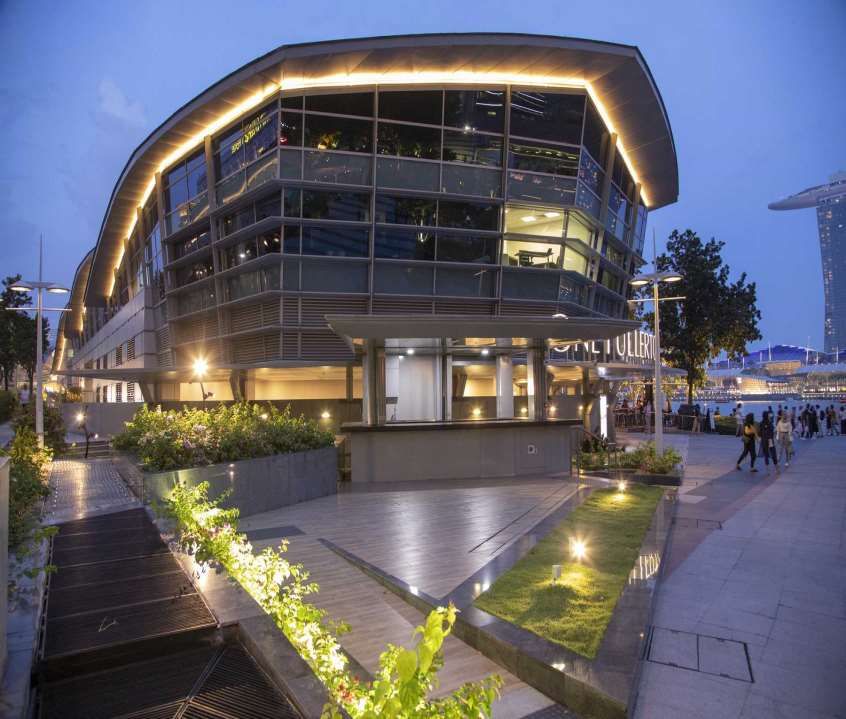
Corporate Structure (as of 30 June 2020)
Raymond Construction Pte Ltd Addition & Alteration 100%
ISO-Team Corporation Pte Ltd Addition & Alteration; Repair & Redecoration 100% Subsidiaries at the time of
listing in 2013 involved mainly in
TMS Alliances Pte. Ltd. Repair & Redecoration 100% R&R- and A&A- related works
ISOTeam Green Solutions Pte. Ltd. Eco-friendly solutions/ products 100%
Zara @ ISOTeam Pte. Ltd. Interior fitting-out works 51%
ISOTeam Access Pte. Ltd. Rental/ sale of height access equipment 100%
ISOTeam C&P Pte. Ltd. Specialist coating & painting 100%
ISO-Landscape Pte. Ltd. Niche landscaping; Horticulture services; Gardening/landscape maintenance (condominiums) 100%
ISOTeam Projects Pte. Ltd. Specialist addition & alteration; architectural and commercial interior design 100%
Growth and expansion through
ISO Integrated M&E Pte. Ltd. Electrical works; Renewables installation and energy management contracts 100% the years
ISOTeam Homecare Pte. Ltd. Provision of handyman services 100%
ISOTeam (TMS) Myanmar Limited* (A subsidiary of TMS Alliances Pte. Ltd.) Repairs & Redecoration in Myanmar 90%
SG Bike Pte. Ltd. Singapore’s first locally established bike sharing company 51%
ISO-Homecare Pte. Ltd. ISOHomeCare handyman portal 51%
Pure Group (6 companies)1 Project and construction management in the region 100%
1. Pure Group (Singapore) Pte. Ltd. in Singapore (100%-owned), Pure Projects (Philippines) Inc in the Philippines (99.9%-owned), Pure Projects Construction Advisory Shanghai Co Ltd in China (100%-owned), Pure
Projects Management Sdn. Bhd. in Malaysia (100%-owned), Pure Projects SEA Pte. Ltd. (100%-owned), and Pure Projects SEA Ltd in Thailand (49%-owned).
6
02
Business Highlights

                      7
A Recap of FY2020

    Bolstering              Enhancing market                Keeping the                                                Operating in a
regional presence            competitiveness                momentum                    Onset of Covid-19              ‘new normal’

                                                                   • Wins new contracts: $20M     • New contracts: $32.5M       • Disposal of 57 Kaki Bukit
             • Proposed acquisition    • New contracts: $35.4M
                                                                   • Completes acquisition of     • Completes issuance of         Place for $4.5M
               of Pure Group           • Commencement of
                                                                     Mobike assets and Pure         TOC warrants and shares     • New contracts: $20.9M
             • Proposed acquisition      fundraising activities
                                                                     Group                        • Completes acquisition of    • Strengthened balance
               of Mobike assets        • Proposed issuance of
                                                                   • Completes placement of 50M     TOC’s shares in IME           sheet with asset
             • New contracts: $20.3M     TOC warrants and shares
                                                                     new shares                     (34.1%) (via 12.5M            disposal and fund
             • New contracts: $31.0M
                                                                   • Appoints new CFO and Non-      consideration shares)         raising
                                                                     Executive Director

     1Q20                       2Q20                         3Q20                           4Q20                        1Q21
    (Jul-Sep 2019)             (Oct-Dec 2019)             (Jan-Mar 2020)                  (Apr-Jun 2020)               (Jul-Aug 2020)

8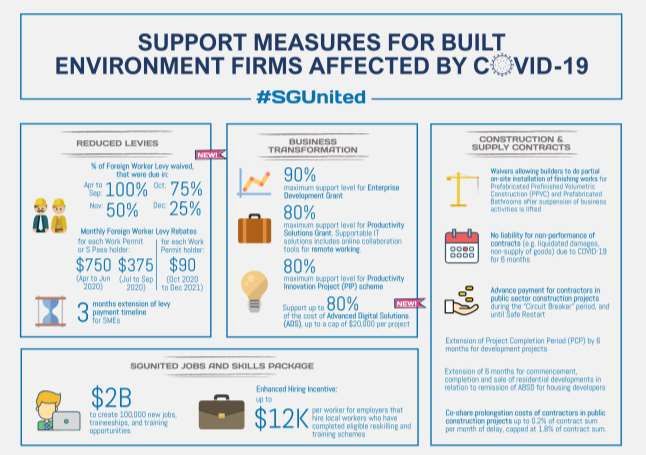
Showcase: Completed Projects

          Bendemeer Road
                                                        18 blks at Kim Tian &                                    29 blks at
          Market & Hawker     8 blks at Circuit Road                            14 blks at Lor 8 Toa Payoh                         Various residential homes
                                                          Jln Bukit Merah                                    Rivervale Cres./Dr.
              Centre
    R&R

          NRP works at Woodlands St 41             NRP at Circuit Road             NRP at Bishan St 22                       One Fullerton
    A&A

9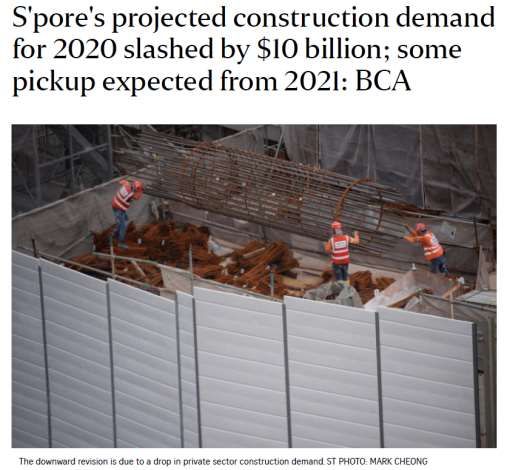
Showcase: Completed Projects

                   JTC Cleantech                         Dulwich College                  Hub Synergy           Tuas Dormitory
     C&P

                                                                           Offshore Grid-Tied Solar
           Bedok Market            Fernvale Childcare Centre                                            Temasek Polytechnic
                                                                            Photovoltaic System
     M&E

10
Showcase: Completed Projects
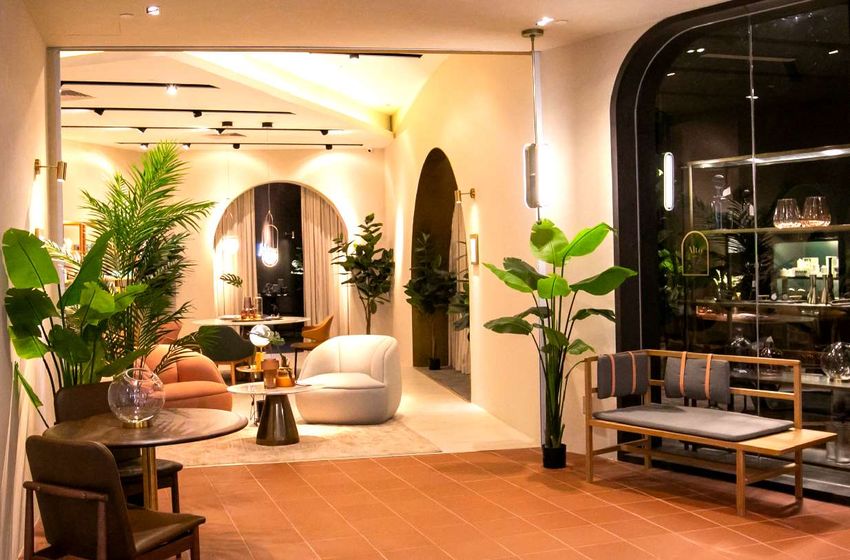
Work & store Various residential Commune Showroom in
YWCA Wealth mgt. firm
building homes Johor Bahru
ID
Floating Wetland at Pulau Ubin Various Town Council Maintenance
Bedok BTO Project: Roof Top Garden
Pekan Quarry Lake Projects
LANDSCAPING
11Showcase: Pure Group
Thailand Malaysia China The Philippines Singapore
• Frasers at the Park TC • IPC Shopping Mall, Kuala • Taubman City (Static TC), • IKEA Mall of Asia, • BWID Germany
Langat Zhengzhou Manila • Swarovski, Pavillion, KL
• Toppen Shopping Centre, • IKEA Pasay City, Manila
JB • Taubman City (Static TC),
• IPC Shopping Mall, KL Xi’an
• Zurich Insurance Design
ON-GOING
and Build
12Summary: Ongoing Projects
FY2019 FY2020
Number Value (S$’m) Number Value (S$’m)
R&R 25 61.9 30 71.5
A&A 17 101.2 26 150.1
C&P 65 32.8 113 33.6
Others 47 39.5 38 56.4
Total contract value of ongoing projects - 235.4 - 311.6
1303
Covid-19 Updates
14Impact of COVID-19
Control Measures
• Singapore
- Closure of non-essential workplace premises in Singapore (Circuit Breaker): 7 April – 1 June 2020
- Stay-home-notice for work permit and S Pass holders in the construction sector: 20 April – 18 May 2020
• Malaysia - Movement Control Order in Malaysia: 18 March – 9 June 2020
• China - Staff, workers and subcontractors unable to return to Singapore after the Chinese New Year when the outbreak began in
China: February – June 2020
Operational Impact
• Closure of workplace during the Circuit Breaker period but able to continue providing certain essential services to customers
• Even after the Circuit Breaker was lifted, closures of workplace and project sites were prolonged to end July
• Slow-down in project tenders, the award and execution of projects
• Disruption of raw materials supply chain
• Disruption to the supply and work of sub-contractors and outsourced partners
Financial Impact
• Significant decline in 2H revenue and earnings partially offset by government financial aid
• Longer collection period during the closure periods with some default of accounts receivables
• Cash flow from operating activities still positive
15Measures to Mitigate Impact of COVID-19: On Operations
Re-scheduling, execution and Ongoing safe distancing Expedited digital Review of policies and
extension for affected projects measures at the workplace and transformation & adoption processes
and other operational work sites
constraints • Developing an App or Device for virtual • Business units
site inspection & management • SOPs
• Rostered Routine Testing (swab test) • Also to track workers’ movements for • Internal controls
• Re-scheduling of the delivery • Dormitory clearance before workers more effective deployment and • Cash and risk management
dates of certain materials and are permitted to work increase productivity/efficiency post
equipment eg playground and • Dedicated Safe Management Officer Covid-19 • Staff leadership development
fitness equipment, electrical and Safe Distancing Officer • On-site videos in the App to be made • Skill upgrade and training
fixtures • SafeEntry (employees and visitors) into case studies for staff training
• TraceTogether (employees) • Operational Audit Committee
• Temporary suspension of service • Use of masks or face shields • Other digitisation moves: e-Inventory |
agreements with certain vendors • Temperature taking twice a day e-Purchase | e-Marketing | e-SafeEntry
eg rental of excavators and • Staff briefings on personal hygiene | e-Invoice | e-Payment | e-Inspection
portable toilets, and security • SOP for unwell workers / suspected | e-Report
services cases
16Measures to Mitigate Impact of COVID-19: On Financials
Job Support Scheme Wage Support Foreign Worker Levy (FWL) Waiver FWL Rebates (Per S-Pass & Work Permit Holder)
Government
support 75% (Jun - Aug 2020) 100% (Jun - Sep 2020) $750 (Jun 2020)
measures 50% (Sep - Oct 2020) 75% (Oct 2020) $375 monthly (Jul - Sep 2020)
30% (Nov 2020 - Mar 2021) 50% (Nov 2020) $90 monthly (Oct 2020 - Dec 2021)
- 25% (Dec 2020) -
$1.36 Billion Construction Support Package
• Co-fund 50% of Safe Management Officers’ (SMOs) salaries (Sep 2020 – Feb 2021)
• Construction Restart Booster to help firms defray costs of complying with COVID-Safe requirements
• Project-based: Support up to 1.5% of project value for projects over $100,000 (capped at max. support of $150,000)
• Firm-based: Provide $400 per construction worker (one-off)
• Co-share 50% of prolongation costs for public sector projects, capped at 1.8% of contract sum
• Leases for commercial equipment to be covered by temporary relief law (Jun – Oct 2020)
• Negotiations with relevant financial
Cost institutions on extending repayments
Submission of advance
tightening • Exploring other financing options and project claims to several
controls Government-assistance clients as per the BCA’s
• Prudent balance sheet management
• Defer all non-critical expenditures
guidelines
17Snapshot of Government Support Measures for the Built Environment
1804 Financial Highlights
Revenue

               Revenue (S$’m)                                                      By Business Segments (S$’m)

                                 136.6

                                                            FY2020 (S$’m)                                 FY2019 (S$’m)

     94.1                                91.7
                82.9     83.8
                                                        22.0                                              27.2       27.3
                                                                            26.3
                                                        24%                                               20%        20%
                                                                            29%        R&R                                  R&R
                                                                                       A&A         14.4                     A&A
                                                     11.3                              C&P         10%                      C&P
                                                     12%
                                                                                       Others                               Others
                                                                    32.1                                            67.7
                                                                    35%                                             50%
      FY16

                 FY17

                          FY18

                                  FY19

                                          FY20

                                                 ▪     R&R ↓3.6% yoy
                                                 ▪     A&A ↓52.6% yoy
     ▪       Full year: ↓32.9% yoy
                                                 ▪     C&P ↓21.5% yoy
     ▪       2H: ↓56% yoy to $27.9m
                                                 ▪     Others ↓19.2% yoy

20
Profit
Gross Profit (S$’m) Net Attributable Profit (S$’m)
24.2 Gross Net Attributable
(%)
21.6 Profit Margin Profit Margin
9.2
6.8
FY16 25.7 9.8
14.7 FY17 17.8 NM
13.0
-0.2 0.5
FY18 15.5 0.6
FY16
FY18
FY17
FY19
FY20
FY19 15.8 4.9
1.9 FY20 2.1 NM
FY16
FY17
FY18
FY19
FY20
▪ Full year: ↓91.2% yoy -19.6
▪ 2H: ↓167.9% yoy to -$7.8m
21Income Statement: Expenses
KEY EXPENSES (S$’M) FY2020 FY2019 Chg (%)
Cost of sales (89.8) (115.0) (21.9)
Marketing and distribution expenses (0.9) (1.2) (24.5)
General and administrative expenses (17.3) (14.8) 17.3
Other operating expenses (6.4) (0.4) NM
Finance costs (1.8) (1.2) 58.0
Any variances in percentage changes are due to rounding
▪ General and administrative expenses: Mainly due to allowance for impairment on trade receivables and professional fees on acquisition of
subsidiaries and assets
▪ Operating expenses: Mainly due to impairment of goodwill and contract assets
▪ Finance costs: Mainly due to increase in borrowings due for working capital for some sizable projects
22Key Financial Highlights
KEY HIGHLIGHTS FY2020 FY2019
PROFITABILITY RATIOS
Earnings Per Share(1) (cents) (6.46) 2.37
Return On Assets (%) (17.9) 5.1
Return On Equity (%) (44.1) 10.6
BALANCE SHEET S$’m S$’m
Current assets 70.8 78.9
Cash and bank balances 12.6 9.0
Net current assets 13.3 29.1
Net assets 48.6 59.6
CASH FLOWS S$’m S$’m
Operating cash flows before working capital changes (7.5) 13.9
Cash generated from / (used in) operations 10.1 (10.0)
Net cash generated from / (used in) operating activities 9.8 (10.8)
Net cash used in investing activities (12.1) (1.2)
Net cash generated from financing activities 6.0 7.9
(1) Weighted average number of ordinary shares: FY2020: approx. 303.1 million shares; FY2019: approx. 284.7 million shares
23Order Book Trend
S$165.7 million book orders as at 30 September 2020 largely to be progressively delivered over the next two years
• Construction progress may be impacted by the implementation of and compliance with COVID-19 measures
165.7
132.8 133.3
126.3
110.8 113.5
107.1
95.8
84.6 86.4
80.7
72.1 70.3 73.4
44.1
16.4
1HFY17 @26 Jan 2HFY17 @18 Aug 1HFY18 @31 Jan 2HFY18 @10 Aug 1HFY19 @31 Jan 2HFY19 @31 Jul 1HFY20 @31 Jan 2HFY20 @30 Sep
New projects secured during the period (S$'m) Order book value (S$'m)
2405 Outlook & Plans
Sustainable Demand Fundamentals Post Covid-19: Government Initiatives for the
                 Built Environment

     01                  02              03              04                05               06                07

  TOWN                  HDB            NPARKS        NEA & HDB           MND                LTA        NPARKS & TOWN
 COUNCILS                                                                                                 COUNCILS

   Repaint          Neighbourhood    Round Island   Hawker Centre     Expanded HIP       Upgrading /     Development,
external walls         Renewal          Route         Upgrading     Scheme and HIP II   A&A works to    maintenance &
every 5 years      Programme every   Programme       Programme                          MRT stations   upgrading of parks
(R&R project          12-15 years
    cycle)

                                                                                                              26
Sustainable Demand Fundamentals Post Covid-19: Greening Trends
Green Mark
• 80% of buildings to be
certified with BCA
Green Mark by 2030
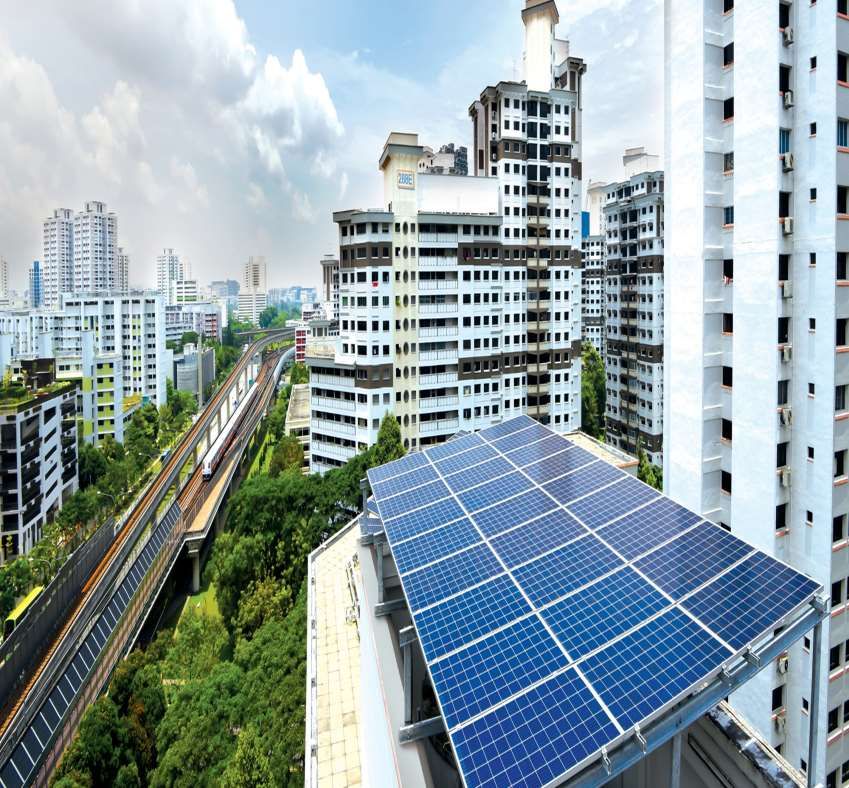
SolarNova LUSH
• City in the Garden identity
• 2030 solar power targets • Urban farming and rooftop garden
raised in Oct 2019 • 200 ha of high-rise greenery by 2030
• 540 MWp (HDB)
• 2 GWp (National)
HDB Green Print
• Roadmap to Better Living in HDB Town using Green
Offshore Floating Building Technology like Cool Paint and Community
Garden and Cycling Path Network for a Greener and
Solar Farms
Cooler Neighbourhood
• Joint-effort with HDB
and leverage on ESG
Bike Sharing
• URA to triple cycling paths and park connectors
to 1,320km by 2030
• Catering to diverse local needs
• Focus on recreational and leisure business
• Supporting LTA’s car-lite initiative
27Continued Commitment by the Government and Industry Towards Greening
Business Times, 20 August 2020 The Straits Times, 27 August 2020 The Straits Times, 27 October 2020 The Straits Times, 27 October 2020
More buildings here going Addendum to President's Address: MND Singapore unveils greener Solar panels on rooftops or floating
greener as 376 projects bag to raise construction productivity,
energy plan water may be a common sight soon
support public housing needs
BCA's Green Mark Award
• Singapore to ramp up its efforts
to install more solar panels here,
• Government to develop and invest in and invest in research on low- • Singapore aims to harness 1.5 GWp
• Indicative of the industry's infrastructure even amid Covid-19 of solar energy by 2025, almost four
awareness of the positive carbon energy solutions.
• Roll out the next Green Building • A trial to import electricity from times the current solar usage of 390
impact of green buildings Masterplan, raise building sustainability MWp
• Number of non-residential Malaysia, which could pave the
standards way for more renewable energy • This new target will accelerate
building projects obtaining • Adopt advanced building technologies Singapore’s goal to employ 2GWp of
higher tier Green Mark imports from other nations in the
for cleaner, higher quality, and less region solar energy by 2030.
certification has doubled to manpower-intensive construction
149 over the past five years • To drive research, innovation and
digitalisation across the built
environment value chain 28Construction Industry Recovery Expected from 2021
Straits Times, 17 September 2020 Value of contracts awarded (S$ billion)
Year Public Private Total
2019 19.03 14.5 33.52*
2020 (F) 11-14 7-9 18-23
• BCA has cut 2020 forecast for projected construction
demand by about S$10B to between S$18B-S$23B due to a
drop in private sector demand and postponements in the
award of some public sector projects
• 2020 forecast for public sector contracts is S$11B to S$14B
while the private sector is S$7B to S$9B.
• Construction demand is expected to recover to some
extent from 2021 supported by public residential projects,
new healthcare facilities and various infrastructure projects
29WHERE WE STAND NOW
WORK HAS GRADUALLY RESUMED SINCE JUNE 2020
• All projects/worksites have restarted to-date but pace is slow due to COVID-19
01 •
measures
Supporting our subcontractors with COVID-19 resources to start work safely
ORDER BOOK HEALTHY & INTACT FOR THE NEXT 12-18 MONTHS
• No cancellations of existing projects
02 • Active and robust tender book
SUFFICIENT WORKING CAPITAL FOR OPERATIONAL NEEDS AND FINANCIAL
COMMITMENTS
• Fundraising and asset disposal completed
03 •
•
Cash of $12.6 million as at FY2020
Temporary bridging loans from banks secured
PREPARING FOR THE NEW NORMAL
• New Crisis and Risk Management Committee @ ISOTeam
• Tech-based solutions to reduce labour reliance eg App for virtual inspection
04 • Exploring new business niches – Virtual Project Management, Drone inspection &
supervision, e-ReportsStrategic Action Plan
PRUDENCE SYNERGY SUSTAINABILITY
• Manage liquidity and • Harness and pool resources through • Protect jobs of employees and workers
costs prudently digitalization and leverage on a powerful who are our assets
Intranet platform.
• Monitor and minimise risk • Cultivate a motivated skilled workforce
exposure • Tap on multi-disciplinary capabilities to to drive financial success and enhance
cross sell services and improve efficiency digital capabilities
• Protect health and safety • Protect the sustainability of our
of workforce • 3-in-1 or 4-in-1 packages to key customers operations in the near and mid-term
• Explore strategic partnerships in the
longer term
31Investment Merits
1 Track Record 2 Network 3 Capabilities 4 Team 5 Future
• An industry leader • Established • Multi-disciplinary • An experienced and • Strong order book
with a 20-year track stakeholder services professional ($165.7M @ 30 Sep
record relationships • Able to handle a wide management team 2020)
• Defensive business • Exclusive applicator spectrum of projects • Industry leading • Upside from new
with 70% of business for Nippon Paint • Evolved into a green operational team at business units
from Singapore Singapore and SKK solutions provider the forefront of • Tapping into new sectors
government bodies (S) Pte Ltd • Turnkey capabilities evolving market • Positive prospects in
from design trends Singapore
inception to project • Overseas expansion
completion • Lower default risk
• Minimum dividend
payout of 20% of net
profit
32Thank You
Q & As
33You can also read