SGX-Haitong Securities Singapore Corporate Day - 9 September 2021
←
→
Page content transcription
If your browser does not render page correctly, please read the page content below
SGX-Haitong Securities
Singapore Corporate Day
9 September 2021
Important Notice
The past performance of Keppel Pacific Oak US REIT is not necessarily indicative of its future performance. Certain statements made in this
release may not be based on historical information or facts and may be “forward-looking” statements due to a number of risks,
uncertainties and assumptions. Representative examples of these factors include (without limitation) general industry and economic
conditions, interest rate trends, cost of capital and capital availability, competition from similar developments, shifts in expected levels of
                                                                                                                                                   Content Outline
property rental income, changes in operating expenses, including employee wages, benefits and training, property expenses and
governmental and public policy changes, and the continued availability of financing in the amounts and terms necessary to support future
business.
                                                                                                                                                    Overview                               3
Prospective investors and unitholders of Keppel Pacific Oak US REIT (Unitholders) are cautioned not to place undue reliance on these
forward-looking statements, which are based on the current view of Keppel Pacific Oak US REIT Management Pte. Ltd., as manager of
                                                                                                                                                    1H 2021 Key Highlights                 11
Keppel Pacific Oak US REIT (the Manager) on future events. No representation or warranty, express or implied, is made as to, and no
reliance should be placed on, the fairness, accuracy, completeness or correctness of the information, or opinions contained in this release.        US Office Market Overview              19
None of the Manager, the trustee of Keppel Pacific Oak US REIT or any of their respective advisors, representatives or agents shall have any
responsibility or liability whatsoever (for negligence or otherwise) for any loss howsoever arising from any use of this release or its contents
or otherwise arising in connection with this release. The information set out herein may be subject to updating, completion, revision,              Additional Information                 24
verification and amendment and such information may change materially. The value of units in Keppel Pacific Oak US REIT (Units) and the
income derived from them may fall as well as rise. Units are not obligations of, deposits in, or guaranteed by, the Manager or any of its
affiliates. An investment in Units is subject to investment risks, including possible loss of principal amount invested.
Investors have no right to request the Manager to redeem their Units while the Units are listed. It is intended that Unitholders may only deal
in their Units through trading on Singapore Exchange Securities Trading Limited (SGX-ST). Listing of the Units on SGX-ST does not
guarantee a liquid market for the Units.
The information relating to the US office market are extracted from reports prepared by CoStar. CoStar has not consented to the inclusion          Constituent of:
of the information quoted above and is thereby not liable for such information. Whilst reasonable action has been taken to ensure that the
above information is reproduced in its proper form and context, and that the information is extracted fairly and accurately, neither the
                                                                                                                                                                     MSCI Singapore Small Cap Index
Manager nor any other party has conducted independent review of the information obtained from CoStar nor verified the accuracy of the
contents of the relevant information obtained from CoStar. As such, the information from CoStar may not be comprehensive, and while they
are believed to be accurate, such information is not guaranteed to be free from error, omission or misstatement. In addition, the information                        FTSE EPRA Nareit Developed Index
obtained from CoStar does not purport to contain all the information that may be required to evaluate the business and prospects of KORE                             FTSE All World Small Cap Index
or any purchase or sale of the units in KORE. Any potential investor should conduct his, her or its own independent investigation and                                FTSE ST Singapore Shariah Index
analysis of the merits and risks of an investment in KORE.

                                                                                                                                                                                                2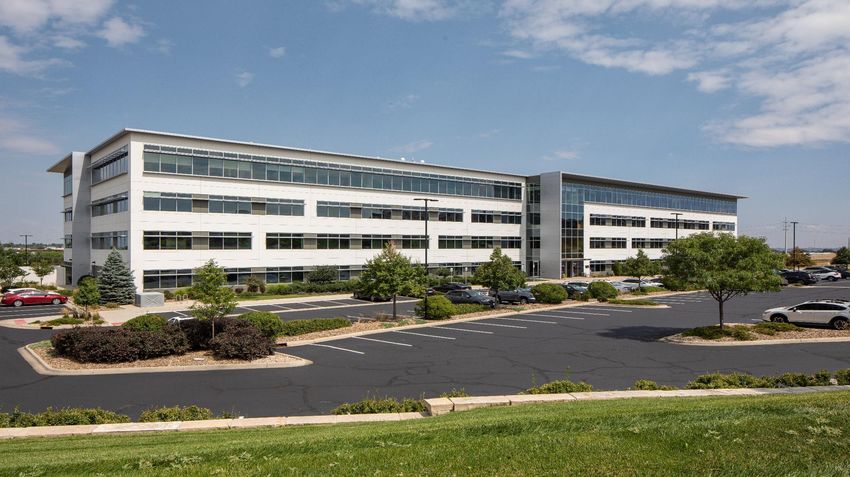
Overview

105 Edgeview
Denver, Colorado
Keppel Pacific Oak US REIT                             Sponsors      • Keppel Capital and KORE Pacific Advisors
                                                                        (“KPA”)
(KORE)
                                                       US Asset      • Pacific Oak Capital Advisors LLC, also advisor
                                                       Manager          for Pacific Oak Strategic Opportunity REIT

First choice US office SREIT focused                   Manager       • Keppel Pacific Oak US REIT Management
                                                                        Pte. Ltd.
on the fast-growing tech sector
across key growth markets in the US                    Investment
                                                       mandate
                                                                     • To invest in a diversified portfolio of
                                                                        income-producing commercial assets and
                                                                        real estate-related assets in key growth
                                                                        markets of the US with favourable
                                                                        economic and office fundamentals

                   Benefitting from                    Distribution   • Semi-annual distributions
 Unique exposure
                   the defensive      Tax advantaged   Policy         • Distributions declared in US dollars;
 to key US
                   sectors of tech    structure        & Distribution   Unitholders have the option to receive
 growth markets
                   and healthcare                      Currency         distributions in Singapore or US dollars
                                                                        (by submitting a ‘Currency Election Form’)
                                                                        and opting out of CDP’s Currency Conversion
                                                                        Service

                                                                                                                 4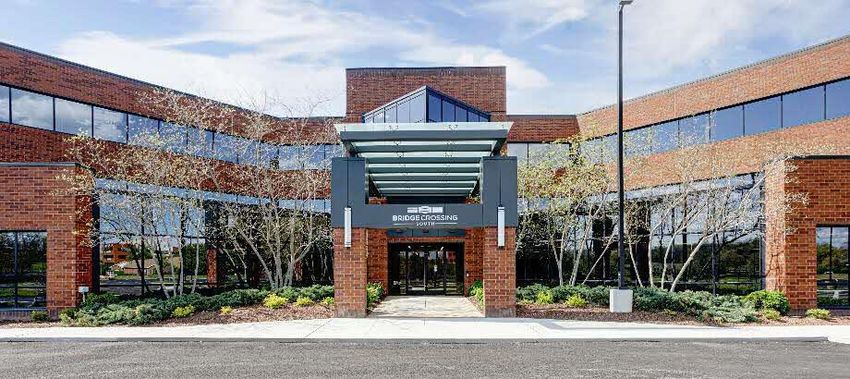
Successful Execution of Growth Strategy
9 Nov 2017: Listed on SGX                    Jan 2019                                                                         Aug 2021
IPO with 11 office buildings                 Strengthened foothold in the                                                     Completed the strategic
and business campuses across                 strong Maitland submarket                                                        acquisitions of Bridge Crossing in
7 key growth markets                         with acquisition of Maitland                                                     Nashville, Tennessee, and
                                             Promenade 1 in Orlando, Florida                                                  105 Edgeview in Denver, Colorado

                 Maiden acquisition of                                                                  Extended footprint into new key
                 The Westpark Portfolio in                                                              growth market with the acquisition of
                 Seattle – Redmond, Washington                                                          One Twenty Five in Dallas, Texas
                 Nov 2018                                                                                Nov 2019

                  Distributable Income (US$ million)                                                                        DPU (US Cents)

                                           58.6                                                                              6.016.01           6.23 6.23
                            50.8
                                                         50.8
          38.6                                                                                           4.58
                                                                                                           4.58
                                   38.6    29.5                                                                              3.01               3.13
                            26.0
                                                                 29.9         2H                                                                                   3.16        2H
          19.7                                                                                            2.34
                                                                              1H                                                                                               1H
                            24.8            29.1                 29.9                                                        3.00               3.10               3.16
          18.9                                                                                            2.24

        FY 2018          FY 2019          FY 2020               1H 2021                                Adjusted
                                                                                                       FY 2018
                                                                                                       FY 2018(1)         FY 2019            FY 2020            1H 2021

                                                   (1)    Adjusted Actual FY 2018 was calculated based on the weighted average number of Units for FY 2019 of 843,917,481 Units to   5
                                                          remove the effects of the enlarged Unit base in FY 2019 for comparison purpose.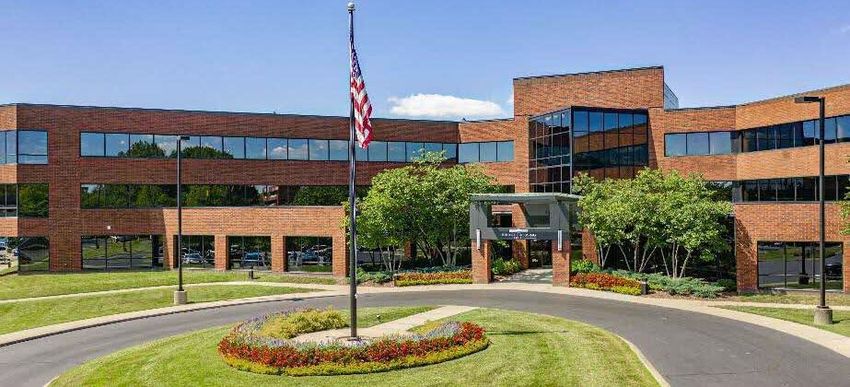
Deepening Tech Footprint in Nashville and Denver
Expanding KORE’s portfolio in key growth markets in the US
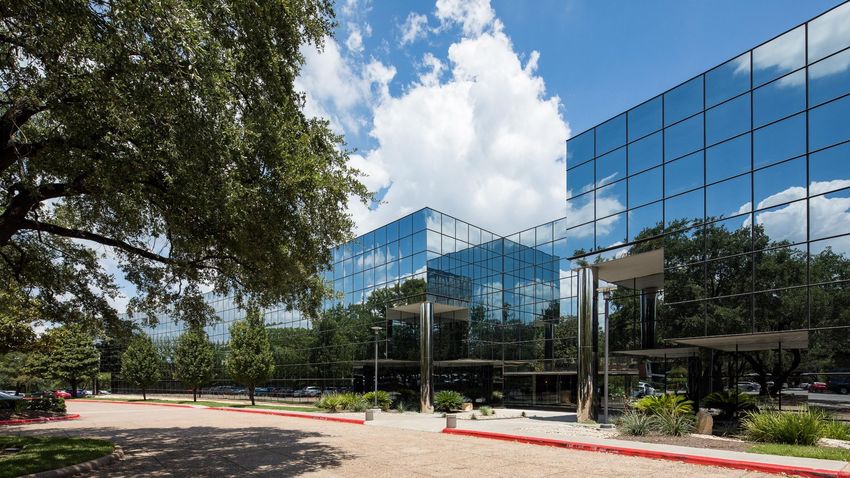
Overview Bridge Crossing 105 Edgeview
Key Growth Market Nashville, Tennessee Denver, Colorado
Submarket Brentwood Broomfield
Land Tenure Freehold Freehold Bridge Crossing, Nashville, Tennessee
Occupancy 100% 100%
WALE(1) 5.7 years 6.6 years
NLA 199,194 sf 186,231 sf
No. of Tenants 2 8
2017 (Refurbished)
Year Built 2012
Built in 1989
Pro forma NPI yield 7.8% 6.7% 105 Edgeview, Denver, Colorado
Information as at 30 June 2021.
(1) Weighted average lease term by net nettable area
6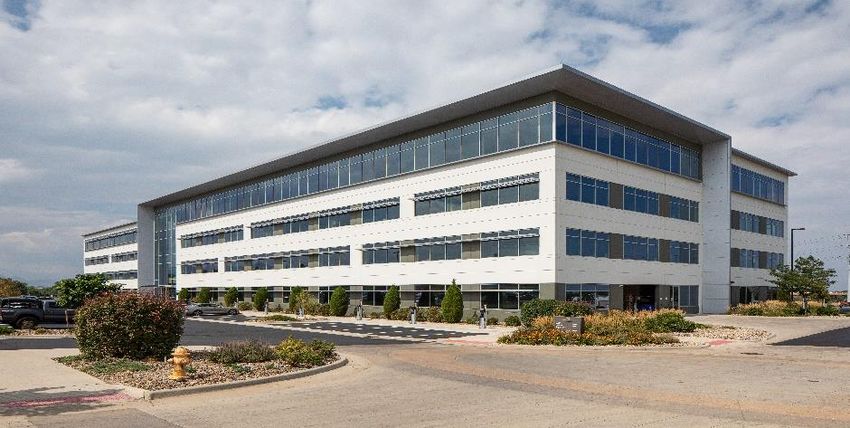
Deepening Tech Footprint in Nashville and Denver
Key Investment Highlights

      Deepens presence in key growth markets driven
 1
      by tech and innovation, which will enhance
      income resilience

      Prime locations in key submarkets with limited
 2
      upcoming supply

                                                          Bridge Crossing, Nashville, Tennessee
      DPU-accretive acquisitions that strengthen
 3
      KORE’s distributions and total Unitholder returns

 4    Augments KORE’s green footprint

      Enhances KORE’s weightage in current indices
 5
      and positions for further index inclusions               105 Edgeview, Denver, Colorado

                                                                                          7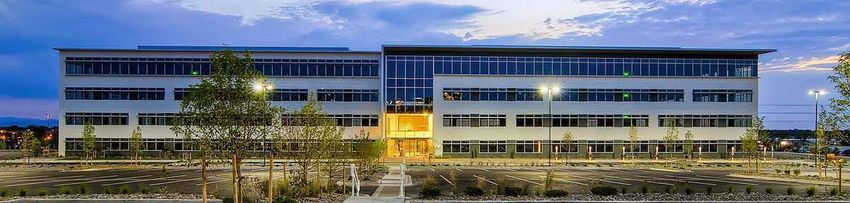
SEATTLE – BELLEVUE/REDMOND, Washington                                                         ATLANTA, Georgia

Key Growth                                                                                                                           Powers Ferry                      Northridge Center I & II

Markets
                                       The Plaza                   Bellevue                  The Westpark
                   (1)                 Buildings                   Technology Center         Portfolio                               Occupancy: 80.1%                  Occupancy: 78.4%
                                       Occupancy: 91.1%            Occupancy: 96.1%          Occupancy: 95.2%
                                                                                                                                                                   NASHVILLE, Tennessee

Driven By                             DENVER, Colorado

Tech And                                                                                                                                                           Bridge Crossing
                                                                                                                                                                   Occupancy: 100%

Innovation
                                      Westmoor Center
                                                                                                                                                                   ORLANDO, Florida
                                      Occupancy: 90.1%
                                                                                                                 z

                                                                                                                                                                   Maitland Promenade I & II
        91.2%(2)                      105 Edgeview                                                                                                                 Occupancy: 94.8%
                                      Occupancy: 100%
        Portfolio                                                                                                                                                  DALLAS, Texas
        Committed Occupancy           SACRAMENTO, California

KORE’s strategic exposure
                                                                                                                                                      One Twenty Five
to tech hubs and tech-tenancy         Iron Point       AUSTIN, Texas                                                                   HOUSTON, Texas Occupancy: 96.6%
                                      Occupancy: 92.6%
provides income resilience
as businesses accelerate their
digital transformation strategies.
                                                                 Great Hills Plaza        Westech 360                                  1800 West Loop South Bellaire Park
                                                                 Occupancy: 100%          Occupancy: 70.0%                             Occupancy: 78.7%     Occupancy: 90.7%
                                                                                (1)   Includes Bridge Crossing in Nashville, Tennessee, and 105 Edgeview in Denver, Colorado,
                                         Tech hub              Healthcare hub         acquisitions of which were completed on 20 August 2021.                                             8
                                                                                (2)   Pro forma portfolio committed occupancy assuming the acquisitions of Bridge Crossing and 105 Edgeview were
                                     All information as at 30 June 2021.              completed on 30 June 2021.
Strengthening Presence In Magnet Cities
Popular in-migration destinations due to attractive lifestyle, culture and employment opportunities
Seattle, Washington
SEATTLE
❖ The Plaza Buildings
❖ Bellevue Technology Center
❖ The Westpark Portfolio
#6
Seattle
Austin, Texas
❖ Westech 360 #2 #1
❖ Great Hills Plaza
Denver, Colorado
❖ Westmoor Center #13 #10
❖ 105 Edgeview
DENVER
Denver
SACRAMENTO
Sacramento
Nashville Nashville, Tennessee
#3
❖ Bridge Crossing
Dallas
Houston, Texas
❖ 1800 West Loop South
Atlanta ❖ Bellaire Park
Austin
AUSTIN
Orlando Dallas, Texas
#4 #2
❖ One Twenty Five
Houston Orlando, Florida
❖ Maitland Promenade I & II
Sacramento, California
New Acquisitions
Magnet
Cities(1)(3)
Super Sun-
Belt Cities(1) 18-Hour Cities(1) ❖ Iron Point
KORE’s Existing
Atlanta, Georgia
#11 #8
Properties #x Top 20 US Markets #x Top 20 Best Tech Cities
for IT Jobs 2020(2)(5)
❖ Powers Ferry
to Watch, 2021(1)(4) ❖ Northridge Center I & II
(1) Emerging trends in Real Estate 2021 by PwC and the Urban Land Institute (ULI); (2) CompTIA – Tech Town Index 2020 – Top 20 Best Tech Cities for IT Jobs;
(3) Growing faster than the U.S. average and acting as are magnets for people and companies; (4) Ranking based on overall real estate prospects; 9
(5) Ranking based on Tech Town Index rankStrategic Presence in some of the Fastest Growing States
% Change in Resident
Top 20 Fastest Growing States in the US from 2010-2020(1)
Population
1 Utah 18.4
2 Idaho 17.3
3 Texas* 15.9
4 North Dakota 15.8
5 Nevada 15.0
6 Colorado* 14.8
7 District of Columbia 14.6
8 Florida* 14.6
9 Washington* 14.6
10 Arizona 11.9
11 South Carolina 10.7
12 Georgia* 10.6
13 Oregon 10.6
14 Delaware 10.2
15 South Region 10.2
16 Montana 9.6
17 North Carolina 9.5
18 West Region 9.2
19 South Dakota 8.9
20 Tennessee* 8.9
* States which KORE has a presence in
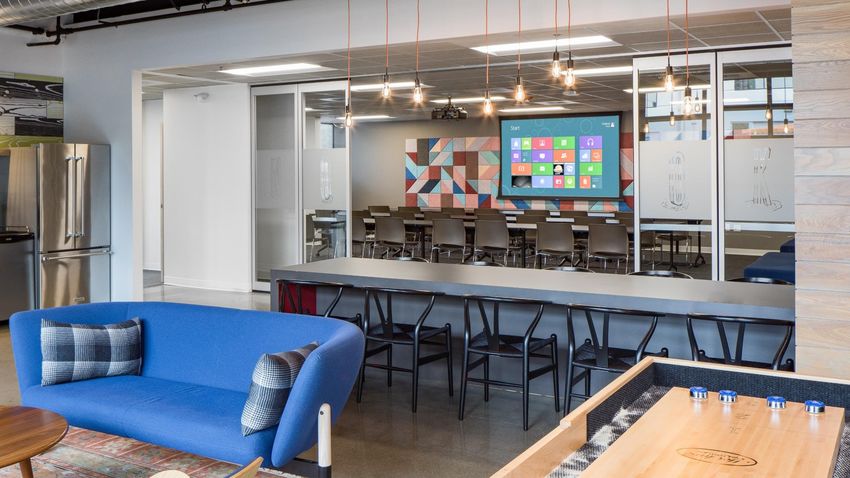
(1) US Census Bureau 2020 results. 101H 2021 Key Highlights Tenant lounge The Westpark Portfolio Redmond, Seattle, Washington
1H 2021 Key Highlights
Continued Growth                                      Stable                                                                      Robust
in Operating Income                                   Income Stream                                                               Financial Position

Distributable Income                                  Positive                                                                    Healthy
US$29.9 mil                                           Rental Reversion                                                            Aggregate Leverage

   2.8% YoY                                                 5.4%                                                                  37.1%(2)
DI of US$29.9 million for 1H 2021 was 2.8%            Continued positive rental reversions for                                    Healthy leverage and 100% unsecured
higher y-o-y, supported by positive rental            the whole portfolio, driven mainly by the                                   loans provide financial flexibility to
reversions and built-in rental escalations,           tech hubs of Seattle – Bellevue/Redmond                                     continue pursuing opportunities in
as well as lower expenses. Average rent               and Austin. Built-in average rental                                         key growth markets with a tech focus.
collection for 1H 2021 was ~98%.                      escalations of ~2.7% across the portfolio.

Distribution per Unit                                 Limited                                                                     Interest
3.16 US cents                                         Lease Expiries by CRI                                                       Coverage Ratio

   1.9% YoY                                           7.7% over the rest of 2021                                                  4.9 times(3)
1H 2021 DPU was 1.9% above 1H 2020 DPU,               Leased ~302,000 sf of space in 1H 2021,                                     Weighted average term to maturity was
which translated to a distribution yield of           equivalent to 6.4% of the portfolio.                                        2.5 years as at 30 June 2021, with no
8.1%(1) as at 30 June 2021.                           Portfolio committed occupancy was 90.5%.                                    long-term refinancing until November 2022.
                                        Information as at 30 June 2021, and excludes Bridge Crossing and 105 Edgeview, acquisitions of which were completed on 20 August 2021.
                                        (1) Based on the market closing price of US$0.785 per Unit as at 30 June 2021.
                                        (2) Calculated as the total borrowings and deferred payments (if any) as a percentage of the total assets.                                         12
                                        (3) Interest Coverage Ratio (ICR) disclosed above is computed based on the definition set out in Appendix 6 of the Code on Collective Investment
                                             Schemes revised on 16 April 2020. After adjusting for management fees taken in Units, the ICR would be 5.3 times.
Financial Performance for 1H 2021
1H 2021 1H 2020
% Change
(US$’000) (US$’000)
Gross Revenue 68,383 70,500 (3.0)
Net Property Income 40,587 41,872 (3.1)
Adjusted NPI
(excludes non-cash straight-line rent,
40,868 40,231 1.6
lease incentives and amortisation of leasing
commissions)
Income Available
29,937 29,109 2.8
for Distribution(1)
DPU (US cents) 3.16 3.10 1.9
Distribution Yield(2) 8.1% 8.9% (80 bps)
(1) The income available for distribution to Unitholders is based on 100% of the taxable income available for distribution to Unitholders.
(2) The annualised DPU yield for 1H 2021 is on a basis of 181 days (1H 2020: 182 days) and pro-rated to 365 days (2020: 366 days). Distribution yields for 13
1H 2021 and 1H 2020 are based on market closing prices of US$0.785 and US$0.700 per Unit as at last trading day of the respective periods.Strong As at 30 June 2021 (US$’000)
Total Assets 1,361,752
Balance Sheet Investment Properties 1,312,564
that Supports Cash and Cash Equivalents
Other Assets
44,970
4,218
Growth Total Liabilities 585,890
Gross Borrowings 505,720
Ambitions Other Liabilities 80.170
Unitholders’ Funds 775,862
Units in issue and to be issued (’000)(1) 949,311
NAV per Unit (US$) 0.820
Adjusted NAV per Unit (US$)(2) 0.790
Unit Price (US$) 0.785
(1) Includes management fees in Units to be issued for 2Q 2021. 14
(2) Excludes income available for distribution.Robust Financial Position and Healthy Aggregate Leverage
Healthy aggregate leverage and 100% unsecured loans provide greater financial flexibility
As at 30 June 2021 Debt Maturity Profile
Total Debt • US$505.7m of external loans
100% of Loans Unsecured
• 100% unsecured
28.6%
24.7% 22.8%
Available Facilities • US$50.0m of revolving Due 15.8%
(4)
8.1% Nov
credit facility 2022
0.0%
• US$9.0m of uncommitted
revolving credit facility 2021 2022 2023 2024 2025 2026
Interest Rate Exposure
Aggregate Leverage(1) 37.1%
Floating
All-in Average Debt
Sensitivity to LIBOR(5)
2.82 % p.a. 15.3%
Cost of Debt(2)
Every +50bps in LIBOR
Interest Coverage(3) 4.9 times
Fixed Debt translates to -0.059 US cents
Average Term 84.7% in DPU p.a.
2.5 years
to Maturity
(1) Calculated as the total borrowings and deferred payments (if any) as a percentage of the total assets.
(2) Includes amortisation of upfront debt financing costs.
(3) Interest Coverage Ratio (ICR) disclosed above is computed based on the definition set out in Appendix 6 of the Code on Collective
Investment Schemes revised on 16 April 2020. After adjusting for management fees taken in Units, the ICR would be 5.3 times.
(4) Refers to the US$41m uncommitted revolving credit facility drawn. 15
(5) Based on the 15.3% floating debt, US$41m revolving credit facility drawn which are unhedged and the total number of Units in issue
as at 30 June 2021.Stable Income with Visible Organic Growth
~302,000 sf Lease Expiry Profile (as at 30 June 2021)
Leased spaces, equivalent
31.5% 31.7%
to 6.4% of portfolio NLA.
NLA
5.4% 14.2%13.6%
18.1% 17.6%
14.3% 15.8% 15.1%
CRI
12.4%
Positive rent reversion for
8.0% 7.7%
1H 2021. Average rent
collection was ~98% in 1H 2021
and rent deferment requests 2021 2022 2023 2024 2025 2026 and beyond
amounted to only ~1% of NLA.
New Renewal Expansion
~8% New leasing demand and expansions from:
In-place rents are ~8% below Professional Services(2) 41.0%
asking rents, which provides 59.2% 14.0%
an avenue for organic growth. Technology 30.0%
Leases signed
in 1H 2021
Finance and Insurance 13.0%
~2.7%
Built-in average annual rental 26.8% Medical and Healthcare 9.7%
escalation across the portfolio.
WALE of 3.5 years(1) by CRI. Others 6.2%
(1) Based on NLA, portfolio WALE was 3.4 years.
(2) Professional Services comprises tenants who provide management consulting, legal, real estate, engineering, manufacturing and 16
educational services.Tech Focused Tenant Composition and Industry Exposure
KORE’s buildings and business campuses in ~40%(1) of KORE’s portfolio CRI is comprised
the tech hubs of Seattle – Bellevue/Redmond, of high-quality tenants from the growing and
Austin and Denver contribute ~54%(1) of CRI defensive sectors of technology, and
medical/healthcare
Geographic Diversification by CRI(1) Industry Diversification by CRI(1)
Austin
5.2% Seattle -
Nashville Professional
Bellevue/Redmond Technology
3.4% Services(2)
35.9% 31.2%
30.1%
Denver
12.4%
Houston
Medical and
12.6%
Healthcare
Dallas 8.4%
Sacramento 10.1% Finance and
Media and
4.8% Atlanta Orlando Insurance
Information Others
5.1% 10.5% 1.5% 9.1% 19.7%
(1) Information as at 30 June 2021, assuming that the acquisitions of Bridge Crossing and 105 Edgeview had been completed on
17
30 June 2021.
(2) Professional Services comprises tenants who provide management consulting, legal, real estate, engineering, manufacturing and educational services.As at 30 June 2021
Low Tenant Top 10 Tenants Sector Asset Location % of CRI
Comdata Inc Technology Bridge Crossing Nashville 3.3
Concentration Ball Aerospace Technology Westmoor Center Denver 2.7
Seattle –
Lear Cooperation Technology The Plaza Buildings, 2.6
Risk Gogo Business
Technology 105 Edgeview
Bellevue/Redmond
Denver 2.6
Aviation, LLC
Seattle –
Oculus VR Technology The Westpark Portfolio 2.2
Bellevue/Redmond
Top 10 tenants Zimmer Biomet Spine Technology Westmoor Center Denver 1.9
contribute only
Media &
21.8% of CRI(1) Spectrum Maitland Promenade I & II Orlando 1.7
Information
Finance & Seattle –
Unigard Insurance(2) Bellevue Technology Center 1.6
Insurance Bellevue/Redmond
Majority of top 10 tenants
Bio-Medical Medical &
are established tech Applications
One Twenty Five Dallas 1.6
Healthcare
companies located in the Seattle –
fast-growing tech hubs of Auth0 Technology The Plaza Buildings 1.6
Bellevue/Redmond
Seattle –
Total 21.8
Bellevue/Redmond, Denver
and Nashville. WALE by NLA 5.4 years
WALE by CRI 5.4 years
(1) Information as at 30 June 2021, assuming that the acquisitions of Bridge Crossing and 105 Edgeview had been completed on 18
30 June 2021.
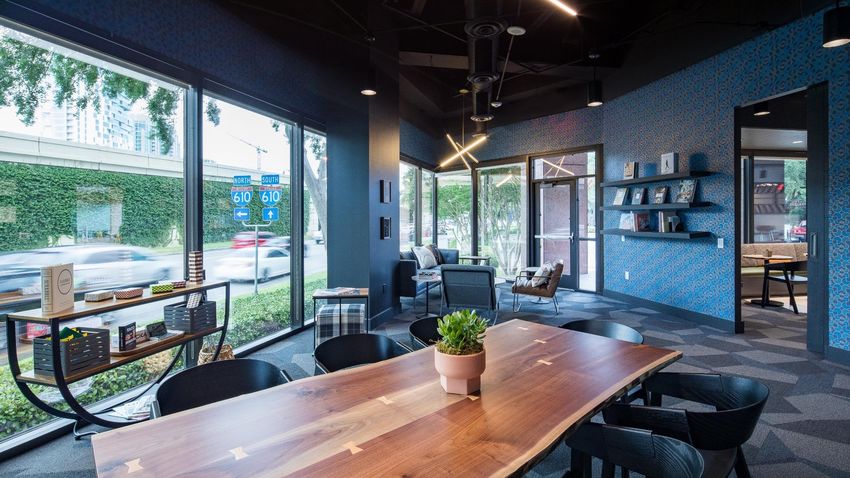
(2) Subsidiary of QBE Insurance Group.US Office Market Overview Tenant lounge, 1800 West Loop South Houston, Texas
US Economy: Recovery Apace
Continued resumption of economic activity in 2021

• US Real GDP increased 6.5% q-o-q in           %                         GDP Growth                                 %    Labour Force Participation Rate
  2Q 2021 reflecting the continued
                                                40                                                                   66
  economic recovery, reopening of
  establishments, and continued                 30                                                                   65
  government response related to the
  COVID-19 pandemic(1).                         20
                                                                                                                     64
• Unemployment rate was 5.2% in August              10
                                                                                                                     63
  2021, down considerably from its high of
                                                    0
  14.8% in April 2020(2).                                                                                            62
• Labour force participation rate was 61.7%    -10
  in August 2021(2).                                                                                                 61
                                               -20
• Number of job openings jumped to more        -30                                                                   60
  than 10.1 million in June, up from 9.2
  million in May(3) .                          -40                                                                   59

• Economy will continue to benefit from the
  US government’s support:
                                                                                           (1)                                                               (2)
  • US$1.9 trillion COVID-19 stimulus                                       GDP Growth                                      Labour Force Participation Rate
     package announced in March 2021(4).
                                              (1)    Source: U.S. Bureau of Economic Analysis, July 2021.
                                              (2)    Source: U.S. Bureau of Labor Statistics, August 2021.
                                              (3)    Source: Job Openings and Labour Turnover Survey, August 2021.                                          20
                                              (4)    Source: The White House, American Rescue Plan, March 2021.
CEOs and Employees want to Return to Offices
Progress in vaccinations and the removal of COVID-19 restrictions are raising confidence and optimism
Top 10 US Cities: Employee Office Visits People Vaccinated in the US
(as at 4 August 2021)(2) (% of total Population)(3)
Houston 49.3%
Dallas 47.9% At Least One Dose
Austin 47.0%
62%
57% Philadelphia
Chicago
Los Angeles
32.2%
30.1%
28.6%
Fully Vaccinated
Washington D.C. 28.0% 52%
New York 23.4%
San Jose 23.2% Total Vaccine Doses
San Francisco 19.6% Administered: 369,556,911
• 57% of CEOs, human resources • Texas metro areas are leading in • COVID-19 deaths in the US
and finance leaders said they office visits. remain near their lowest levels
plan to have employees back in • These cities rely mostly on cars, rather since spring 2020, and the
the office by the fall of 2021(1). than mass transit, to get people to work. number of people vaccinated
• Staggered reentry timeline to continues to grow.
phase employees back in.
(1) LaSalle Network, 2021: Office Re-Entry Index.
(2) Kastle Systems Back to Office Barometer. 21
(3) Centers for Disease Control and Prevention (CDC) COVID Data Tracker, as at 31 August 2021.Tech Continues to Lead in Office Leasing
KORE’s focus on the historically fast-expanding tech sector will benefit the REIT
100 Largest U.S. Office Leases by Tech Firms in 2020(1)
Markets with Most Square Footage Leased • The tech sector leased ~26m sf of office space in 2020,
accounting for 17% of total office leasing – more than
any other industry(1).
Seattle • Tech giants continued their leasing momentum in 2021
Manhattan - The two biggest leases in 1Q 2021 were signed
by Amazon, committing 700,000 sf in Boston and
Washington, D.C. 605,000 sf in Seattle – Bellevue/Redmond(2).
Atlanta - Google announced in May 2021 plans to
spend more than US$7b on office spaces and
data centres(3).
Austin
Austin Atlanta
Washington,
Manhattan Seattle
- In July 2021, Facebook signed an additional lease
D.C. for 300,000 sf, bringing its space commitment
New Leases (sf) 391,925 1,581,006 965,712 1,567,170 2,969,310 in Bellevue’s Spring District to ~1.6m sf(4).
Renewals (sf) 677,357 73,265 866,119 270,400 424,351
(1) CBRE TechInsights, March 2021.
(2) CoStar Office National Report, 1 July 2021.
(3) https://www.cnbc.com/2021/03/18/google-to-spend-7-billion-in-data-centers-and-office-space-in-2021.html 22
(4) https://425business.com/facebook-adding-another-bellevue-building-in-spring-district/Strategic presence in some of the fastest growing states in the US.
First choice Exposure to the fast-growing tech sector provides income resilience and growth.
US office SREIT
focused on the
fast-growing Highly diversified portfolio with low tenant concentration risk.
tech sector
across key
growth markets Resilient operating metrics with built-in average rental escalations for
in the US. further organic growth.
Robust financial position to continue pursuing opportunities in key growth markets
with a tech focus.
All information as at 30 June 2021. 23Additional Information Westech 360 Austin, Texas
Trust Sponsors(1)
Keppel
KPA
Unitholders
Keppel Capital
Structure
Capital International
Keppel
Management
Agreement
Trustee Management
Services Fees Keppel Pacific Oak US
✓ Tax-efficient structure for holding Trustee
Trustee Management
REIT Management
(Manager)
US properties Fees Services
• No US corporate tax (21%) and US 100% 100%
withholding tax (30%) Singapore
Sub 1
Singapore
Intercompany Loan Subs (2) Pacific Oak
• No Singapore corporate tax (17%) 100% of the Intercompany
Management
Agreement
and Singapore withholding tax voting shares Loan
Singapore
(10%) United States
• Subject to limited tax KORE Bridge 100%
Parent US REIT
Crossing LLC(3)
✓ Leverage Sponsors' expertise and
100% 100%
Bridge Crossing Upper Tier Inc Pacific Oak Capital
Property(3)
resources to optimise returns for
Advisors LLC
100% (US Asset Manager)
Property
Unitholders Managers
Lower Tier LLCs(3)
Property 100%
Management
✓ Alignment of interests among Agreement
Properties(3)
Ownership
Contractual
Sponsors, Manager and Unitholders relationship
(1) Keppel Capital holds a deemed 6.9% stake in Keppel Pacific Oak US REIT (KORE). Pacific Oak Strategic Opportunity REIT, Inc.
(KPA entity) holds a 6.2% stake in KORE. KPA holds a deemed interest of 0.7% in KORE, for a total of 6.9%.
(2) There are four wholly-owned Singapore Intercompany Loan Subsidiaries extending intercompany loans to the Parent US REIT.
(3) Bridge Crossing Property is held under KORE Bridge Crossing LLC, which in turn is held directly under Parent US REIT. The other
properties in the portfolio are held under the various Lower Tier LLCs respectively.
25
Information as at 12 Aug 2021. Unitholding in KORE is subject to an ownership restriction of 9.8% of the total Units outstanding.Strong Sponsors: Keppel Capital and KORE Pacific Advisors
(2)
• Asset management arm of Keppel Corporation • Established commercial real estate investment
and a premier manager in Asia manager in the US
• US$28 billion(1) • US$4.0 billion
Global assets under management as at end-2020 Assets under management as at end-2020
• ~40 cities across key global markets • Over 20 markets
Diversified portfolio of real estate, infrastructure, High quality commercial, single-family, multi-family,
data centres and alternative assets hospitality real estate portfolio across the US
• 17 Funds • 6 Funds
Over 200 professionals managing five listed REITs and Proven expertise in managing two public REITs and
business trust and 12 private funds four private funds
(1) Gross asset value of investments and uninvested capital commitments on leverage basis to project fully-invested AUM. 26
(2) The co-founding partners of Pacific Oak Capital Advisors are Peter McMillan and Keith Hall, who are partners of KORE Pacific AdvisorsThank You OUR SUSTAINABILITY COMMITMENT
We place sustainability at the heart of our strategy and are committed to
For more information, delivering sustainable distributions and strong total returns for Unitholders.
please visit www.koreusreit.com
ENVIRONMENTAL STEWARDSHIP
Connect with us on: In line with Keppel’s Vision 2030, we will do our part to combat
climate change, and are committed to improving resource
efficiency and reducing our environmental impact.
RESPONSIBLE BUSINESS
The long-term sustainability of our business
is driven at the highest level of the organisation through good
corporate governance and prudent risk management.
PEOPLE AND COMMUNITY
People are the cornerstone of our business. We are committed
to providing a safe and healthy workplace, investing in training
and developing our people to help them reach their full
potential, as well as uplifting communities wherever we
operate.
27You can also read