GETTING TO ZERO ILLINOIS - Draft Plan Launch In honor of World AIDS Day 2018 December 3, 2018
←
→
Page content transcription
If your browser does not render page correctly, please read the page content below
GETTING TO
ZERO
ILLINOIS
Draft Plan Launch
In honor of World AIDS Day 2018
December 3, 2018
Welcome to everyone viewing today’s event from
across Illinois! Download slides & handouts at
www.gtzIllinois.org/draft

Today’s agenda:
-review the latest epi data from IDPH & CDPH
-Get an overview of how we’ve developed the plan
and key elements
-Q & A and audience comments

REMEMBER: This is just a draft, and we are inviting
your comments!
THANK YOU, STEERING COMMITTEE & STAFF!
   • Communications                         • At-Large members
      • Brian Solem, DeVante’ Harris           • Eduardo Alvarado, Illinois
   • Health Care Access                          Department of Public Health
                                                 representative
      • Toyin Adeyemi, Candi Crause, Erik
        Glenn                                  • David Kern, Chicago Department of
                                                 Public Health representative
   • Housing                                   • John Peller, AIDS Foundation of
      • Noel Green, Scott Ammarell               Chicago representative
   • Research, Data and Evaluation             • Valerie Johansen, at-large member
      • Diana Lemos, Nanette Benbow,           • Nicole Seguin, Chicago Area HIV
        John Schneider, Gregory Phillips         Integrated Services Council
                                                 representative
   • Social Determinants of Health
      • Jolie Holliman, Latonya Maley,      • AFC Staff
        Chris Wade                             • Simone Koehlinger
                                               • Meg McElroy
                                               • Sara Semelka
CURRENT STATE OF THE
EPIDEMIC
Eduardo Alvarado, MPH, MPAP, Chief, HIV/AIDS Section,
Illinois Department of Public Health
Dave Kern, Deputy Commissioner, HIV/STI Bureau, Chicago
Department of Public Health
Getting to Zero:
IL’s Ending the HIV Epidemic Strategy
             Eduardo Alvarado, MPH, MPAP
                 Chief, HIV/AIDS Section
         Illinois Department of Public Health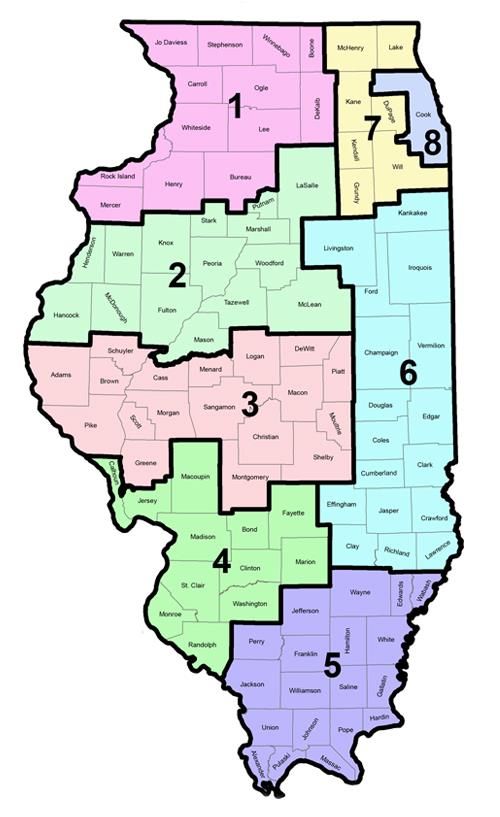
WORLD AIDS DAY 2018

      …In Memoriam

       35,000,000 lives worldwide
       16,752 lives, Illinois (1987-2016)
HOW WILL IDPH GET TO ZERO?
• Embed throughout Illinois’ response to the Epidemic (1987)
   – Prevention, Care, ADAP, Surveillance, Evaluation, E&T, IHIPC
   – Funding from IL State General Revenue, HRSA/Ryan White, and CDC
• Client Services (annual estimates, 2017):
   – 200,000 clients received HIV Prevention services
   – 8,500 PLWHA received RW, ADAP or CHIC Services
• Align GTZ resources
   – HIV Care Continuum
   – RFA Process
   – GTZ Outcomes as Program Evaluation
Illinois HIV Disease Prevalence, 2016
                                                                                                               80% Male
                                                                                                                                  Males
                                                                 38,022                                                         68% MSM
                                                                 PLWHD                                       47% Black      14% IDU/MSM+IDU
                                                                                                                                 6% HET
                                                                                                             28% White
                                                                                                            18% Hispanic
                                                                  2017:                                    16% 25-34 y/o
                                                                                                                                Females
                                                                                                                                52% HET
                                                                  39,842                                   19% 35-44 y/o        18% IDU
                                                                                                             61% 45+

Prevalence based on address at diagnosis; Transmission category included non-reportable and non-identifiable risk groups.
Source: Illinois Department of Public Health, HIV/AIDS Surveillance Unit. Data as of May 2018.
HIV Diagnoses by Race/Ethnicity
                                                            IL-Excluding Chicago                                                      Chicago
                           350                                                                                       800

                           300                                                                                       700
HIV Disease Diagnoses

                                                                                                                     600
                           250
                                                                                                                     500
                           200
                                                                                                                     400
                           150
                                                                                                                     300
                           100
                                                                                                                     200
                             50                                                                                      100
                               0                                                                                          0

                                               Black             White               Hispanic                                 Black      White   Hispanic

                        Source: Illinois Department of Public Health, HIV/AIDS Surveillance Unit. Data as of June 2017.
HIV Diagnoses: Chicago vs. Illinois
                         2,500

                         2,000
HIV Disease Diagnoses

                         1,500

                         1,000

                            500

                                 0
                                          2007           2008           2009            2010           2011           2012   2013    2014      2015   2016
                                                 IL-Excluding Chicago                                        Chicago                Total IL

                        Source: Illinois Department of Public Health, HIV/AIDS Surveillance Unit. Data as of June 2017.
HIV Diagnoses in Illinois by Sex
1,600
1,400 1418 1432 1460 1415 1355 1449 1356
1327 1319
1,200 1236
1,000
800
600
418 481
400 402
323 329 323 310 264
200 252 240
0
2007 2008 2009 2010 2011 2012 2013 2014 2015 2016
Male Female
Source: Illinois Department of Public Health, HIV/AIDS Surveillance Unit. Data as of December 2017.Diagnostic Status of New HIV Diagnoses in
Illinois by Year of Diagnosis
HIV (non-AIDS) AIDS (Late Diagnoses)
100%
90%
33% 23%
80%
70%
60%
50%
40%
30%
20%
10%
0%
2007 2008 2009 2010 2011 2012 2013 2014 2015 2016
2007-2012 APC = -3.61* / 2012-2016 APC = -10.87*
* The Annual Percent Change (APC) is significantly different from zero at alpha=0.05.
Source: Illinois Department of Public Health, HIV/AIDS Surveillance Unit. Data as of June 2017.HIV Late Diagnoses, Illinois, 2007-2016 Among clients diagnosed with HIV in 2016, 23% tested late with advanced HIV/AIDS: 30% of all males… who tested HIV positive 28% of all females… 35% of all Hispanics (29% of all whites; 28% of all blacks) 43% of all persons over the age of 50… 15% of all 13-19 year-olds… Males: 47% of heterosexuals; 44% of IDU; 27% of MSM… Females: 31% of heterosexuals; 30% of IDU… Source: Illinois Department of Public Health, HIV/AIDS Surveillance Unit. Data as of June 2017.
HIV Continuum of Care
                                                                    Behavioral Interventions:
Biomedical Interventions:
                                                                    •   Client-centered
•   PrEP, nPEP, PEP
                                                                    •   PrEP, Condoms, Harm Reduction
•   ARVs
                                                                    •   STI screen/treat, as needed
•   HCV Treatment
                                                                    •   Health Care Access point
                                                                           •   Mental Health
                                                                           •   Substance Abuse

                            Structural Interventions:

                            • PrEP Enrollment
                            • HIV Testing: (-) (+) Pathways
                            • ECM: Navigation, Retention, Housing
Ending HIV in IL: Getting to ZERO
By 2030, Illinois proposes:
Zero new HIV infections, and
Zero people living with HIV/AIDS who are not receiving
treatment—
by increasing PrEP uptake for HIV negative persons, and
increasing care & Virologic suppression for those living with HIV.IDPH Has the Tools to ‘Get To Zero’ Robust HIV Data, RW, Perinatal & ADAP Systems Extensive ECM, Housing and Harm Reduction infrastructures City and State Engagement, e.g. IL PrEP Working Group, IHIPC, CAHISC, FIMR IL Follows a Call to Action by our Federal (funding) partners Prioritized PrEP investments-current and future HB2800 and Repeat Third Trimester HIV Testing
GETTING TO ZERO IN ILLINOIS:
WE ARE CLOSER THAN YOU THINK
PrEP: Much more than a Pill
• The first point of entry into a health care setting
• For PLWHA, ARVs are essential to maintaining viral
  suppression (U=U) and improved Quality of Life
• Sustainability: PrEP ‘Clinics’ > PrEP ‘Clinicians’
• Traditional vs alternative service models
• Integrate into routine health care settings
IDPH GTZ Investment Strategies
Resource allocation, program development and partnerships that support:
•   Viral Suppression
•   Molecular HIV Surveillance
•   Alignment of HIV, STI and Viral Hepatitis
•   Increasing the Value and Engagement of all communities
•   Expanding PrEP Access
•   Focus on improving healthcare access to prevention and HIV Care
•   All IDPH HIV activities must address, prioritize and respond to:
         SDOH, Health Equity, Health Literacy, and Reducing Stigma
IDPH HIV Investment Strategies
Viral Suppression goals may differ by population
Data: MHS, STI Expanded and targeted PrEP and PEP
Integrate HIV/STI: Sexual Health ↔ Life Course HIV Infrastructure
• Sustain PrEP and VS efforts with diverse funds
• GTZ evolution, modeling, changing Need, consumer
feedback: ask the experts!
• Workforce development: in partnerships and staffing
• Youth and young MSM of color need better than traditional
prevention programsAccessing PrEP in Illinois
• WWW.PrEP4Illinois.com 800-825-3518
• PrEP is covered by most health insurance incl. Medicaid
• Gilead Sciences or other pharmaceutical companies cover co-
pay for PrEP
• WWW.PrEP4Illinois.com
– Payer of Last Resort (medication, copays, and soon-
labs/office visits) for uninsured & underinsured clientswww.PrEP4Illinois.com • IDPH PrEP Website – Education about PrEP – Education and training for Clinicians – Risk Reduction education for high risk clients – Directory of PrEP prescribers in Illinois • Access to PrEP Services – Financial screening – Direct billing to Private Insurance or Medicaid – Enrolment into patient assistance co-pay program
PrEP Demonstration Projects
Funded 18 STD Local Health Department Sites
Granted $20,000 for Capacity Building through Local Health Protection Grants
Goal: Increase PrEP Enrollment, Awareness, Accessibility and Sustainability.

In addition to PrEP education at every HIV screening visit:
    • Referrals or on-site STI screening, case management and PrEP and PEP delivery
    • Capacity building for sites to expand access and include PrEP and PEP
    • Partner with local colleges and university health systems to educate and build
      capacity for PrEP through their health facilities (STI and Family Planning Clinics)
    • Educate and collaborate with teaching hospitals, urgent care facilities, Perinatal
      Regional Networks, and other medical institutions on PrEP and PEP
2018 HIV/STI Surveillance
Report Release
Dave Kern
Deputy Commissioner
Chicago Department of Public Health
HIV/STI Bureau
December 2018HIV Trends Figure 2.1 People Living with HIV Infection (PLWH), People Diagnosed with HIV Infection, People Diagnosed with AIDS, Concurrent HIV/AIDS Diagnoses, and Deaths Among PLWH, Chicago, 1990-2017 (as of 10/26/2018)
HIV Trends
 Figure 2.1 People Living with HIV Infection (PLWH), People Diagnosed with HIV Infection, People Diagnosed with AIDS, Concurrent
 HIV/AIDS Diagnoses, and Deaths Among PLWH, Chicago, 1990-2017 (as of 10/26/2018)
HIV Trends
 Figure 2.1 People Living with HIV Infection (PLWH), People Diagnosed with HIV Infection, People Diagnosed with AIDS, Concurrent
 HIV/AIDS Diagnoses, and Deaths Among PLWH, Chicago, 1990-2017 (as of 10/26/2018)
HIV Trends
 Figure 2.1 People Living with HIV Infection (PLWH), People Diagnosed with HIV Infection, People Diagnosed with AIDS, Concurrent
 HIV/AIDS Diagnoses, and Deaths Among PLWH, Chicago, 1990-2017 (as of 10/26/2018)
HIV Trends

• Certain population groups are more impacted by HIV than others in 2017.
   • Males
        • 82% of new HIV diagnoses (5.1 X more than females)
        • 78% of late HIV diagnoses
        • 80% of people living with HIV

    • Gay, bisexual and other men who have sex with men (MSM)
       • 77% of new HIV diagnoses
       • 65% of late HIV diagnoses
       • 68% of people living with HIV
HIV Trends
• Certain population groups were more impacted by HIV than others in
2017.
• Non-Hispanic Blacks
• 55% of new HIV diagnoses
• 55% of late HIV diagnoses
• 80% of people living with HIV
• Individuals ages 20-39
• 65% of new HIV diagnoses
• 51% of late HIV diagnoses
• Individuals ages 40+
• 69% of people living with HIVHIV Trends
New HIV Infection Diagnoses by Total and Select Populations,
Chicago, 2006-2017 (as of 10/26/18) All
1600
MSM (all)
1400 Non-Hispanic Black MSM
Hispanic MSM
1200
Non-Hispanic Black Women
Number of New HIV Infection Diagnoses
Injection Drug Use
1000
800
600
400
200
0
2006 2007 2008 2009 2010 2011 2012 2013 2014 2015 2016 2017
Reporting YearHIV Trends
New HIV Infection Diagnoses by Total and Select Populations,
Chicago, 2006-2017 (as of 10/26/18)
1600 All
MSM (all)
1400
Non-Hispanic Black MSM
1200
Number of New HIV Infection Diagnoses
Hispanic MSM
1000
800
600
400
200
0
2006 2007 2008 2009 2010 2011 2012 2013 2014 2015 2016 2017
Reporting YearHIV Trends
HIV Trends
HIV/STI Co-Infection – 2017

               STI    # Co-Infected     % Co-Infected
                        with HIV          with HIV

       Chlamydia                1,099               4%

       Gonorrhea                1,202              10%

       P&S Syphilis               342              43%
HIV Continuum
Figure 1.1 HIV Continuum of Care Among Cases 13 Years and Older, Chicago, 2017 (as of 10/26/2018)
100%
100% 100%
90% 92%
90%
88%
80% 82%
70%
60% 63%
50% 55%
48%
40%
36%
30%
20%
10%
0%
# New HIV % Linked to % Linked to % Linked to % Linked to # Diagnosed % Accessing % Retained in # Persons % Virally
Diagnoses Care within 1 Care within 3 Care within 6 Care within thru 2016 Care (at least Care (at least with at least Suppressed
(2017) (a) month of HIV months of months of 12 months of and living 1 visit in 2 visits in 1 Viral Load (< 200
diagnosis (b) HIV diagnosis HIV diagnosis HIV diagnosis with HIV in 2017) (g) 2017, 3 test in 12 copies/mL) (j)
(c) (d) (e) 2017 (f) months months (i)
apart) (h)HIV Continuum
Figure 1.1 HIV Continuum of Care Among Cases 13 Years and Older, Chicago, 2017 (as of 10/26/2018)
100%
100% 100%
90% 92%
90%
88%
80% 82% National HIV/AIDS Strategy Indicator:
70% Increase the percentage of newly diagnosed
persons linked to HIV medical care within
60% 63%
one month of diagnosis to at least 85%.
50% 55%
48%
40%
36%
30%
20%
10%
0%
# New HIV % Linked to % Linked to % Linked to % Linked to # Diagnosed % Accessing % Retained in # Persons % Virally
Diagnoses Care within 1 Care within 3 Care within 6 Care within thru 2016 Care (at least Care (at least with at least Suppressed
(2017) (a) month of HIV months of months of 12 months of and living 1 visit in 2 visits in 1 Viral Load (< 200
diagnosis (b) HIV diagnosis HIV diagnosis HIV diagnosis with HIV in 2017) (g) 2017, 3 test in 12 copies/mL) (j)
(c) (d) (e) 2017 (f) months months (i)
apart) (h)HIV Continuum
Figure 1.1 HIV Continuum of Care Among Cases 13 Years and Older, Chicago, 2017 (as of 10/26/2018)
100%
100% 100%
90% 92%
90%
88%
80% 82%
National HIV/AIDS Strategy Indicators:
70%
Increase the percentage of persons
60% 63%
with diagnosed HIV who are retained
50% in HIV medical care to at least 90%. 55%
48%
40%
Increase the percentage of persons
36%
30% diagnosed with HIV who are virally
20%
suppressed to at least 80%.
10%
0%
# New HIV % Linked to % Linked to % Linked to % Linked to # Diagnosed % Accessing % Retained in # Persons % Virally
Diagnoses Care within 1 Care within 3 Care within 6 Care within thru 2016 Care (at least Care (at least with at least Suppressed
(2017) (a) month of HIV months of months of 12 months of and living 1 visit in 2 visits in 1 Viral Load (< 200
diagnosis (b) HIV diagnosis HIV diagnosis HIV diagnosis with HIV in 2017) (g) 2017, 3 test in 12 copies/mL) (j)
(c) (d) (e) 2017 (f) months months (i)
apart) (h)Key Take-aways • In 2017, Chicago saw the fewest new HIV diagnoses since 1988, representing a 15% decrease from 2016 and a 60% decrease from 2001, the height of new diagnoses (1,850). • HIV continues to disproportionately impact certain populations: men; gay, bisexual, and other MSM; non-Hispanic Blacks; younger individuals (new diagnoses); and older individuals (HIV prevalence). • While we’re seeing overall declines, new HIV diagnoses among non- Hispanic Black and Hispanic gay, bisexual, and other MSM remain stable. • We’ve almost achieved the NHAS indicator for linkage to care, but there’s much room to improve on retention in care and viral suppression. • GTZ is critical to our efforts to make necessary improvements.
Getting to Zero Chicago – Future

                Healthcare

         How-      $36M      Health
          to                 Equity

                 Housing
“We have the opportunity of being the generation
that was there when the disease was first recognized,
and we could be there when it is over. That has
never been done before with a disease of this
magnitude. I believe history will judge us harshly if
we do not take advantage of that opportunity.”
– Dr. Anthony Fauci@ChiPublicHealth /ChicagoPublicHealth HealthyChicago@CityofChicago.org www.CityofChicago.org/Health
THE DRAFT GTZ PLAN
HOW DID WE GET HERE AND WHAT’S IN THE PLAN?
• Erik Glenn, MSW, Executive Director, Chicago Black Gay Men's
  Caucus
• Toyin Adeyemi, MD, MPH, Senior Director of HIV Services for the
  Cook County Health and Hospitals System
• Candi Crause, MPH, CADC Director, Adult Services, Champaign-
  Urbana Public Health District
WHY CREATE A PLAN NOW?

• New research
• New technologies
• New health care access
KNOWING ALL THIS … COULD WE ELIMINATE
THE EPIDEMIC IN OUR STATE ALTOGETHER?
  • In July of 2016, a small group of people met to explore
    how to change the course of HIV in Illinois
  • The group developed a framework to show getting to zero
    was possible in Illinois and released that to the public in
    September of 2017

                   Can we end
                     HIV in
                    Illinois?
                                   Is now the
                                      time?           YES!
WE CAN CHANGE THE COURSE OF THE HIV EPIDEMIC IN ILLINOIS We have made great strides but there is still lots to do. If we … • Increase PrEP uptake by 20 percentage points • Increase viral suppression by 20 percentage points … we could see fewer than 100 new cases by 2030
GOAL 1: INCREASE USE OF PREP
TO REACH ZERO NEW HIV INFECTIONS
  • What it is: PrEP is a pill and a program that
    is up to 99% effective at preventing HIV
    when taken consistently and correctly.
  • The challenge: Just 10-20% of people who
    need PrEP are taking it, and populations
    most vulnerable to HIV (Black gay men,
    trans women of color, Black women) are not
    aware or are not taking PrEP.
GOAL 2: INCREASE THE NUMBER OF PEOPLE
LIVING WITH HIV WHOSE VIRAL LOAD IS
UNDETECTABLE
• The challenge: About 50% of
people with HIV in IL are NOT
virally suppressed.
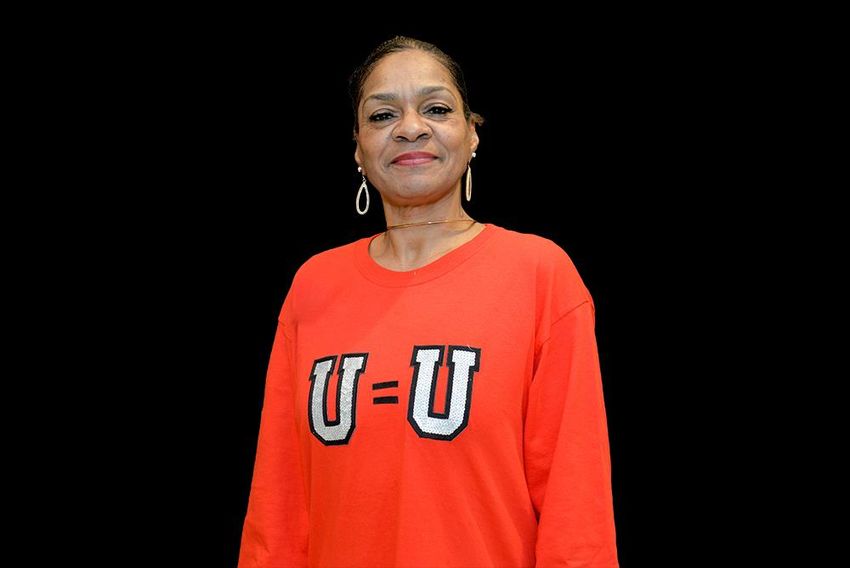
• Why it matters: People who are
virally suppressed live longer,
healthier lives, and cannot
transmit HIV sexually if they
have been undetectable for at
least six months.BUT WHAT DO WE MEAN WHEN WE SAY “GETTING TO ZERO”? Ultimately, we want to see … ▪ Zero new HIV transmissions ▪ Zero people living with HIV who are not on treatment By 2030, we want to reach “functional zero” What’s that? When there are fewer than 100 new transmissions per year and the epidemic can no longer sustain itself
2018: BUILDING THE DRAFT PLAN
• January – March: Community engagement activities: 9 town
  hall meetings across Illinois, 8 focus groups, nearly 400 survey
  respondents = over 830 people
• March – April: Data analysis and committee recruitment
• June: Committee kickoff with 100 participants
• June – October: Monthly meetings of working committees
• November: synthesis and editing of draft

            • Today, in honor of World AIDS Day: Sharing the
              draft plan with you and communities across the
              state
COMMUNITY ENGAGEMENT
TOWN HALLS:
• At least one in each of the state’s 8 HIV
regions with 320 participants.
FOCUS GROUPS
• 7 with key populations such as black
and Latinix gay men, women living with
HIV, and aging people with HIV
SURVEY
• 408 responses to a paper and online
survey in English and SpanishKICKOFF JUNE 20
DRAFT PLAN OVERVIEW
Five principles overlay the plan. We cannot end the
epidemic unless we make progress for all populations
impacted and tackle injustices:
• Eliminating Stigma
• Undoing Racist Systems
• Providing Trauma-Informed Care
• Cultural Humility
• Outcomes-Driven
SIX DOMAINS
DRAFT PLAN
• Each domain has several goals, strategies and action steps.
  We are presenting only EXAMPLE action steps.

           • Improve Health Equity
              • Goal 1- Gay, bisexual, same-gender-loving, and other
                cisgender men who have sex with men receive
                equitable care, with a focus on Black and Latinx men.
                 • Strategy 2- Disseminate data and research detailing a
                   broad understanding of same gender loving Black men’s
                   health
                    • Example Action Step- Host an online data repository detailing a
                      broad understanding of same-gender-loving Black men’s health
1. BUILD THE FUTURE WORKFORCE
Example strategies include:
• Increasing partnerships between health professional schools to
increase training opportunities that will educate providers at all levels
on HIV, STIs and viral hepatitis treatment.
• Increase science-based education that includes PrEP, U=U for the HIV
workforce.
• Increase the number of people representing priority populations
working in HIV services at all levels of the organization.
• Provide living wage employment with benefits to people
living with and vulnerable to HIV through peer-based
programs, as certified community health workers and in
other settings.2. INCREASE ACCESS TO HEALTH CARE
2. INCREASE ACCESS TO HEALTH
CARE
• Expand routine screening in health care settings that don’t
depend on grant funding by developing screening protocols,
modifying EMRs, and creating linkage to care strategies
• Increase the number of providers that offer same-day
medication start (“rapid start”) programs
• Implement programs to improve health and insurance literacy
of the HVI workforce and clients, and make materials
available in English and Spanish
• Leverage Medicaid data to increase viral
suppression rates; Medicaid covers 6 in 10 people
with HIV in Illinois but half may not be taking HIV
medications.3. IMPROVE HEALTH EQUITY
• Black and Latinx gay men: develop and disseminate a compendium
of best practices for improving care for the population.
• Black cis women: Expand access to sexual and reproductive health
care within the Ryan White program.
• Trans people: Advocate for IL Medicaid to cover gender-affirming
services.
• Justice-involved: hire a full-time discharge planner at Cook County
Jail.
• Immigrants and migrants: Explore providing state-
funded Medicaid benefits for DACA recipients and for
two-years post-partum for women who have children
• Expand housing availability, food and nutrition services
and transportation for people living with and vulnerable
to HIV4. INCREASE EFFICIENCY THROUGH GOVERNMENTAL COORDINATION • Increase collaboration between CDPH and IDPH HIV, STI and viral hepatitis programs (e.g., identify reports with the same data submitted in different formats) • Integrate GTZ-IL goals into the CDPH and IDPH community planning process • Align with GTZ-IL goals state government programs such as domestic violence, behavioral health, aging, and Medicaid
5. CARE FOR LINKED, CO-OCCURRING
CONDITIONS
• Increase access to behavioral health care by
  • increasing behavioral health screenings in health care settings
  • creating a robust referral network of culturally-competent providers
    and
  • exploring tele-behavioral health
• Educate health care providers about the need to conduct
  extragenital screening for STIs, particularly among gay men
  and MSM
              • Eliminate viral hepatitis among people living
                with HIV receiving Ryan White services
6. MEASURING OUR PROGRESS THROUGH SURVEILLANCE AND OTHER DATA • Improve surveillance data systems to remove people who have moved out of the jurisdiction from reporting; this will improve engagement in care and viral suppression rates • Expand access to timely CDPH and IDPH surveillance data so providers can determine if patients are in or out of care • Build a dashboard to publicly monitor and report on GTZ-IL progress
DRAFT PLAN

      Find the full version of the draft plan at

       www.gtzillinois.hiv/draft
PLEASE COMMENT!
We’d love for
Public comment
you to read the
begins TODAY
plan, share it,
and lasts until
and tell us what
January 18
you think!
Go to • The plan
www.gtzillinois.hiv/draft • A link to our
to find: feedback survey
You can also email us
comments directly at
info@gtzillinois.hivQUESTIONS? What questions or comments do you have for our panel today?
THANK YOU AND PLEASE COMMENT!
We’d love for
                       Public comment
you to read the
                       begins TODAY
plan, share it,
                       and lasts until
and tell us what
                       January 18
you think!

                   Go to                           • The plan
                   www.gtzillinois.hiv/draft       • A link to our
                   to find:                          feedback survey

                                      You can also email us
                                      comments directly at
                                      info@gtzillinois.hiv
You can also read