GIFT - A Global Inventory of Floras and Traits for macroecology and biogeography - bioRxiv
←
→
Page content transcription
If your browser does not render page correctly, please read the page content below
bioRxiv preprint first posted online Feb. 1, 2019; doi: http://dx.doi.org/10.1101/535005. The copyright holder for this preprint (which
       was not peer-reviewed) is the author/funder, who has granted bioRxiv a license to display the preprint in perpetuity.
                                     It is made available under a CC-BY 4.0 International license.

      GIFT – A Global Inventory of Floras and Traits
      for macroecology and biogeography
      Patrick Weigelt*, Christian König & Holger Kreft
      Biodiversity, Macroecology & Biogeography, University of Goettingen, Büsgenweg 1, 37077 Göttingen,
      Germany

      *gift@uni-goettingen.de

      Keywords
      Angiosperms, Functional biogeography, Functional traits, Plant checklists, Species composition, Vascular
      plants

      Abstract
      To understand how traits and evolutionary history shape the geographic distribution of plant life on Earth,
      we need to integrate high-quality and global-scale distribution data with functional and phylogenetic
      information. Large-scale distribution data for plants are, however, often restricted to either certain
      taxonomic groups or geographic regions. For example, range maps only exist for a small subset of all plant
      species and digitally available point-occurrence information is strongly biased both geographically and
      taxonomically. An alternative, currently rarely used resource for macroecological and botanical research
      are regional Floras and checklists, which contain highly curated information about the species
      composition of a clearly defined area, and which together virtually cover the entire global land surface.
      Here we report on our recent efforts to mobilize this information for macroecological and biogeographical
      analyses in the GIFT database, the Global Inventory of Floras and Traits. GIFT integrates plant distributions,
      functional traits, phylogenetic information, and region-level geographic, environmental and socio-
      economic data. GIFT currently holds species lists for 2,893 regions across the whole globe including
      ~315,000 taxonomically standardized species names (i.e. c. 80% of all known land plant species) and ~3
      million species-by-region occurrences. In addition, GIFT contains information about the floristic status
      (native, endemic, alien and naturalized) and takes advantage of the wealth of trait information in the
      regional Floras, complemented by data from global trait databases. Based on a hierarchical and
      taxonomical derivation scheme, GIFT holds information for 83 functional traits and more than 2.3 million
      trait-by-species combinations and achieves unprecedented coverage in categorical traits such as
      woodiness (~233,000 spp.) or growth form (~213,000 spp.). Here we present the structure, content and
      automated workflows of GIFT and a corresponding web-interface (http://gift.uni-goettingen.de) as proof
      of concept for the feasibility and potential of mobilizing aggregated biodiversity data for global
      macroecological and biogeographical research.

                                                                                                                                          1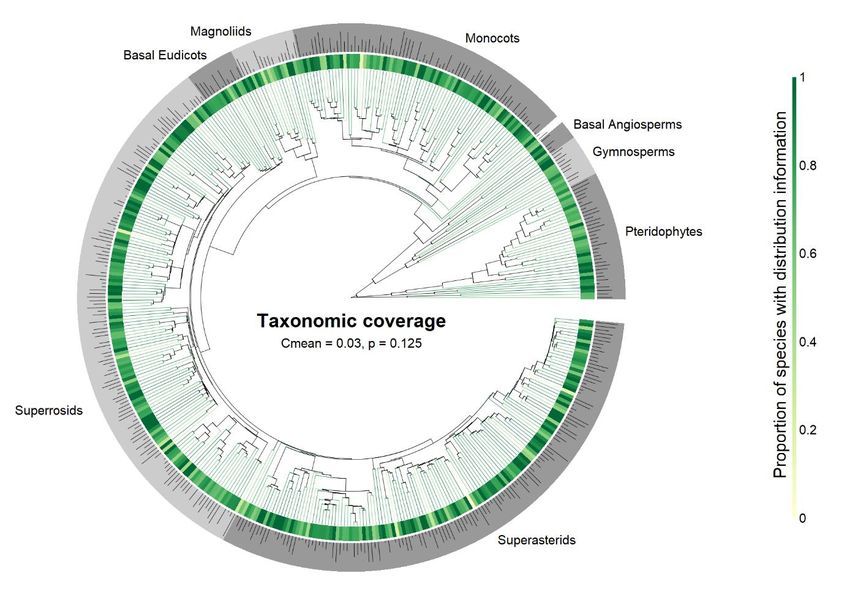
bioRxiv preprint first posted online Feb. 1, 2019; doi: http://dx.doi.org/10.1101/535005. The copyright holder for this preprint (which
       was not peer-reviewed) is the author/funder, who has granted bioRxiv a license to display the preprint in perpetuity.
                                     It is made available under a CC-BY 4.0 International license.

      Introduction
      Worldwide, about 382,000 vascular plant species form the basis of our terrestrial biosphere and provide
      key ecosystem services to humanity (Willis, 2017). Despite the long history of botanical exploration of our
      planet, the global distribution is only known for a subset of all plant species at comparatively coarse spatial
      grains (e.g. WCSP, 2012). In contrast to smaller and better known taxa like birds and mammals (BirdLife
      International, 2018; IUCN, 2018), high-quality species-level range maps or atlas data of plants are only
      available for selected groups (e.g. conifers in Farjon & Filer, 2013; cacti in Barthlott et al., 2015) or regions
      (e.g. Europe in Tutin et al., 1964–1980; woody plants of China in Fang et al., 2011). Many research
      questions at the forefront of biogeography and macroecology, however, require a detailed knowledge of
      global plant distributions and, additionally, of species-level functional traits and phylogenetic
      relationships (e.g. Morueta-Holme et al., 2013; Weigelt et al., 2015; König et al., 2017).

      Several national and international initiatives focus on mobilizing and aggregating plant distribution
      information. For instance, the Global Biodiversity Information Facility (GBIF, 2018), provides access to
      ~214 million point occurrences of vascular plant species. These records are invaluable for plant ecology
      and conservation-related research, as they provide information about key aspects of species identity, time
      and place (Powney & Isaac, 2015). However, taxonomic, geographical and temporal biases (Hortal et al.,
      2015; Meyer et al., 2016), as well as limited curation and standardization efforts and the lack of important
      meta-information, like, for example, the floristic status at a given location (native, non-native, naturalized,
      etc.), limit their usefulness for macroecological research. An alternative source of information are Floras
      and checklists which, in contrast, present highly curated accounts of the plant species known to occur in
      a certain region. Floras and checklists are often based on decades to centuries of exploration and regional
      botanical work, and have profited from the expertise of generations of botanists. They aim at providing
      (near-)complete floristic inventories for a given region and thus provide information on species presences
      and their floristic status, and additionally allow for the inference of local species absences (Lobo et al.,
      2010; Jetz et al., 2012). So far, extensive compilations of plant checklists exist only for certain geographic
      regions (e.g. Ulloa Ulloa et al., 2017), taxonomic groups (e.g. Flann, 2009; WCSP, 2012), functional types
      (e.g. BGCI, 2017), or, for example, naturalized alien plants (van Kleunen et al., 2015; Pyšek et al., 2017).

      In light of the increasing availability of biodiversity data, it is a major challenge to integrate various data
      types and to link data from different ecological domains representing species distributions, functional
      traits, phylogenetic relationships or environmental characteristics for analyses and cross-validation (König
      et al., in prep.). Initiatives that integrate different types of distribution data with additional biotic or abiotic
      information are currently most comprehensive for particular geographic regions (e.g. BIEN for the
      Americas; Enquist et al., 2016) or other taxa (e.g. Map of Life for vertebrates; Jetz et al., 2012). However,
      the wealth of aggregated information in regional Floras and checklists (Frodin, 2001) allows for a near-
      global characterization of plant distributions. In combination with functional traits from the botanical
      literature or large trait databases (e.g. RBG Kew, 2008; Kattge et al., 2011b) and ever-growing species-
      level phylogenies (e.g. Smith & Brown, 2018), this represents a promising basis for macroecological and
      biogeographic research.

      Here, we present GIFT, the Global Inventory of Floras and Traits database, a new resource designed to
      integrate species distribution data and species-level functional traits of plants from regional Floras and
      checklists with phylogenetic information and geographic, environmental and socio-economic
      characteristics (Fig. 1). As such, the database architecture, workflows and data of GIFT facilitate a wide

                                                                                                                                          2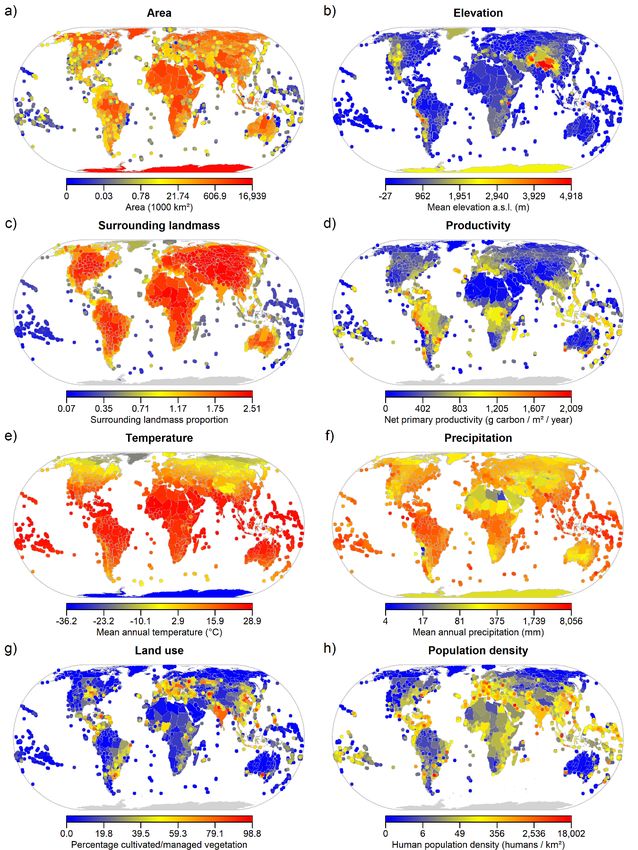
bioRxiv preprint first posted online Feb. 1, 2019; doi: http://dx.doi.org/10.1101/535005. The copyright holder for this preprint (which
       was not peer-reviewed) is the author/funder, who has granted bioRxiv a license to display the preprint in perpetuity.
                                     It is made available under a CC-BY 4.0 International license.

      array of macroecological and biogeographical analyses and may help to extent and validate other plant
      distribution and trait data resources. The general concepts outlined here may serve as a role model for
      aggregated species checklist and trait databases for other major taxonomic groups.

      Fig. 1. Conceptual framework of the Global Inventory of Floras and Traits database (GIFT). The core information in
      GIFT are species occurrences in geographic regions (islands, political units, protected areas, biogeographical regions)
      based on Floras and checklist. At the level of the geographical regions, this information is linked to physical
      geographic, bioclimatic and socioeconomic properties. At the level of the species, functional traits, taxonomic
      placement and phylogenetic relationships are linked. This integration of species distribution data in the form of full
      regional inventories and regional and species characteristics allows for a wide variety of macroecological and
      biogeographical analyses of taxonomic, phylogenetic and functional diversity as well as for the refinement and
      validation of other plant distribution and trait datasets.

      Content and structure of GIFT
      Overview
      Regional Floras and checklists are a rich source of information on species distributions that often also
      contain detailed descriptions of species traits and other information such as conservation status and
      human uses (Palmer & Richardson, 2012). In the past, botanical knowledge was recorded primarily in
      printed books (Frodin, 2001), which are labor-intensive to convert into structured data. These resources,
      however, are increasingly being made digitally available (e.g. Zuloaga et al., 2004; Acevedo-Rodríguez &
      Strong, 2007) and modern regional inventory projects are set up as digital databases right from the start
      (e.g. Brach & Song, 2006; Jardim Botânico do Rio de Janeiro, 2016). In GIFT, we make use of this wealth of
      information, and collate and mobilize plant species lists and trait information from published and

                                                                                                                                          3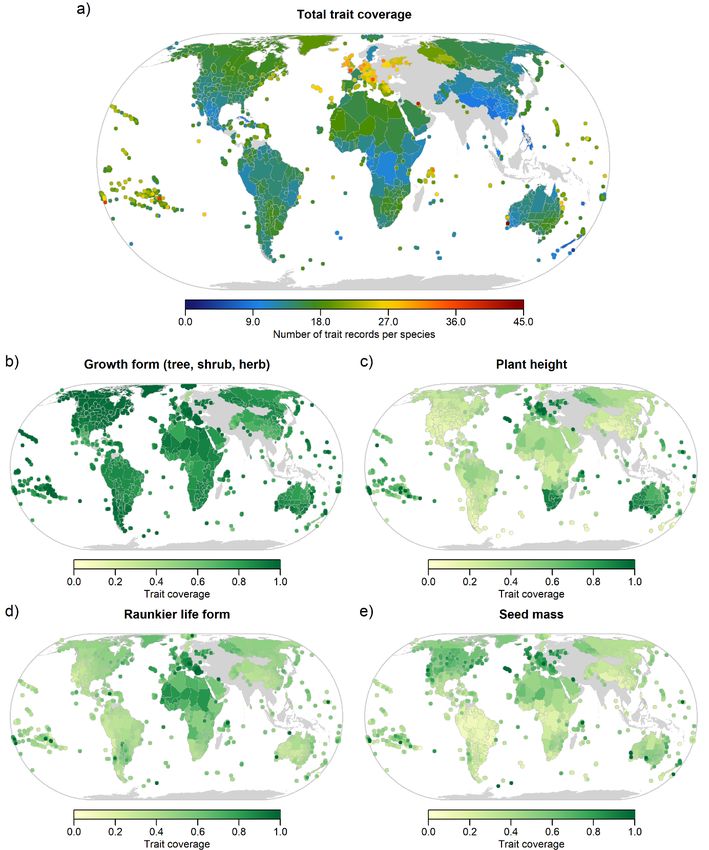
bioRxiv preprint first posted online Feb. 1, 2019; doi: http://dx.doi.org/10.1101/535005. The copyright holder for this preprint (which
       was not peer-reviewed) is the author/funder, who has granted bioRxiv a license to display the preprint in perpetuity.
                                     It is made available under a CC-BY 4.0 International license.

      unpublished Floras, catalogs, checklists and online databases into a single integrated and curated global
      database.

      The original checklist data in GIFT consist of species names from the literature, their occurrences in the
      regional species lists and original trait information (yellow boxes in Fig. 2). All this information is linked to
      meta-data on the included literature references, species lists, traits and geographic entities (white boxes
      in Fig. 2). Semi-automated workflows allow a fast and reliable integration of new datasets and provide
      extensive curated and derived information (blue boxes in Fig. 2): (1) taxonomic match-up with taxonomic
      resources and name standardization (section ‘Species names and taxonomic standardization’), (2) taxon
      placement according to a taxonomic backbone and phylogeny (section ‘Taxonomic backbone and
      phylogeny’), (3) trait standardization and hierarchical and taxonomic trait derivation (section ‘Functional
      traits’), (4) calculation of regional summary statistics like species richness or trait coverage (section
      ‘Geographic regions’) and (5) extraction and computation of geographic, environmental and socio-
      economic regional characteristics (section ‘Geographic regions’). Based on this generic database
      framework, GIFT can be queried for complete species checklists of a certain taxonomic or functional group
      and floristic status (e.g. ‘native angiosperms’ or ‘naturalized trees’). Alternatively, it is possible to extract
      distributional and functional information for a set of species, or to extract environmental information,
      species numbers and mean trait values for a set of regions. GIFT is currently stored on a MySQL 5.5.43
      database server. Workflows for preparing, importing, processing, extracting and visualizing data are
      written in the R statistical programming language (R Core Team, 2018).

      Checklists
      GIFT currently contains 3,826 species lists referring to 2,893 different geographic regions which are based
      on 429 original checklist data sources (Fig. 2). Compared to other plant diversity databases which either
      focus on other types of distribution data (point occurrences, vegetation plots, range maps) or trait data
      (individual measurements), this represents a complementary resource of unprecedented extent. A full
      and up-to-date list of all data citations and their bibliographic references is available in Appendix S 1 and
      at the GIFT website (http://gift.uni-goettingen.de), and publications based on GIFT are requested to cite
      the checklist resources the analyses are based upon (e.g in Weigelt et al., 2016). Checklists and inventories
      stem from publically available sources as well as from unpublished sources with restricted access (4.2%).
      Meta-data on references and species lists further specify the type of the reference as provided (Flora,
      checklist, catalogue, identification key, survey, etc.), the taxonomic and floristic scope of the reference
      (e.g. all native and naturalized angiosperms), whether the species’ floristic status is indicated and which
      functional traits are reported.

      The actual distribution information is kept in a separate table that links the taxonomic names to the
      species lists they occur in and via those to geographic regions (Fig. 2, ‘species occurrences’). For each
      species occurrence, we indicate, if known, whether this occurrence is native or not. For native species, we
      further indicate if species are endemic to the geographic entity of the species list or to the geographic
      entity of the entire reference, if indicated in the literature source. For non-native species, we additionally
      indicate whether they are naturalized or not (Richardson et al., 2000). We also indicate whether the
      occurrence and the different kinds of floristic status information are questionable or doubtful according
      to the literature source as binary variables. Via the species names, occurrences are linked to species-level
      functional traits as well as to the taxonomic and phylogenetic backbone. Via the geographic regions,
      species and traits are linked to regional geographical characteristics (Fig. 2). Routines to export checklists

                                                                                                                                          4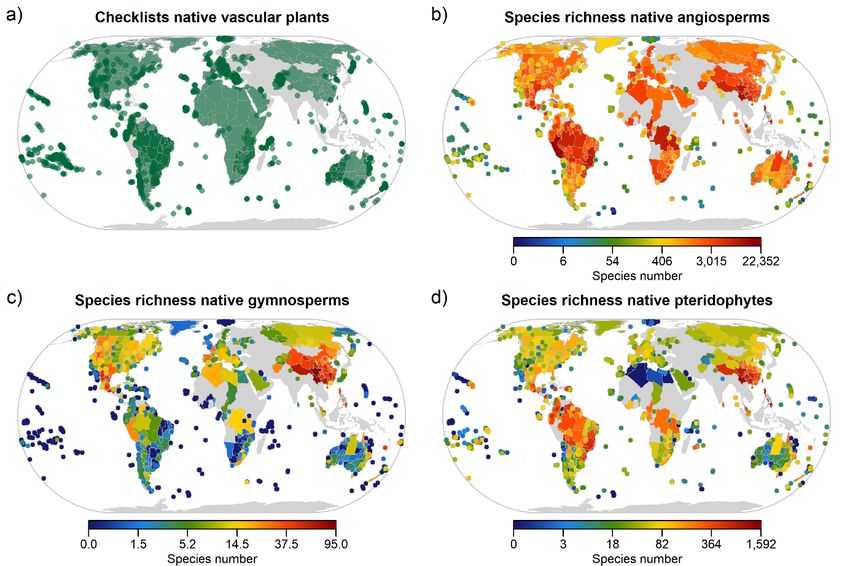
bioRxiv preprint first posted online Feb. 1, 2019; doi: http://dx.doi.org/10.1101/535005. The copyright holder for this preprint (which
       was not peer-reviewed) is the author/funder, who has granted bioRxiv a license to display the preprint in perpetuity.
                                     It is made available under a CC-BY 4.0 International license.

      from GIFT and their meta-data as Darwin Core (Wieczorek et al., 2012; Wieczorek et al., 2014) and
      Humboldt Core (Guralnick et al., 2018) archives, respectively, are currently being developed to allow easy
      integration with other kinds if distribution data (e.g. point occurrences from GBIF).

                                                                                                                                          5
bioRxiv preprint first posted online Feb. 1, 2019; doi: http://dx.doi.org/10.1101/535005. The copyright holder for this preprint (which
       was not peer-reviewed) is the author/funder, who has granted bioRxiv a license to display the preprint in perpetuity.
                                     It is made available under a CC-BY 4.0 International license.

      Fig. 2. Simplified structure of the Global Inventory of Floras and Traits database (GIFT). Meta-data on literature
      references, species lists and geographic regions builds the backbone of the database (top row). A reference can
      include several species lists (e.g. for different sub-regions) and a geographic region can be covered by several lists
      and references. Species lists vary in taxonomic and floristic scope (e.g. all native and naturalized angiosperms) and
      in the information content (floristic status, functional traits). Primary occurrence information, species names and
      functional trait data from the literature resources build the main block of original data (yellow). Automated
      workflows link those to taxonomically standardized working names, to a higher taxonomy and phylogeny of vascular
      plants and produce derived resources for analyses (blue). Grey bars indicate links among tables in a simplified way
      (most tables shown here represent several tables in the database).

      Species names and taxonomic standardization
      All species names enter the database in their original form including infraspecific information and author
      names where available. Species names derived from heterogeneous resources, referring to various
      geographic regions and published over a timespan of about one hundred years, inevitably vary in the
      taxonomic concepts applied (Jansen & Dengler, 2010). To compare species identities across different
      resources, we therefore submit all non-hybrid species names to a semi-automated taxonomic
      standardization and validation procedure based on taxonomic information provided by The Plant List 1.1
      (TPL; The Plant List, 2013) and additional resources available via iPlant’s Taxonomic Name Resolution
      Service (TNRS; Boyle et al., 2013). Names of hybrid species are currently not standardized due to
      heterogeneous formats of their scientific names. The original names are nonetheless stored for further
      processing if needed. This procedure was exclusively developed to meet the needs of the GIFT database
      and has already been applied and described in Meyer et al. (2016).

      First, all genus names not occurring in TPL are checked manually and spelling mistakes are corrected based
      on literature and online resources (e.g. Mabberley, 2008; IPNI, 2012). Entries that cannot be assigned to
      an established genus name at all (valid or not) are excluded from further steps. Second, all species names
      are compared automatically to all taxonomic names available for a particular genus in TPL based on
      pairwise orthographic distances (generalized Levenshtein distance; Levenshtein, 1966) between species
      epithets, infraspecific names, author names and the entire species names. We use both the absolute
      orthographic distance, which is the number of changes needed to transform one character string into the
      other (Levenshtein, 1966), and the relative orthographic distance, which relates the absolute orthographic
      distance to the length of the longer input string. Based on the orthographic distances of an original species
      name to all congeneric species listed in TPL, we determine the final working name hierarchically: First, we
      choose the best-matching species epithet. If multiple epithets match equally well, we choose those with
      best-matching infraspecific names (if infraspecific name available and if absolute orthographic distance <
      4 and relative orthographic distance < 0.3), and then those with best-matching author names (if author
      names available and relative orthographic distance < 0.5). The specific matching thresholds at each step
      were derived seeking a balance between the number of names that cannot be matched and the number
      of names that are matched to the wrong species. Synonyms are linked to their accepted species names as
      suggested by TPL. If several names match equally well and lead to different accepted binomial species
      names, we first remove illegitimate and invalid names, then synonyms and then accepted names with
      poorer overall orthographic distance. In addition, all names are resolved using the TNRS application
      programming interface (API), which returns similar statistics on the name matching and the status of the
      matched names like the above-described approach using TPL. For choosing standardized binomial working
      names we give priority to TPL over TNRS, because of the possibility of adjusting our TPL name matching

                                                                                                                                          6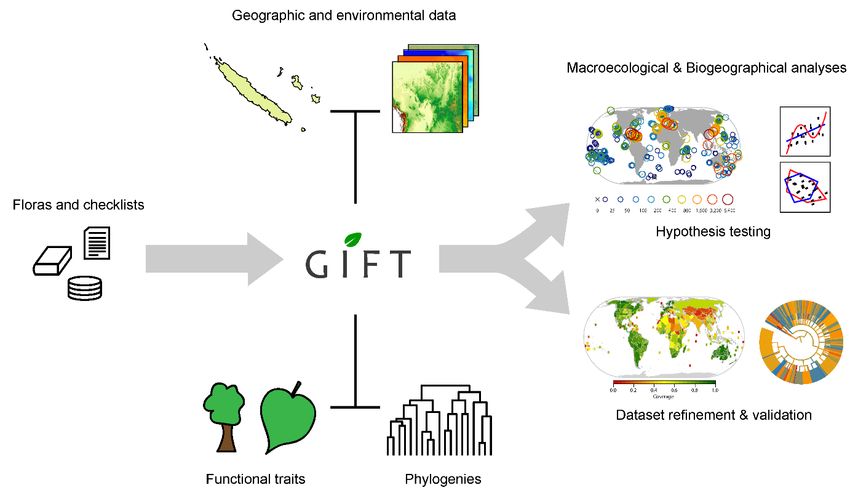
bioRxiv preprint first posted online Feb. 1, 2019; doi: http://dx.doi.org/10.1101/535005. The copyright holder for this preprint (which
       was not peer-reviewed) is the author/funder, who has granted bioRxiv a license to display the preprint in perpetuity.
                                     It is made available under a CC-BY 4.0 International license.

      approach. If a name does not match any name via TPL or TNRS with a relative orthographic distance <
      0.25 for either the epithet or the full name, we keep the original name as working name. If not stated
      otherwise summary statistics below are based on these standardized binomial working names.

      All original names, orthographic distances, matched names and meta-information about the matching are
      stored in the database (Fig. 2). Thus, the taxonomic standardization in GIFT is fully transparent and
      repeatable whenever taxonomic resources are updated or extended. Moreover, the stored information
      can be used to filter out names that did not match, matched only to a certain degree, or that do not lead
      to an accepted species name, allowing for rigorous sensitivity analyses of the effects of taxonomic
      uncertainties on the outcome of macroecological and biogeographical analyses.

      Taxonomic backbone and phylogeny
      All species working names are linked to a taxonomic backbone via their genus names. The taxonomy is
      based on the Angiosperm Phylogeny Group IV system for angiosperms (The Angiosperm Phylogeny Group,
      2016), and on the Angiosperm Phylogeny Website version 13 (Stevens, 2013) and The Plant List 1.1 for
      gymnosperms, pteridophytes and bryophytes (The Plant List, 2013). Based on the taxonomic backbone,
      the database can be queried in two directions. First, species lists can be extracted including only species
      that belong to a certain taxon (e.g. only angiosperms). Second, geographic units can be chosen for which
      species lists cover a complete taxon of interest (e.g. all regions with Bixaceae checklists). In combination,
      species lists of a certain taxon can be produced for all regions where the required data is available. In
      addition, species-level functional traits can be aggregated at any desired taxonomic level and trait
      information for broad taxonomic groups can be used to derive species-level information for traits that are
      consistent across a larger taxonomic groups.

      All seed plant species are linked to a global phylogeny with 353,185 terminal taxa (Smith & Brown, 2018)
      for phylogeographical analyses. Two versions of this phylogeny are included in the database in tabular
      form to extract checklist and trait information for particular clades and to visualize trait and taxonomic
      coverage across the phylogeny. In one version, species in GIFT not included in the phylogeny were added
      replacing all members of the genera they belong to with polytomies (Pearse et al., 2015) and in the other
      version missing species were excluded to keep detailed phylogenetic relationships among the species
      covered by the phylogeny. In addition, all vascular plant species in GIFT are linked to a phylogeny with
      fewer terminal taxa but broader phylogenetic extent (i.e. including pteridophytes; Qian & Jin, 2016), which
      was used here to assess taxonomic coverage of distribution and trait data at the family level.

      Functional traits
      Species in GIFT are linked to functional trait information from currently 155 original resources. Most trait
      resources are Floras and checklists for which annotated information on traits have been extracted, but
      also large trait compilations with or without spatial context are incorporated (e.g. Zotz, 2013; BGCI, 2017).
      The range of functional traits currently covered by GIFT reflects different aspects of plant morphology, life
      history, reproduction, physiology, genetics, and ecology (Table S 1). The focus lies on aggregated trait
      information at the species level, making GIFT a valuable complementary resource to initiatives that collate
      large amounts of trait measurements at the individual level (e.g. Kattge et al., 2011b; Enquist et al., 2016).

      Many trait resources provide equivalent information in various languages, using different terminologies
      or measurement units. The first step of trait processing in GIFT is therefore the standardization of primary
      trait data according to pertinent trait literature (Pérez-Harguindeguy et al., 2013; Garnier et al., 2017) (Fig.

                                                                                                                                          7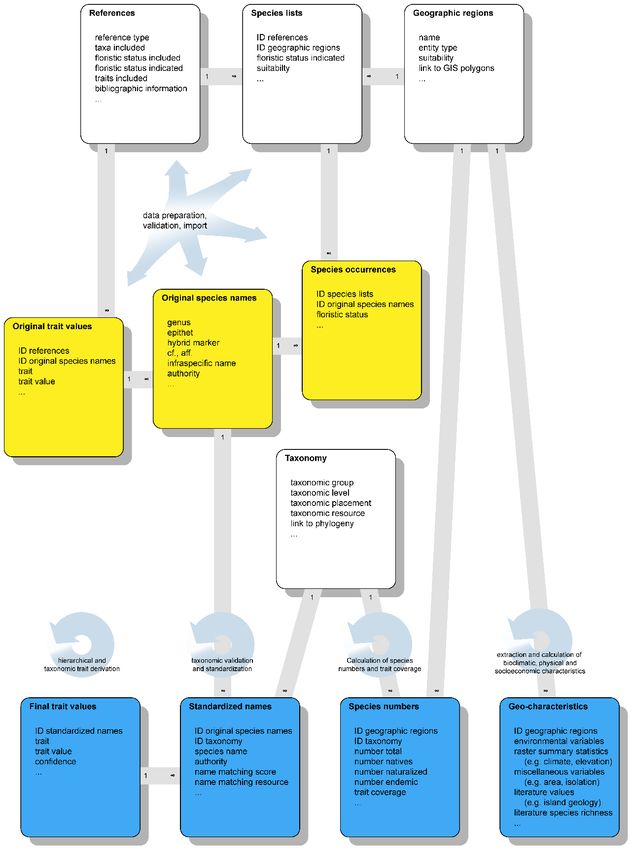
bioRxiv preprint first posted online Feb. 1, 2019; doi: http://dx.doi.org/10.1101/535005. The copyright holder for this preprint (which
       was not peer-reviewed) is the author/funder, who has granted bioRxiv a license to display the preprint in perpetuity.
                                     It is made available under a CC-BY 4.0 International license.

      3) using defined categorical levels (categorical traits) and units of measurement (numerical traits) (Table
      S 1). To retain the maximum information provided by the original resources, many categorical traits are
      defined at multiple levels of detail (e.g. life form 1 vs. life form 2). In the second trait processing step, the
      standardized trait values are therefore subjected to a hierarchical derivation procedure (Fig. 3). This
      procedure makes use of logical links and nestedness among many functional traits based on their
      definitions. For example, the value “tree” in the trait growth form implies the value “woody” in the trait
      woodiness. As such hierarchical trait derivation increases the amount of trait information in GIFT. In
      addition, hierarchical derivation ensures compatibility among different levels of detail of the same trait
      by automatically deriving values in coarser variations from available information in more detailed ones.
      We organize such hierarchical relationships between traits in a directed graph that can be easily traversed
      to fill data gaps (Fig. S 1). A tabular version of the graph is stored in the database for modifications (Table
      S 2). A similar derivation approach is implemented for taxonomic groups that are uniform with respect to
      a particular trait (taxonomic trait derivation). In this case, the basis of derivation is not the logical hierarchy
      of trait values, but that of taxonomic groups. For example, the genus Abies consists exclusively of
      monoecious trees (Farjon, 2010). Thus, all species of Abies can be characterized with respect to growth
      form “tree” and reproductive mode “monoecious” based only on their taxonomic position. Subsequently,
      the taxonomically derived species-level traits are subjected to the hierarchical derivation as outlined
      above.

      Fig. 3. Trait processing in GIFT. Original trait records entering GIFT are subjected to three processing steps: (1) Trait
      values are standardized with respect to language, terminology and measurement unit. (2) Additional trait values are
      derived hierarchically for traits that are logically nested (Fig. S 1), and taxonomically for species that belong to
      taxonomic groups that are uniform with respect to a particular trait. (3) Derived trait values are aggregated at the
      species level based on the consensus among resources (categorical traits) or summary statistics are computed based
      on the original values (numerical traits).

                                                                                                                                          8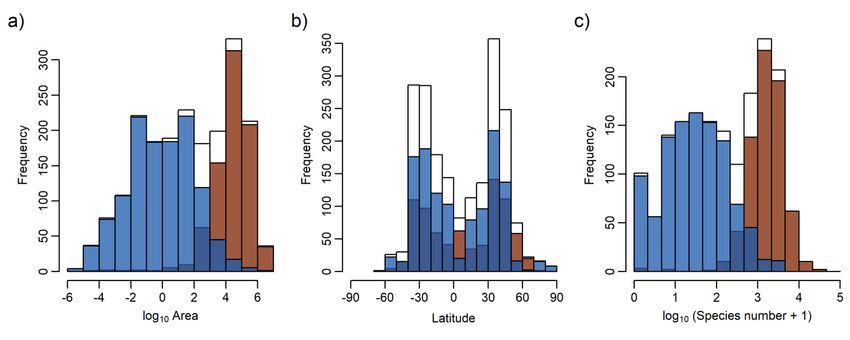
bioRxiv preprint first posted online Feb. 1, 2019; doi: http://dx.doi.org/10.1101/535005. The copyright holder for this preprint (which
       was not peer-reviewed) is the author/funder, who has granted bioRxiv a license to display the preprint in perpetuity.
                                     It is made available under a CC-BY 4.0 International license.

      The original and derived trait data in GIFT may include several values per trait-species combination. To
      obtain a single, standardized value per trait and species, original and derived trait values are aggregated
      based on the consensus among resources (categorical variables, 66 % consensus threshold) or summary
      statistics are computed based on the original values (numerical variables, currently: mean, minimum and
      maximum) (Fig. 3). Trait derivation and aggregation for a given species are repeated each time a new trait
      record enters the database, such that the final values and consensus rates are continually re-evaluated in
      the light of new information. Throughout the entire procedure of trait processing, information can be
      traced back to their original reference and unstandardized value. This provides a basis for implementing
      advanced gap-filling (Schrodt et al., 2015) and aggregation techniques (Kattge et al., 2011a) in the future.

      Geographic regions
      As indicated in the original literature resources, each regional species checklist in GIFT unambiguously
      refers to a geographic region, e.g. an island, archipelago, a political or biogeographical unit, or a protected
      area. To make most out of the spatial delineation of the geographic regions, we assemble spatial polygons
      from the Biodiversity Information Standards Working Group (TDWG, 2007), the GADM database of Global
      Administrative Areas (Hijmans et al., 2009), single island polygons extracted from GADM (see Weigelt et
      al., 2013), the Global Island Database (UNEP-WCMC, 2013), the World Database on Protected Areas
      (UNEP-WCMC, 2014), or digitize regions manually according to the checklist literature resources. The
      regions vary in area by 13 orders of magnitude, ranging from small islands to large countries and botanical
      continents (Fig. S 2). Many regions may overlap with each other and small regions are frequently nested
      in larger ones (e.g. Yosemite National Park in California in the US). The degree of overlap is calculated
      automatically and recorded in the database to exclude overlapping entities or aggregate information for
      analyses.

      For each original geographic region, a suite of 123 physical geographic, bioclimatic and socio-economic
      characteristics is computed for macroecological analyses based on the regions’ spatial information and
      additional spatial datasets (Fig. S 3, Table S 3). Specifically, this includes (1) characteristics based on the
      spatial polygon itself like its area, centroid coordinates and geographic extent, (2) summary statistics (15
      quantiles including minimum, median and maximum, mean, standard deviation, mode, number of unique
      values, Shannon diversity and number of cells) derived from raster layers like digital elevation models
      (Danielson & Gesch, 2011), global climatologies (e.g. CHELSA; Karger et al., 2017) or human population
      density (Doxsey-Whitfield et al., 2015), and (3) miscellaneous metrics calculated from additional spatial
      resources like biogeographic region affinity (Takhtajan, 1986) or island isolation (Weigelt & Kreft, 2013)
      (Fig. S 3c).

      For families and higher taxonomic groups, we automatically calculate the number of all species, native
      species, naturalized species and endemic species for all regions that are covered by checklists for the given
      combination of taxonomic group and floristics status. Additionally, we calculate for the same taxonomic
      groups and floristic subsets the percent trait coverage for all functional traits covered by the database. It
      is hence possible to extract and visualize for which regions and taxa what information in terms of species
      checklists and functional traits is available. Based on the various checklist resources available for each
      geographic region, we decide whether the checklist information should theoretically completely cover the
      whole native vascular or angiosperm flora. This, however, is only a rough and subjective estimate and
      given the huge amount of unexplored plant diversity especially in the tropics and only partial
      completeness of the according Floras, it needs further evaluation. To this end, we are currently

                                                                                                                                          9
bioRxiv preprint first posted online Feb. 1, 2019; doi: http://dx.doi.org/10.1101/535005. The copyright holder for this preprint (which
was not peer-reviewed) is the author/funder, who has granted bioRxiv a license to display the preprint in perpetuity.
It is made available under a CC-BY 4.0 International license.
incorporating species numbers and richness estimates from the literature (Frodin, 2001; Kreft & Jetz,
2007) into the database and develop workflows to compare them to the species numbers derived from
the checklists. Regions deviating considerably from these literature values can be excluded from analyses
if needed. The same way regional trait coverage can be used to exclude regions with little trait information
from analyses on trait patterns.
Versioning
This paper describes GIFT version 1.0. New data are incorporated into GIFT in chunks and each time new
data are added or workflows are modified, a new version is released. Changes will be documented at
http://gift.uni-goettingen.de/about. Old versions are backed up and can be restored to reproduce
analyses carried out on older versions of the database.
Current state
Geographic coverage
Initially, GIFT started with the collection of Floras and checklists for oceanic islands and the basic
workflows have been developed for various projects focusing on island plant diversity (Weigelt, 2015;
Weigelt et al., 2016). Island floras usually host a comparatively limited set of species and have clearly
defined geographic boundaries. As such, they have attracted a lot of scientific interest in the past, leading
to a high availability of island Floras and checklists. GIFT therefore offers a very comprehensive overview
over the floristic composition of 1,845 of the world’s islands, which has already led to a variety of studies
on island biodiversity patterns and their determinants (Weigelt et al., 2013; Cabral et al., 2014; e.g.
Weigelt et al., 2015; Weigelt et al., 2016; Lenzner et al., 2017). More recently, GIFT has been expanded to
mainland floras, currently covering 1,048 distinct regions, to support comparative analyses of continental
and insular floras (e.g. König et al., 2017) and extensive studies of global plant diversity.
In total, GIFT currently includes 2,963,438 species-by-region occurrences for 315,164 standardized species
names across 2,893 geographic regions covering the whole globe. For 92.7 % of the occurrences the native
status and for 47.5 % endemism is reported. 2,062 have at least one checklist for all native vascular plants,
together covering all floristic kingdoms and biomes and 79.1 % of the earth’s land surface excluding
Antarctica (Fig. 4a). After removing overlapping entities to avoid pseudo-replication, up to 1,841 regions
and 58.2 % land surface coverage remain when prioritizing small entities (> 100 km²) over large entities,
and 1,555 regions and 73.1 % land surface coverage remain when prioritizing large entities over small
entities (single islands always prioritized over island groups). Geographic coverage varies with focal
taxonomic group (Fig. 4, Table 1) and floristic status (Fig. S 4), and is highest for native species. The largest
gaps for native vascular plant floras are currently located in Tropical Africa, the Middle East, Central
Eurasia, and South East Asia (Fig. 4). Data gaps in GIFT do not necessarily represent true knowledge gaps.
Floras of the countries of the former USSR, West Africa, Madagascar, Java and India, for example, are
available and are currently in the process of being incorporated.
Since many Floras refer to entire countries of various sizes, and some of the resources in GIFT use broad
distributional classifications (e.g. WCSP, 2012; BGCI, 2017), many mainland regions in GIFT are relatively
large (mean area = 170,287 km², median = 30,454 km²), especially in comparison to an average island
(3,265 km²; Fig. S 2). However, GIFT also includes mainland regions of small sizes like protected areas and
small political units, since smaller units span smaller environmental gradients, and thus provide a tighter
10bioRxiv preprint first posted online Feb. 1, 2019; doi: http://dx.doi.org/10.1101/535005. The copyright holder for this preprint (which
was not peer-reviewed) is the author/funder, who has granted bioRxiv a license to display the preprint in perpetuity.
It is made available under a CC-BY 4.0 International license.
link between taxonomic, functional and phylogenetic species composition and aggregated abiotic
conditions (Pearson & Dawson, 2003).
Fig. 4. Spatial coverage of checklist data currently stored in GIFT. a) Regions with checklist data for native vascular
plants. Darker green shade indicates overlapping regions. b-d) Checklist coverage and species richness of major
taxonomic groups for regions with theoretically complete inventories. Polygons are plotted sequentially in order of
decreasing area to show smaller regions on top of larger regions, in the case where they overlap. RegionsbioRxiv preprint first posted online Feb. 1, 2019; doi: http://dx.doi.org/10.1101/535005. The copyright holder for this preprint (which
was not peer-reviewed) is the author/funder, who has granted bioRxiv a license to display the preprint in perpetuity.
It is made available under a CC-BY 4.0 International license.
all working names are names that were adopted unchanged from the original names because they could
not be adequately matched to taxonomic resources.
Table 1. Current content of GIFT for selected major plant groups in terms of number of regions with supposedly full
inventories for native species, unstandardized taxonomic names, standardized species names, species with resolved
taxonomy, and trait records.
Taxonomic group Regions Names Species Species resolved Trait records
Embryophyta 53 717117 324136 277580 2307100
Tracheophyta 2062 714781 322002 275610 2306973
Pteridophyta 2079 24241 11888 8408 54772
Gymnospermae 2211 4031 1151 1051 12352
Angiospermae 2218 686509 308963 266151 2239849
Orchidaceae 2478 64508 28155 27029 192332
Asteraceae 2218 58492 27755 24450 167300
Fabaceae 2218 46999 21000 18416 145895
Poaceae 2431 38464 12368 11215 130492
Rubiaceae 2431 29485 14260 13545 96684
Lamiaceae 2431 18120 7882 7560 61708
Trait coverage
In total, there are 3,475,337 original trait records referring to 550,892 original taxon names. Hierarchical
trait derivation yields an additional 1,261,718 trait records. After aggregating original and derived trait
records, i.e. resolving species names and combining trait records for identical species, 2,307,100 species-
trait combinations for 267,978 standardized species remain for ecological analyses (Table 1).
The majority of trait information in GIFT refers to morphological characteristics (Table S 1) such as
woodiness (234,214 species) climbing habit (223,280 species), or growth form (213,372 species). Life
history traits such as life form (100,607 species) or life cycle (84,206 species) are the second most common
trait category. Other categorical traits are considerably rarer, e.g. photosynthetic pathway (31,534
species), dispersal syndrome (8,204 species), or pollination syndrome (4,511 species). Also quantitative
traits such as maximum plant height (53,449 species), mean seed mass (23,874 species) or mean specific
leaf area (2,304 species) are comparatively poorly covered. As such, GIFT represents a complimentary
resource to existing trait databases which provide more records for numerical traits frequently measured
in the field at the individual level (Pérez-Harguindeguy et al., 2013), but have considerable lower coverage
in terms of whole plant traits like, for example, growth form (84,459 species in BIEN 4.1 (Enquist et al.,
2016) and 99,217 species in TRY 4.1 (Kattge et al., 2011b)) or life form (12,708 species in TRY 4.1).
To illustrate patterns in the geographic and taxonomic trait coverage of GIFT, we use the overall coverage
across all traits as well as four exemplary traits (growth form, plant height, life form and seed mass).
Geographically, most trait information per species is available in Europe and some comparatively species-
poor temperate islands (Fig. 6a). Also, non-tropical parts of the Americas, Africa and Australia are well
12bioRxiv preprint first posted online Feb. 1, 2019; doi: http://dx.doi.org/10.1101/535005. The copyright holder for this preprint (which
was not peer-reviewed) is the author/funder, who has granted bioRxiv a license to display the preprint in perpetuity.
It is made available under a CC-BY 4.0 International license.
covered, whereas tropical regions in Africa and South-East Asia are least well covered with respect to their
plant functional characteristics. However, geographic coverage varies strongly among individual
functional traits. Frequent traits such as growth form are available for most species in almost every
floristic region, whereas the coverage of less well-covered traits is strongly dependent on the geographic
scope of the main contributing resources (Fig. 6). Life form sensu Raunkiær (1907), for example, is widely
available throughout Europe, but rarely reported for species in other regions of the world (Fig. 6d).
Likewise, plant height and seed mass exhibit uneven geographical coverage distributions, with highest
coverage in Australia, South Africa and Europe (Fig. 6c&e).
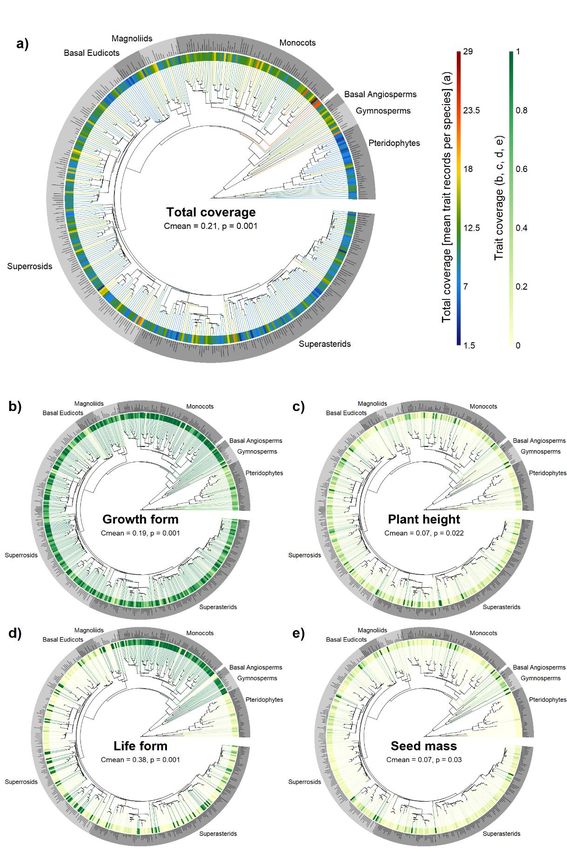
Fig. 5. Taxonomic coverage of distribution data in GIFT at the family level. Tip color and inner ring color indicate the
proportion of species with distribution information relative to all species of a given family, the grey outer ring
delimits major clades of vascular plants. The height of bars in the outer ring is proportional to log 10 total family
species richness. Phylogenetic signal in taxonomic coverage was assessed as Abouheif’s Cmean, a measure of
phylogenetic autocorrelation based on the sum of the successive squared differences between values of
neighbouring tips in the phylogeny (Abouheif, 1999).
The taxonomic coverage of trait information in GIFT has small, yet significant phylogenetic signal (Cmean
= 0.21, p < 0.001, Fig. S 5a). That is there is a mild bias towards certain taxonomic groups, e.g. monocots,
in overall coverage of trait data. Examining phylogenetic signal at the level of individual traits reveals
interesting patterns (Fig. S 5b-e). For example, plant height is very well covered for the graminid clade
(leftmost group within the monocots, Fig. S 5c), and Raunkiær life form is particularly well covered in
gymnosperms and monocots (Fig. S 5d).
13bioRxiv preprint first posted online Feb. 1, 2019; doi: http://dx.doi.org/10.1101/535005. The copyright holder for this preprint (which
was not peer-reviewed) is the author/funder, who has granted bioRxiv a license to display the preprint in perpetuity.
It is made available under a CC-BY 4.0 International license.
Fig. 6. (a) Total number of trait records per native angiosperm species per region and (b-e) trait coverage per region
(number of native angiosperm species with trait information/number of all native angiosperm species) for exemplary
traits with characteristic geographic patterns in coverage. Polygons are plotted sequentially in order of decreasing
area to show smaller regions on top of larger regions, in the case where they overlap. RegionsbioRxiv preprint first posted online Feb. 1, 2019; doi: http://dx.doi.org/10.1101/535005. The copyright holder for this preprint (which
was not peer-reviewed) is the author/funder, who has granted bioRxiv a license to display the preprint in perpetuity.
It is made available under a CC-BY 4.0 International license.
Web interface
A live overview over the current content of GIFT is available through a web interface at http://gift.uni-
goettingen.de. It provides summary statistics and allows producing customized richness and trait coverage
maps for every combination of taxonomic group and floristic subset based on the species numbers and
trait coverage values in the database. It is possible to see for which regions and taxa what information in
terms of species checklists and functional traits is available and to browse the bibliographic references.
Applications and outlook
Curated regional plant species composition data from Floras and plant checklists, and diverse information
on species characteristics and their environment as integrated in GIFT (Fig. 1) allows to move global plant
diversity research beyond using species richness as a proxy for biodiversity (Barthlott et al., 2005; Kreft &
Jetz, 2007; Kreft et al., 2008). Examining the drivers of taxonomic, functional and phylogenetic diversity
and turnover (Tuomisto, 2010; Qian et al., 2013; Lamanna et al., 2014; Weigelt et al., 2015; König et al.,
2017) may help to disentangle the mechanisms underlying global plant diversity more directly (Graham
et al., 2014). Functional biogeography, for example, combines the mechanistic focus of functional ecology
with the large eco-evolutionary scales of biogeography (Violle et al., 2014) and thus provides a direct link
between measures of organismal performance and a wide range of abiotic and biotic conditions. Although
functional biogeographical approaches already provided significant insights into patterns and drivers of
functional diversity (Moles et al., 2014; Reichstein et al., 2014; Engemann et al., 2016; Butler et al., 2017),
the availability and representativeness of data on plant traits and distributions remains a limiting factor.
Together with distribution and floristic status information available in GIFT (e.g. native, naturalized,
endemic), functional traits may help to better understand the biogeographic history of plant life on Earth
and its anthropogenic stressors. Analyses of endemic species and their traits, for example, can shed light
on the evolution of new species and their contribution to current biogeographic patterns (Weigelt et al.,
2016). Naturalized alien species and their traits help to understand the role of humans in changing plant
assemblages and may teach us how new habitats and regions are colonized. Knowledge on the
composition of native vs. alien floras (see www.glonaf.org; van Kleunen et al., 2015; Pyšek et al., 2017)
allows to tackle pressing questions in invasion ecology, for example what native floras are susceptible to
plant invasions and how regional plant composition changes due to the naturalization of alien species
(Winter et al., 2009).
Apart from direct use as data source for macroecological or biogeographical research, GIFT is also a
valuable resource to validate or expand other distribution or trait datasets (Fig. 1). Having near-global and
full taxonomic coverage of distribution data (Fig. 4) and several functional traits (Table S 1), GIFT can help
to assess the representativeness of macroecological datasets and to overcome data limitations to find
answers to fundamental questions in functional biogeography and macroecology (FitzJohn et al., 2014;
e.g. Scheffer et al.; König et al., in prep.). It may for example help to estimate whether data from resources
like GBIF or TRY are sufficiently complete or representative for analyses of a given taxon, region or
functional group (Meyer et al., 2016; König et al., in prep.). Alternatively, GIFT can also be used to infer
the floristic status of plant point occurrences (e.g. to tell apart native and non-native species), to identify
unlikely or dubious occurrences or to infer local species absences. The latter may be particularly useful
for species distribution modelling where random pseudo-absences are commonly used when true
absences are not known (Lobo et al., 2010; Barbet-Massin et al., 2012). Furthermore, GIFT can be used to
define regional species pools of local plant communities (Karger et al., 2016), for example, for identifying
15bioRxiv preprint first posted online Feb. 1, 2019; doi: http://dx.doi.org/10.1101/535005. The copyright holder for this preprint (which
was not peer-reviewed) is the author/funder, who has granted bioRxiv a license to display the preprint in perpetuity.
It is made available under a CC-BY 4.0 International license.
likely source regions of species that colonize oceanic islands (König et al., 2019). Defining the regional
species pool or inferring the floristic status may not only be important for macroecological studies but
also for field projects at the local to regional scale.
The aggregated nature of data in GIFT, i.e. distribution data at the level of geographic regions and
functional traits at the species level allow to achieve taxonomic and geographic coverage which currently
is not available in databases of more highly resolved distribution and trait data (e.g. point occurrences
and individual level trait measurements) (König et al., in prep.). It is a mid-term goal of GIFT to reach full
global coverage of vascular plant checklists. Already now, 79.1 % of the global land surface is covered and
further Floras and checklists covering missing parts are currently processed. Realistically, GIFT will reach
about 90% spatial coverage in 2019 and will serve as a representative resource for analyses of global plant
diversity. In the meantime, regions already covered by coarse geographical units will be complemented
by finer-scale data, and new literature resources will be included to update outdated checklists. Once the
availability of checklists per region has further increased, workflows to spatially aggregate them will be
developed. This will include the identification of conflicting information and choice of the best and most
up-to-date information as well as derivation of the floristic status from small to large regions and vice-
versa.
A major challenge regards the evaluation of checklist quality and completeness in GIFT (Hortal et al.,
2015). The species richness data sets currently being included allow for a comparison of expected and
actual species numbers, but also the integration of other data like, for example, point occurrence
information as provided by GBIF or vegetation plot data (Bruelheide et al., 2018) may help to estimate
completeness of the regional checklists in GIFT and eventually to update them. Furthermore, the lack of
cosmopolitan or regionally common species in checklists, an uneven representation of expected higher
taxa, or deviances from expected ecological relationships like, for example, the species area relationship
or the latitudinal diversity gradient may be used to flag potentially incomplete checklists (Santos et al.,
2010). Also conflicting information, like species endemic in one region and native in another (currently
0.39 % of 246,583 species across 2,258 non-overlapping regions) or species not occurring in a region but
present in a nested region (currently 5.73 % of 504,389 native species occurrences across 614 regions that
are nested in 114 larger regions), can be used to flag potentially incomplete regions. Regions with
incomplete checklists can then be excluded from analyses or survey effort can be included in statistical
models and data acquisition can be prioritized for those regions (Meyer et al., 2016).
In conclusion, GIFT offers a novel integrated database framework to study the geographic distribution of
plant life across the globe. The integration of regional plant checklists with functional traits, phylogenetic
relationships and regional environmental characteristics allows for the extraction of well-curated, high
quality macroecological datasets for hypothesis testing and the validation and extension (Maitner,
2018)of alternative resources. In addition, the outlined database framework can serve as an example for
other taxa with insufficiently complete information at the level of individual species and for an integration
of comparable data types such as vegetation plots or surveys. The spatially nested structure of regions in
GIFT allows for an ongoing inclusion of resources to improve inventory quality and spatial resolution in
future database releases.
16bioRxiv preprint first posted online Feb. 1, 2019; doi: http://dx.doi.org/10.1101/535005. The copyright holder for this preprint (which
was not peer-reviewed) is the author/funder, who has granted bioRxiv a license to display the preprint in perpetuity.
It is made available under a CC-BY 4.0 International license.
Data accessibility
GIFT integrates various data types from different data domains such as species names, distributions, traits,
taxonomy, phylogenies and environmental data. The database structure is relational and highly complex,
and data in GIFT may exhibit systematic gaps, biases and uncertainties that users need to account for.
Additionally, the data stem from resources with various terms of use. Data from GIFT is therefore currently
available upon request. Derived diversity metrics and individual regional checklists without sharing
restrictions by the data providers will be be shared without conditions. More complex and larger scale
data are available within scientific collaborations. However, we are currently developing data extraction
tools (comparable to those in the BIEN R package; Maitner, 2018) that enable users to retrieve data from
GIFT and prepare them for macrocological and biogeographical analyses
(https://github.com/BioGeoMacro/GIFT-export). Once these tools have reached a status that allows easy
handling of the complex content of the database, consideration of data restrictions of the original data
sources and evaluation of potential biases, GIFT will become publicly available. Already now, naturalized
alien species occurrences from GIFT are included in and accessible via the global naturalized alien flora
(GloNAF) database (van Kleunen et al., 2019) and first trait data (e.g. plant growth form) will be published
and made publicly available via the online portals of TRY (https://www.try-db.org) and GIFT
(http://gift.uni-goettingen.de). The GIFT website also provides an interactive visualization of the
geographic coverage of checklist and trait information in GIFT and allows the user to discover data. Here,
users can select taxonomic groups and floristic subsets to map aggregated patterns of species richness or
percent trait coverage for a given trait across the covered geographic regions. Furthermore, unrestricted
species distributions from GIFT will be implemented in the near future for visualization on the Map of Life
website (https://mol.org/).
Acknowledgements
We are grateful to a large group of data contributors who provided either raw and unpublished or
digitized Floras and checklists. A full list of all data citations and their bibliographic references is
available at the GIFT website (http://gift.uni-goettingen.de). Special thanks go to the GloNAF core team
(www.glonaf.org) and Anke Stein for help with finding and digitizing numerous checklists. We thank
Martin Turjak for help with developing the database infrastructure and GIFT web-interface and Judith
Krobbach, Dagmar Jahn, Lukas Conrad and Julian Schrader for digitizing and preparing checklists for the
database import. The GIFT project was founded by HK and initially funded by start-up funding granted to
HK via the Free Floater Program in the Excellence Initiative of the University of Göttingen (funded by the
German Research Foundation) and is currently financed by core institutional support of the Faculty of
Forest Sciences and Forest Ecology at University of Göttingen.
Author Contributions
PW and HK conceived the GIFT database. All authors led the collection of checklist and trait data. PW
and CK developed the workflows for importing and processing data in GIFT and for calculating derived
variables. PW and CK performed the analyses presented here and all authors contributed to writing the
manuscript.
17bioRxiv preprint first posted online Feb. 1, 2019; doi: http://dx.doi.org/10.1101/535005. The copyright holder for this preprint (which
was not peer-reviewed) is the author/funder, who has granted bioRxiv a license to display the preprint in perpetuity.
It is made available under a CC-BY 4.0 International license.
References
Abouheif, E. (1999) A method for testing the assumption of phylogenetic independence in comparative data. Evolutionary Ecology
Research, 1, 895-909.
Acevedo-Rodríguez, P. & Strong, M.T. (2007) Catalogue of the seed plants of the West Indies Website. Available at:
http://botany.si.edu/antilles/WestIndies/index.htm (accessed 5 November 2014).
Barbet-Massin, M., Jiguet, F., Albert, C.H. & Thuiller, W. (2012) Selecting pseudo-absences for species distribution models: how,
where and how many? Methods in Ecology and Evolution, 3, 327-338.
Barthlott, W., Mutke, J., Rafiqpoor, D., Kier, G. & Kreft, H. (2005) Global centers of vascular plant diversity. Nova Acta Leopoldina,
92, 61-83.
Barthlott, W., Burstedde, K., Geffert, J.L., Ibisch, P.L., Korotkova, N., Miebach, A., Rafiqpoor, M.D., Stein, A. & Mutke, J. (2015)
Biogeography and biodiversity of cacti. Univ.-Verlag Isensee, Germany.
BGCI (2017) GlobalTreeSearch online database. Available at: www.bgci.org/global_tree_search.php (accessed 31.07.2017).
BirdLife International (2018) Taxonomic Checklist of the Birds of the World. Available at: http://www.birdlife.org (accessed 20
February 2018).
Boyle, B., Hopkins, N., Lu, Z., Garay, J.A.R., Mozzherin, D., Rees, T., Matasci, N., Narro, M.L., Piel, W.H. & Mckay, S.J. (2013) The
taxonomic name resolution service: an online tool for automated standardization of plant names. BMC Bioinformatics,
14, 16.
Brach, A.R. & Song, H. (2006) eFloras: New directions for online floras exemplified by the Flora of China Project. Taxon, 55, 188-
192.
Bruelheide, H., Dengler, J., Purschke, O., Lenoir, J., Jiménez-Alfaro, B., Hennekens, S.M., Botta-Dukát, Z., Chytrý, M., Field, R.,
Jansen, F., Kattge, J., Pillar, V.D., Schrodt, F., Mahecha, M.D., Peet, R.K., Sandel, B., van Bodegom, P., Altman, J., Alvarez-
Dávila, E., Arfin Khan, M.A.S., Attorre, F., Aubin, I., Baraloto, C., Barroso, J.G., Bauters, M., Bergmeier, E., Biurrun, I.,
Bjorkman, A.D., Blonder, B., Čarni, A., Cayuela, L., Černý, T., Cornelissen, J.H.C., Craven, D., Dainese, M., Derroire, G., De
Sanctis, M., Díaz, S., Doležal, J., Farfan-Rios, W., Feldpausch, T.R., Fenton, N.J., Garnier, E., Guerin, G.R., Gutiérrez, A.G.,
Haider, S., Hattab, T., Henry, G., Hérault, B., Higuchi, P., Hölzel, N., Homeier, J., Jentsch, A., Jürgens, N., Kącki, Z., Karger,
D.N., Kessler, M., Kleyer, M., Knollová, I., Korolyuk, A.Y., Kühn, I., Laughlin, D.C., Lens, F., Loos, J., Louault, F., Lyubenova,
M.I., Malhi, Y., Marcenò, C., Mencuccini, M., Müller, J.V., Munzinger, J., Myers-Smith, I.H., Neill, D.A., Niinemets, Ü.,
Orwin, K.H., Ozinga, W.A., Penuelas, J., Pérez-Haase, A., Petřík, P., Phillips, O.L., Pärtel, M., Reich, P.B., Römermann, C.,
Rodrigues, A.V., Sabatini, F.M., Sardans, J., Schmidt, M., Seidler, G., Silva Espejo, J.E., Silveira, M., Smyth, A., Sporbert, M.,
Svenning, J.-C., Tang, Z., Thomas, R., Tsiripidis, I., Vassilev, K., Violle, C., Virtanen, R., Weiher, E., Welk, E., Wesche, K.,
Winter, M., Wirth, C. & Jandt, U. (2018) Global trait–environment relationships of plant communities. Nature Ecology &
Evolution, 2, 1906-1917.
Butler, E.E., Datta, A., Flores-Moreno, H., Chen, M., Wythers, K.R., Fazayeli, F., Banerjee, A., Atkin, O.K., Kattge, J., Amiaud, B.,
Blonder, B., Boenisch, G., Bond-Lamberty, B., Brown, K.A., Byun, C., Campetella, G., Cerabolini, B.E.L., Cornelissen, J.H.C.,
Craine, J.M., Craven, D., de Vries, F.T., Díaz, S., Domingues, T.F., Forey, E., González-Melo, A., Gross, N., Han, W., Hattingh,
W.N., Hickler, T., Jansen, S., Kramer, K., Kraft, N.J.B., Kurokawa, H., Laughlin, D.C., Meir, P., Minden, V., Niinemets, Ü.,
Onoda, Y., Peñuelas, J., Read, Q., Sack, L., Schamp, B., Soudzilovskaia, N.A., Spasojevic, M.J., Sosinski, E., Thornton, P.E.,
Valladares, F., van Bodegom, P.M., Williams, M., Wirth, C. & Reich, P.B. (2017) Mapping local and global variability in plant
trait distributions. Proceedings of the National Academy of Sciences, 114, E10937–E10946.
Cabral, J.S., Weigelt, P., Kissling, W.D. & Kreft, H. (2014) Biogeographic, climatic and spatial drivers differentially affect α-, β- and
γ-diversities on oceanic archipelagos. Proceedings of the Royal Society Biological Sciences Series B, 281, 20133246.
Danielson, J.J. & Gesch, D.B. (2011) Global Multi-resolution Terrain Elevation Data 2010 (GMTED2010). U.S. Geological Survey,
Reston, Virginia.
Doxsey-Whitfield, E., MacManus, K., Adamo, S.B., Pistolesi, L., Squires, J., Borkovska, O. & Baptista, S.R. (2015) Taking Advantage
of the Improved Availability of Census Data: A First Look at the Gridded Population of the World, Version 4. Papers in
Applied Geography, 1, 226-234.
Engemann, K., Sandel, B., Enquist, B.J., Jørgensen, P.M., Kraft, N., Marcuse-Kubitza, A., McGill, B., Morueta-Holme, N., Peet, R.K.,
Violle, C., Wiser, S. & Svenning, J.-C. (2016) Patterns and drivers of plant functional group dominance across the Western
Hemisphere: a macroecological re-assessment based on a massive botanical dataset. Botanical Journal of the Linnean
Society, 180, 141-160.
18You can also read