Graph-Based Simulation for Cyber-Physical Attacks on Smart Buildings
←
→
Page content transcription
If your browser does not render page correctly, please read the page content below
Graph-Based Simulation for Cyber-Physical Attacks on
                      Smart Buildings

                                    Rahul Agarwal

                       Thesis submitted to the Faculty of the
                 Virginia Polytechnic Institute and State University
              in partial fulfillment of the requirements for the degree of

                                  Master of Science
                                           in
                         Computer Science and Application

                                   Na Meng, Chair
                                     Xinghua Gao
                                     Edward Fox
                                    Anuj Karpatne

                                     May 10, 2021
                                 Blacksburg, Virginia

Keywords: cyber-physical attack, smart building, graph-theory, agent-based simulation
                           Copyright 2021, Rahul Agarwal
Graph-Based Simulation for Cyber-Physical Attacks on
Smart Buildings

Rahul Agarwal

(ABSTRACT)

As buildings evolve towards the envisioned smart building paradigm, smart buildings’ cyber-
security issues and physical security issues are mingling. Although research studies have been
conducted to detect and prevent physical (or cyber) intrusions to smart building systems
(SBS), it is still unknown (1) how one type of intrusion facilitates the other, and (2) how such
synergic attacks compromise the security protection of whole systems. To investigate both
research questions, the author proposes a graph-based testbed to simulate cyber-physical
attacks on smart buildings. The testbed models both cyber and physical accesses of a smart
building in an integrated graph, and simulates diverse cyber-physical attacks to assess their
synergic impacts on the building and its systems. In this thesis, the author presents the
testbed design and the developed prototype, SHSIM. An experiment is conducted to simu-
late attacks on multiple smart home designs and to demonstrate the functions and feasibility
of the proposed simulation system.
Graph-Based Simulation for Cyber-Physical Attacks on
Smart Buildings

Rahul Agarwal

(GENERAL AUDIENCE ABSTRACT)

A smart home/building is a residence containing multiple connected devices which enable
remote monitoring, automation, and management of appliances and systems, such as lighting,
heating, entertainment, etc. Since the early 2000s, this concept of a smart home has become
quite popular due to rapid technological improvement. However, it brings with it a lot of
security issues. Typically, security issues related to smart homes can be classified into two
types - (1) cybersecurity and (2) physical security. The cyberattack involves hacking into
a network to gain remote access to a system. The physical attack deals with unauthorized
access to spaces within a building by damaging or tampering with access control. So far the
two kinds of attacks on smart homes have been studied independently. However, it is still
unknown (1) how one type of attack facilitates the other, and (2) how the combination of
two kinds of attacks compromises the security of the whole smart home system. Thus, to
investigate both research questions, we propose a graph-based approach to simulate cyber-
physical attacks on smart homes/buildings. During the process, we model the smart home
layout into an integrated graph and apply various cyber-physical attacks to assess the security
of the smart building. In this thesis, I present the design and implementation of our tool,
SHSIM. Using SHSIM we perform various experiments to mimic attacks on multiple smart
home designs. Our experiments suggest that some current smart home designs are vulnerable
to cyber-physical attacks.
Dedication

                 To my mother, Nisha Agarwal.
                  For all the love and support
             she has provided me as a single parent.

                               iv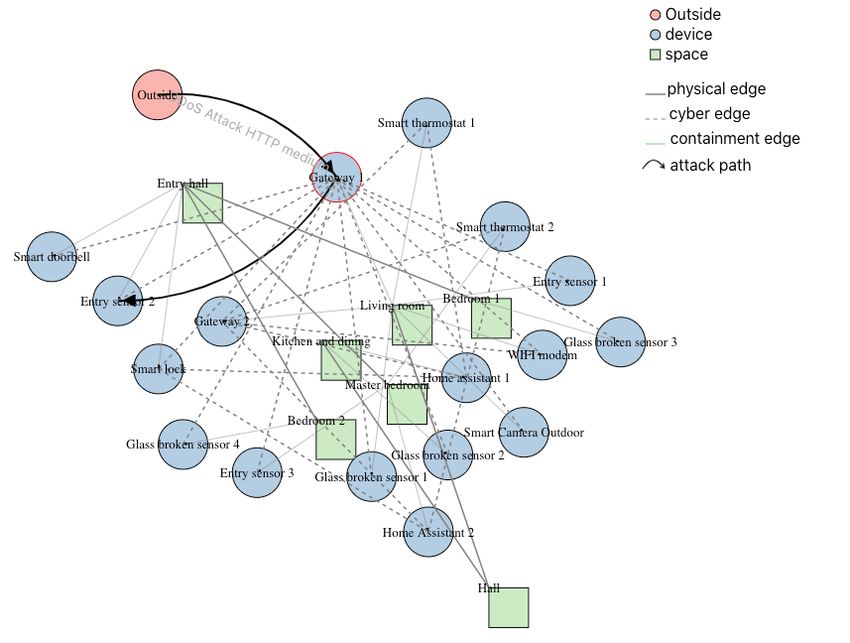
Acknowledgments

First and foremost, I would like to thank almighty God for the blessings and for keeping me
healthy while I was busy with the research work.

I am thankful to Virginia Tech for providing me with opportunities and a haven in this
foreign land. Research is challenging and requires a lot of patience to get the results. I
remember my first research idea, for which I spent a semester, didn’t work out. But, thanks
to my advisor Professor Na Meng for believing in me with another project. Prof. Na Meng
has been a great mentor and constant support on this journey. I am indebted to Professor
Xinghua Gao for providing me with the domain knowledge and support throughout this
thesis. I would also like to thank Professor Edward Fox and Professor Anuj Karpatne for
serving on my committee. I am thankful to Yuqing Liu for kickstarting the project and
providing all the resources and knowledge to take it forward.

Finally, I am immensely grateful to my mother for her love, prayers, and sacrifices for
educating me and preparing me for the future.

                                             v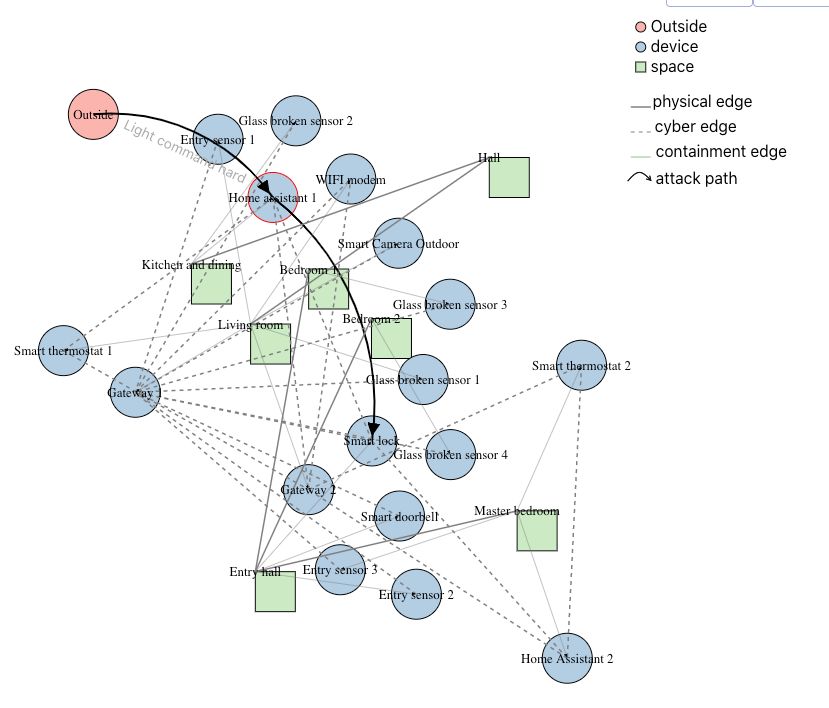
Contents

List of Figures                                                                                  viii

List of Tables                                                                                    ix

1 Introduction                                                                                     1

2 Literature Review                                                                                5

   2.1   Cyber Attacks on Smart-home Ecosystem . . . . . . . . . . . . . . . . . . .               5

   2.2   Physical Attack Simulation on Smart-home/Smart buildings . . . . . . . . .                6

   2.3   Smart-home System Design . . . . . . . . . . . . . . . . . . . . . . . . . . .            7

3 Methodology                                                                                      9

   3.1   User Input . . . . . . . . . . . . . . . . . . . . . . . . . . . . . . . . . . . . .     10

   3.2   Graph Generation      . . . . . . . . . . . . . . . . . . . . . . . . . . . . . . . .    12

   3.3   Path Enumeration . . . . . . . . . . . . . . . . . . . . . . . . . . . . . . . .         14

   3.4   Vulnerability Detection . . . . . . . . . . . . . . . . . . . . . . . . . . . . . .      15

   3.5   Detected Attacks Visualization . . . . . . . . . . . . . . . . . . . . . . . . .         17

4 Results                                                                                         19

   4.1   Smart home layout 1 . . . . . . . . . . . . . . . . . . . . . . . . . . . . . . .        19

                                                vi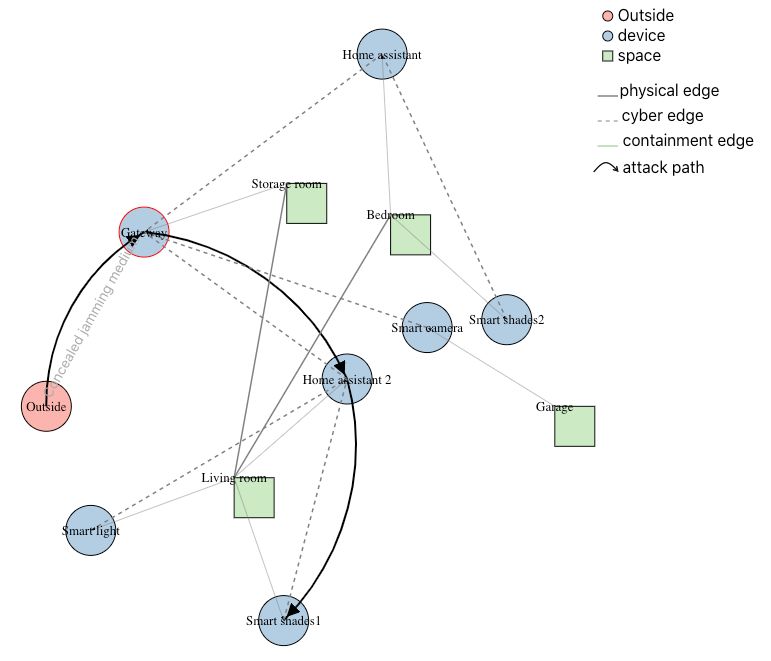
4.1.1   Experiment 1a: Space monitored vs not monitored . . . . . . . . . .              19

        4.1.2   Experiment 1b: Smart Speaker visibility . . . . . . . . . . . . . . . .          21

  4.2   Smart home layout 2 . . . . . . . . . . . . . . . . . . . . . . . . . . . . . . .        21

        4.2.1   Experiment 2: All spaces monitored . . . . . . . . . . . . . . . . . .           23

  4.3   Smart home layout 3 . . . . . . . . . . . . . . . . . . . . . . . . . . . . . . .        25

        4.3.1   Experiment 3: No occupants         . . . . . . . . . . . . . . . . . . . . . .   27

5 Discussion                                                                                     30

6 Conclusions                                                                                    32

Bibliography                                                                                     33

                                             vii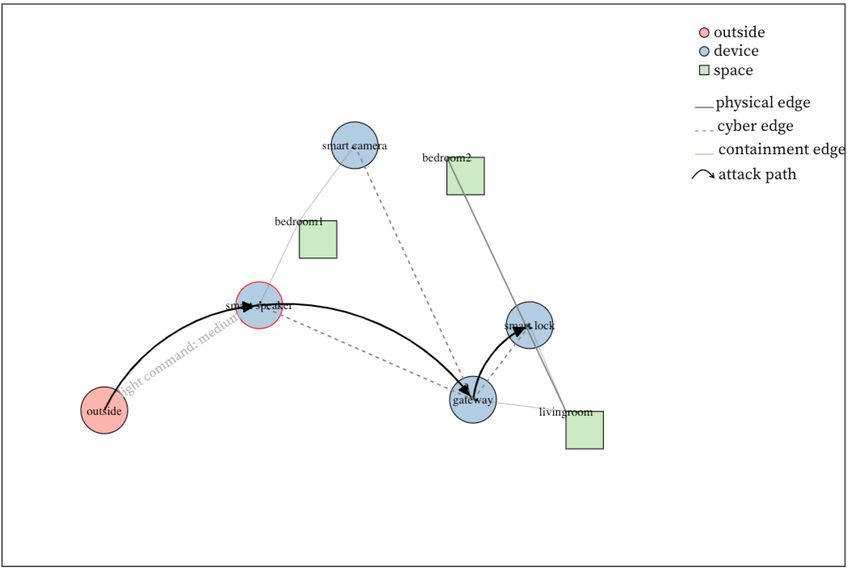
List of Figures

 3.1   Architecture of SHSIM . . . . . . . . . . . . . . . . . . . . . . . . . . . . . .       9

 3.2   SHSIM interface to provide information about the smart home layout . . . .              11

 3.3   An example input graph of a smart home system . . . . . . . . . . . . . . .             13

 3.4   Light command attack on Smart home layout 1 . . . . . . . . . . . . . . . .             18

 4.1   Smart home layout 1 . . . . . . . . . . . . . . . . . . . . . . . . . . . . . . .       20

 4.2   Floor plan of Smart home layout 2 [1]       . . . . . . . . . . . . . . . . . . . . .   22

 4.3   Internet setting in Smart home layout 2 . . . . . . . . . . . . . . . . . . . .         23

 4.4   Security system setting of Smart home layout 2 . . . . . . . . . . . . . . . .          24

 4.5   Automation system setting of Smart home layout 2 . . . . . . . . . . . . . .            24

 4.6   An example DDoS attack on smart security system of Smart home layout 2 .                25

 4.7   Light command attack on Smart home layout 2 . . . . . . . . . . . . . . . .             26

 4.8   Smart home layout 3 . . . . . . . . . . . . . . . . . . . . . . . . . . . . . . .       27

 4.9   Concealed jamming attack on Smart home layout 3 . . . . . . . . . . . . . .             29

                                            viii
List of Tables
3.1 All attacks modeled in SHSIM . . . . . . . . . . . . . . . . . . . . . . . . . . 17
ixChapter 1
Introduction
Smart home automation is gaining popularity due to the convenience and facilities it provides
to homeowners. For instance, owners can control and monitor indoor environments using
their smartphones. Smart home devices (e.g, voice-controlled home assistants, smart light
bulbs, smart switches, smart thermostats, smart door locks, etc.) connect into a common
network that can be independently and remotely monitored. Owners of the devices enjoy
the convenience of access to information through voice commands, remote controls, and
enhanced home security by the power of monitoring cameras and sensors. To provide such
convenience, the devices store or transmit sensitive information, such as account information
and live footage, which makes them cyber targets for attackers. On the other hand, smart
home devices interact with the physical space as they can alter the lighting, configure AC
settings, monitor the space, unlock doors, etc. Breaching of physical space can lead to
physical access to the devices, and breaching of some devices that can render the physical
space insecure.
Today, many smart home systems are powered by state-of-the-art technology and provide
great compatibility with third-party devices. For instance, Google’s Home Assistant or
Amazon’s Echo can be used both as smart speakers as well as to connect with other smart
home devices such as Nest Smart Lock or Philips smart lighting. The integration provides
a much smoother smart home experience to the users as they can choose from numerous
product configurations from different providers. However, studies show that certain product
12 CHAPTER 1. INTRODUCTION configurations are not always secure. For instance, Huraj et al. [12], in their research on Denial of Service (DDoS) attack, found out that when Fibaro Home Center 3 is being flooded with HTTP GET requests, the connection between Amazon Alexa mobile app and the wall plug sensor gets disrupted. This shows that there exist security loopholes when trying to integrate smart home devices from different vendors. In recent years, smart home manufacturers are investing extensively in cybersecurity. How- ever, newer and more complex cyberattacks such as Light command attack [26] keep getting developed, and can breach current smart home systems. On the other hand, physical secu- rity is relatively well-studied. However, physical security cannot offer sufficient protection for the average homeowner. To better study the security in the smart home devices and the space they reside, we must consider the two securities and their interactions, known as cyber-physical security. Unlike most cybersecurity threats, cyber-physical threats are of increasing concern. In 2019, Gartner predicted that the financial impact of Cyber-Physical Systems (CPS) attacks re- sulting in fatal casualties will reach over $50 billion by 2023. According to the article [29], CPS “attacks can also entail a loss of customers, intellectual property theft, operational shutdowns or degraded equipment performance”. Currently, there is no systematic approach to measure such attacks. To tackle this problem, we believe that the simulation of the entire system is desirable. Also, there isn’t a tool which can estimate the cyber-physical security of a smart home environment. Thus, in this thesis we present a simulation framework to investigate the security of a smart home environment and provide some recommendations on which smart home solution is more secure. With our tool, SHSIM, researchers and customers can compare security levels of different smart home solutions. By analyzing the robustness of a given smart home solution, customers can make better decisions regarding which prod- uct they should purchase. Lastly, our study can help and motivate smart-home vendors to
3

design a more secure suite of products.

SHSIM includes a web interface to take user input of their smart home layout, a simulation
engine that generates all possible attack paths, and a graph-based visualization of different
attack models. In our solution, we first map the smart home layout to an integrated graph
(consisting of nodes and edges). Then, we traverse the graph with different starting points
to generate all possible paths. We check the generated paths against various attack models
and output all successful attack paths. In our experiments, we tested the vulnerability of
two smart home ecosystems along with different configurations to check the robustness of
the simulation engine. We found out that various cyber-physical attacks can be employed to
breach the smart home ecosystem. The simulation engine exploits the vulnerability of pop-
ular communication protocols to generate all possible attack paths using which an attacker
can gain access to critical smart home devices. To allow other researchers to use our tool,
we have made SHSIM publicly available at https://github.com/rahulaVT/SIM_app.

Here we define some of terminologies being used throughout the thesis:

  1. Smart home system is a suite of smart home devices used for home automation or
     home security purpose. Some of the popular smart home automation systems include
     Google Nest and Amazon Alexa. ADT and Simplysafe are popular choices for smart
     home security systems.

  2. Cyber attack is a network-based attack launched by cybercriminals/hackers to ma-
     liciously gain network access, steal user data, or breach access points.

  3. Physical attack means breaking into a home by damaging physical infrastructure
     (doors, windows, etc.) to gain physical access to space or devices.

  4. Cyber-Physical attack is a security breach in cyberspace, which adversely affects
     physical space.
4 CHAPTER 1. INTRODUCTION
5. Simulation engine is a program that allows the user to observe an operation through
simulation without actually performing that operation.
The rest of the thesis is organized as follows. In Chapter 2 we shed light on some previous
work that has been done in this domain. In Chapter 3 we comprehensively describe our
research methodology. The results and analysis are explained in Chapter 4, and in Chapter
5 we have included a discussion on the threats to validity and possible solutions. Finally, in
Chapter 6 we present our conclusion.Chapter 2
Literature Review
While performing this study, the author primarily researched about three research areas for
our literature review: (1) cyber attacks on smart-home ecosystem (Section 2.1), (2) physical
attack simulation on smart-home/smart buildings (Section 2.2), and (3) smart-home system
design (Section 2.3).
2.1 Cyber Attacks on Smart-home Ecosystem
The cybersecurity of smart home devices is being studied extensively as new cyberattacks
keep getting implemented. In order to simulate different attack models, we did a compre-
hensive literature review of cyber and physical attacks on IoT devices. Distributed Denial
of Service (DDoS) [36] is one of the most common attacks on IoT networks. It is an at-
tempt to flood the server with internet traffic to shut down the service either completely
or partially. The experiments conducted by Huraj et al. [12] show how an attacker from
outside can disturb the normal operation of smart home devices when they become victim
of a DDoS attack. Gómez et al. [7] in their research work expose the vulnerability of ZigBee
devices for wormhole attacks and packet injection. According to Gómez et al., a successful
wormhole attack can “impact the confidentiality, availability, and integrity of the data in
the Wireless Sensor Network (WSN), which could affect part or all of the network”. A Jam-
ming attack is another popular cyberattack where an adversary pretends to be a legitimate
56 CHAPTER 2. LITERATURE REVIEW
WIFI device that prevents/delays the sensor’s communication to the gateway. Chi et al.
[3] present a variant of jamming attack called concealed jamming attack that targets Zigbee
devices, preventing them from receiving Zigbee packets that may contain important infor-
mation. Researchers have found many other cyber attacks which target the vulnerability in
communication protocols to leak sensitive information from devices [6, 28].
2.2 Physical Attack Simulation on Smart-home/Smart
buildings
Ciholas et al. [4] performed a systematic literature review of the security of Smart Buildings
(SBs) wherein they investigated 90 relevant research papers. Ciholas et al. found out
that “very few papers consider the issue about physical attacks on sensors, actuators, and
controllers in SB”. In [9], the authors identified potential physical attacks such as vandalism,
burglary, and theft of SB devices. In [18], the researchers exposed the vulnerability of KNX-
based devices present at the field layer. The researchers could connect to the KNX network
from a simple connected light switch and gain full control of the building. Heartfield et al.
[10] devised a novel taxonomy of 25 different smart home attacks, classifying attack vectors
and their impact on physical, domestic, and emotional well-being. Building Information
Model (BIM) can be used to generate graphs, reflecting spatial relations between spaces
within a building [20, 25]. Porter et al. [20] proposed a way to use the generated graph to
simulate a physical attack on the building to see which rooms and obstacles (windows, doors,
walls) are the most vulnerable. Skandhakumar et al. [25] utilized the graph representation
of BIM for indoor navigation applications. Regardless of the novelty of this approach, it does
not take into account the concept of smart devices that can be affected by people with access
to the building spaces. Our research work takes inspiration from the work done by Porter2.3. SMART-HOME SYSTEM DESIGN 7 et al. and Skandhakumar et al. to model smart home systems using graphs. However, we simulate both cyber and physical attacks on the smart home system to identify potential attack paths. 2.3 Smart-home System Design Designing a Smart Home requires planning. There are a variety of customization options available to create a smart home: audio, lighting, HVAC, and security solutions. The home- owner needs to consider how the house will function as a whole [15], the level of automation required, strategic placement of devices, and cost to build the system. Robles et al. [23] reviewed a few smart home system designs and provide ten guidelines to help people design their own smart homes. Designing a sophisticated smart home may require professional as- sistance that can be costly. Hu et al. [11] assess the usability of self-installation kits intended for the senior population. Their study indicated that the installation of a few devices from a Smart Home in a Box (SHiB) system has a high success rate even for individuals with no engineering background. Yamazaki et al. [35] introduced the concept of “The Ubiquitous Home” which consists of several context-aware services and a robot acting as an interface for the residents. Smart home technology promises tremendous benefits for the elderly and people with dis- abilities. We found a few research studies related to the smart home design catering to elderly people [5, 14, 21]. Majumder et al. [16] presented a comprehensive review on the state-of-the-art research and development in smart home based remote healthcare technolo- gies. According to them, “Smart homes can enable continuous and remote monitoring of elderly health and well-being at a low cost”. Prior research work on smart home system design is geared towards specific automation
8                                                          CHAPTER 2. LITERATURE REVIEW

applications. However, in our research work, we focus on the security aspect of smart home
systems. Although physical and cybersecurity of smart home environments have been stud-
ied independently, there is no tool that can simulate cyber-physical attack together. This
research presents a graph-based simulation technique to model both physical and cyberat-
tacks of a smart home environment.
Chapter 3

Methodology

Figure 3.1 presents the system architecture of SHSIM. Our approach primarily consists of
five steps. In Step 1 we expect the user to provide the information about their smart-home
architecture using the web interface (Section 3.1). In Steps 2-4 we use automated scripts
written in Python 3 to identify vulnerable cyber-physical attacks (Section 3.2 - Section 3.4).
Finally, in Step 5 we use D3.js [2] to provide interactive graphical visualization of detected
vulnerable attacks (Section 3.5).

                             Figure 3.1: Architecture of SHSIM

                                              9
10 CHAPTER 3. METHODOLOGY
3.1 User Input
We have used Node.Js [19] & ReactJS [22] for front-end and Python & Flask [8] for run-
ning the back-end of our web application. Node.js is an open-source, cross-platform runtime
environment used for developing fast, scalable server-side and network applications. Devel-
opers prefer to use ReactJS in combination with Node.js to build reusable user interface (UI)
components because React uses a JavaScript virtual DOM, which is faster than an ordinary
DOM [13].
The first step to running the simulation is to provide the smart-home configuration which
includes details about the floor plan and the placement of smart home devices within the
home. Figure 3.2 describes the user interface of SHSIM that includes four paper components
[17] to take user input.
1. Add Spaces component consists of textfields and checkboxes to define space config-
uration.
2. Add Devices component consists of a textfield and drop-down selections to create
and place devices within the smart home.
3. Create Physical Connection component consists of drop-down selections and a
checkbox to define connections between spaces.
4. Create Cyber Connection component consists of drop-down selections and a check-
box to define connections between devices.
The components also contain a list-view of items being added with the option to edit or
delete items as required. The provided information gets saved as a JSON file by clicking the
submit button. We have given the flexibility to load an existing JSON file, make changes,
and then run the simulation.3.1. USER INPUT 11
Figure 3.2: SHSIM interface to provide information about the smart home layout12 CHAPTER 3. METHODOLOGY 3.2 Graph Generation Graphs have been widely used in building network topology, social networks, biological networks, operational research, etc. [30]. A graph consists of vertices that are connected by edges. A graph may be undirected, meaning that there is no distinction between the two vertices associated with each edge, or its edges may be directed from one vertex to another. We have used graphs to model various smart home configurations, combining with agent-based simulation to analyze the cyber-physical security of smart homes. In order to model the smart-home system, we must define nodes and edges. We created SpaceNode to define the physical spaces such as hallway, kitchen, bedrooms, etc., and Devi- ceNode to define the smart home devices. Each SpaceNode holds a set of attributes such as area, floor level, window present (True/False), and occupied (True/False). DeviceNode has attributes such as type, placement, network, visibility, monitoring, etc. The edges connect- ing the nodes are of three types: physical connection, cyber connection, and containment connection. The physical connection is represented as a solid black line with a stroke-width of 1.5 as shown in Figure 3.3. If there is a physical edge connecting two spaces, it means that the attacker can access and move between the spaces. However, if space is occupied, there wouldn’t be a physical edge connecting that space, and thus, the attacker is prohibited from entering the occupied space. Similarly, if space is being monitored by a smart device such as a smart camera or a glass break sensor, the attacker would not try to physically enter that monitored space. The cyber connection shows connectivity between smart home devices. It has been repre- sented as dotted lines in Figure 3.3. For our study, we have focused on devices with wireless communication since most smart home devices are designed to be wireless. Generally, the smart home environment consists of two kinds of devices: low-powered IoT devices/sensors
3.2. GRAPH GENERATION                                                                     13

(e.g., smart thermostat, smart lock, etc.) which run on a lithium-ion battery and have a
shorter range of communication; and high-powered IoT devices (e.g., smart home assistants,
smart light, smart camera, etc.) which need an external power supply and can transmit
over a longer range. The low-powered sensors are paired with a gateway and they follow a
certain communication protocol (e.g., Zigbee [24], Z-Wave [32], WIFI, Bluetooth, etc.) to
talk to each other. These communication protocols are designed to ensure reliable and secure
transmission of IoT sensor data at the edge.

               Figure 3.3: An example input graph of a smart home system

The placement of devices within spaces is defined by a containment edge which is represented
as a green solid line. There can be zero or more devices present in a given space. The
containment edge is useful in scenarios where we want to model a cyber-physical attack. For
instance, an attacker can break into space (if it’s not being monitored or occupied) and gain
14 CHAPTER 3. METHODOLOGY
physical access to all the devices present in that space. Also, certain attacks require direct
visibility of devices which may be possible by breaking into a space and accessing vulnerable
devices to perform a cyber attack. Laser-based voice command injection [26] works when
the attacker has direct visibility of voice assistant-based smart devices.
3.3 Path Enumeration
Once the graph is generated, different simulations can be performed on it, either locally
or remotely in the cloud of the service provider. The graph-based modeling of the system
reflects what the attacker can observe. The simulation follows the same logic. Our simulation
engine works by taking into account certain assumptions about the attacker’s capabilities.
• The attacker must have a start position. For smart home simulation, a simple example
can be that the attacker is located outside (represented as a orange circle in Figure
3.3) with access to the internet.
• The attacker must also have access to some nodes to initiate attacks.
• In order to initiate a cyber attack, we assume that the attacker can detect some wireless
signals.
• To simulate the attack method mentioned in [26], the visibility of the microphone must
be modeled so the attacker can “see” the device and establish such an attack.
• In order to initiate a physical attack, we assume that the attacker has tools to detect
whether space is being monitored or not.
We have used the Depth First Search (DFS) algorithm to traverse the generated graph and
enumerate all possible paths between any two given nodes in the smart home system. We3.4. VULNERABILITY DETECTION 15 built a function called “generatePaths” which takes the start and end node as input parame- ters and returns all paths between the two nodes. The function “generatePaths” yields valid paths based on the integrated graph which encapsulates the access control information. For instance, in Figure 3.3, there won’t be a path between bedroom1 and bedroom2 since there isn’t a physical connection between them. Also, since the containment edges are directed from space to device, we can’t have a path connecting the two spaces via a device. However, devices in bedroom1 can still be reached from bedroom2 as there exists a path (such as bedroom2 -> livingroom -> gateway -> smart speaker). The enumerated paths can be con- sidered as candidate attack paths which will be used to find vulnerable attack paths. Since we have used an adjacency list to represent the graph, the time complexity of DFS traversal is O(V+E) where V is the number of nodes and E is the number of edges in the graph. Thus, the time complexity to enumerate all the paths is O(V 2 )*O(V+E). The cubic time complexity of the algorithm can lead to a longer execution time for a more complex smart building layout with nodes and edges in the order of 100s. Thus, we might need to come up with some optimization strategies to reduce the number of calls to the DFS algorithm. 3.4 Vulnerability Detection We identified several attack vectors to model the cyber-physical security of the smart home system. Currently, we have modeled four different cyberattacks (as presented in Table 3.1) which can be combined with a physical attack (if required). These attacks can target different layers of the Open Systems Interconnection (OSI) protocol stack. The OSI model is an ISO-standard abstract model structured into seven conceptual layers [33]. The layers form a hierarchy of functionality to receive, process, and pass information from bottom to top layer. The modeled attacks are described as follows:
16                                                                 CHAPTER 3. METHODOLOGY

     1. Light Command: For this attack, the attacker targets the MEMS (microelectrome-
       chanical systems) microphone installed in smart devices (such as Home Assistant,
       smart speaker, etc.) to inject inaudible and invisible laser encoded commands. This
       enables the attacker to inject various commands such as “set volume to 0”, “change
       temperature to 70F”, “open garage door”, etc.

     2. DDoS HTTP attack: HTTP Get Flood attack is one of the most common types of
       DDoS attacks of an application layer. During this attack, the attacker uses legitimate
       IP addresses which appear to be authentic, to overwhelm the webserver with multiple
       requests. Thus, new HTTP Get requests cannot be processed.

     3. Wormhole attack: This attack involves the introduction of a malicious node to form
       a tunnel between a source and a destination node to misguide network traffic or modify
       data packets. This attack typically occurs when the two nodes are far apart and there
       is a need to relay the information through interim nodes.

     4. Reactive jamming attack: In this attack, the attacker pretends to be a legitimate
       WIFI device to prevent or delay the Zigbee device’s communication to the gateway. It
       is an optimal jamming technique since it aims at destroying only selected data packets
       (which are in the air) by using a short jamming signal, thus minimizing its risk of
       being detected.

     5. Window break-in: In this attack, the attacker can break into space that is not being
       monitored. Thus, the attacker can gain access to space as well as the devices in that
       space. This is the only physical attack that we have modeled to explore the synergy
       between cyber and physical attacks.

We consider an attack to be successful (or a candidate path to be vulnerable) if using one
or more attack vectors, the attacker can enter the house. A resultant attack path can be as
3.5. DETECTED ATTACKS VISUALIZATION 17
Table 3.1: All attacks modeled in SHSIM
Attack vector Communication Constraint Attacked Testing Difficulty
protocol device device
Light command Z- Wave,Zigbee visibility Smart Smart high
[26] speaker Lock
DDoS Attack Z-Wave none Gateway any Z- medium
HTTP [12] Wave
sensor
Wormhole Zigbee none Gateway any zigbee medium
attack [7] smart de-
vice
Reactive jam- Zigbee none Gateway any zigbee medium
ming [34] smart de-
vice
Window break- N/A not moni- NA NA easy
in tored
simple as having a single node (e.g., break-in through the window) or a much more complex
attack that involves multiple nodes (e.g., performing laser-based voice command injection
to unlock the door). For each resultant attack path, we estimate how difficult (low/medi-
um/high) it is for the attacker to breach the smart home system. The implementation of
this simulation is extendable to allow the addition of new attack vectors.
3.5 Detected Attacks Visualization
D3 is one of the most powerful tools to create data visualizations because of its flexibility
and its ability to run on a web browser. It works seamlessly with existing web technologies
(HTML, CSS, SVG), and can manipulate any part of the document object model [31]. We
have used D3’s force-directed graph to create interactive graphical visualizations of detected
attacks on a smart-home environment. It uses a physics-based simulator for positioning visual18 CHAPTER 3. METHODOLOGY
elements. In our case, nodes are our visual elements which we position programmatically
with Scalable Vector Graphics (SVG). Using forceLink(),we provide an attraction force
between connected nodes such that our graph arranges itself according to our edges. Finally,
we apply two more forces – “collide” and “center” – to the system. The first of these makes the
elements repel each other while the second attracts the elements towards a center point. In
Figure 3.4 we can see an example of the output visualization. The attack path is highlighted
using a curved black line wherein the attacker targets the smart speaker (highlighted with
red outline) to unlock the smart lock. We can also see the type of attack used along with the
attack difficulty level. We provide a list of all resultant attack paths for the user to select to
get the corresponding visualization.
Figure 3.4: Light command attack on Smart home layout 1Chapter 4
Results
We performed a few experiments on three different smart home designs to cover divergent
scenarios and test the validity of our simulation engine.
4.1 Smart home layout 1
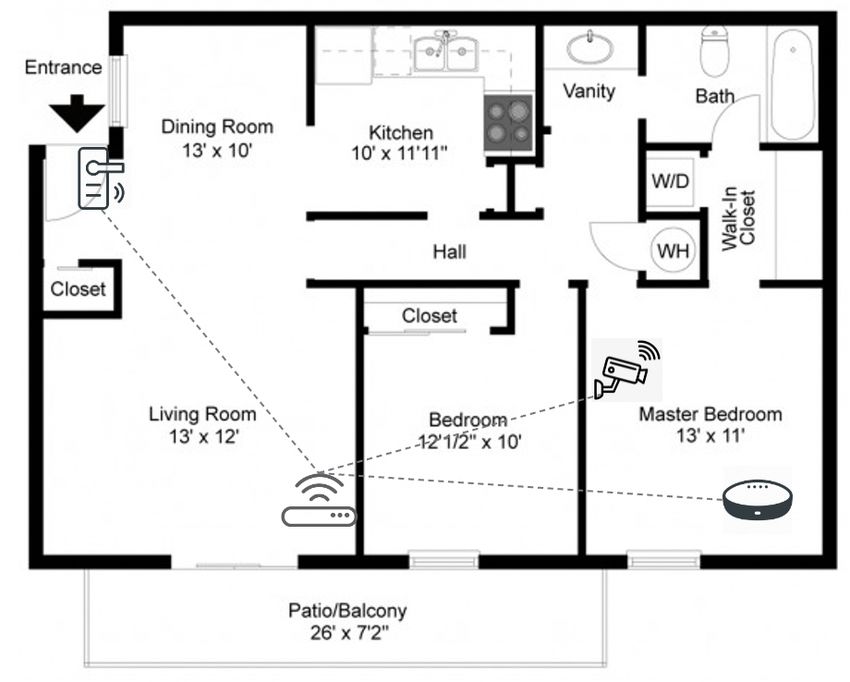
As shown in Figure 4.1, we defined a smart home layout with 3 spaces (bedroom1, bedroom2,
and livingroom) and 4 smart home devices. Bedroom1 (or the Master bedroom) contains a
smart speaker which can also act as a voice-enabled assistant (e.g., Google home or Echo
dot) and a smart camera that monitors the space. Bedroom2 doesn’t contain any smart
device. The living room has a gateway that connects to other smart home devices and relays
data packets. The living room also has a smart lock installed at the main door. In Figure
3.3 we can see the graph generated for the smart home layout. On running the simulation,
we get a list of attack paths with relevant information such as attack difficulty level, attack
type, targeted node, etc.
4.1.1 Experiment 1a: Space monitored vs not monitored
For the given smart home layout, we experimented by first adding the smart camera to
monitor bedroom1 and then removing it to observe the differences in output. We identified
1920 CHAPTER 4. RESULTS
Figure 4.1: Smart home layout 1
9 attack paths when the space was being monitored and 12 attack paths when it was not
being monitored. The difference lies in the fact that when space is not being monitored, the
attacker can perform a physical attack on bedroom1 window and enter the space. In Figure
3.4, we can see one of the resultant paths wherein the attacker uses the Light command [26]
attack to target the smart speaker and unlocks the smart lock. The engine estimates that
this attack has a “medium” difficulty level based on the attack model. Also, we eliminate
some of the unknown parameters such as time taken to hack the passcode of the smart lock
since it depends entirely on the kind of smart lock installed. We found that certain smart
locks such as Nest X Yale locks are much more secure than August smart locks. Other
possible attacks include a DDoS HTTP [12] attack on the gateway which blocks its internet
connectivity, thus restricting the homeowner from using commands which involve an internet
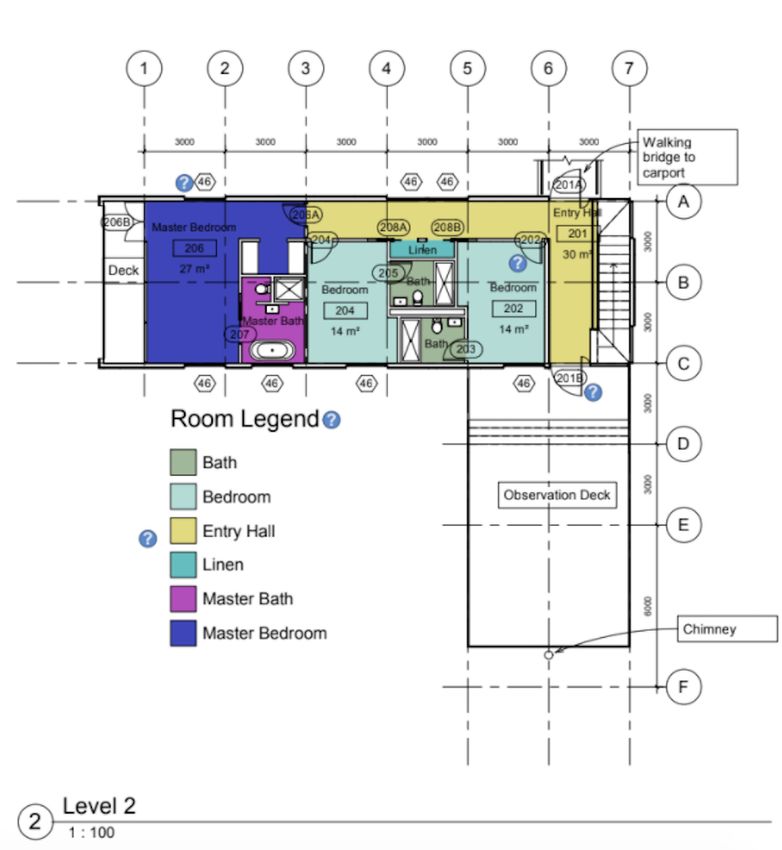
connection.4.2. SMART HOME LAYOUT 2 21 4.1.2 Experiment 1b: Smart Speaker visibility For the second part of our experiment, we removed the visibility of the smart speaker from the outside and ran the simulation again. We found out that the attacker was no longer able to target the smart speaker from outside since it was not in the line of sight. However, since bedroom1 was not being monitored, the attacker was able to physically enter and then perform the Light command attack, as now the smart speaker was in the line of sight. 4.2 Smart home layout 2 The second smart home layout is much more complex. We took the floor plan of a real-life duplex house with smart-home security and an automation system. In Figure 4.2, we can see the floor plan of the smart home which consists of a living room, kitchen & dining, hall, and 3 bedrooms. Figure 4.3 describes the internet connectivity setting wherein we have a WIFI modem placed in the living room providing connectivity to the smart-home security system, the smart-home automation system, and other devices. In Figure 4.4, we can see the placement of smart-security-related devices such as smart cameras, smart doorbells, motion sensors, etc. The first base station placed in the living room connects to the WIFI and communicates to all of the smart-security devices on a common network (i.e., Z-Wave). Similarly, in Figure 4.5 we can see the placements of smart-automation devices such as home assistants, smart thermostats, etc. The second base station connects to the internet and communicates with all smart home devices over the Zigbee network.
22                                                       CHAPTER 4. RESULTS

     Figure 4.2: Floor plan of Smart home layout 2 [1]
4.2. SMART HOME LAYOUT 2 23
Figure 4.3: Internet setting in Smart home layout 2
4.2.1 Experiment 2: All spaces monitored
For this experiment we observed 21 different attack paths on running the simulation. Since
all of the spaces were monitored, the attacker couldn’t perform any physical attack. We can
divide 21 different attack paths into 3 cyber-physical attacks:
1. DDoS HTTP attack: Since Z-Wave devices are vulnerable to DDoS attacks, Gateway
1 has been targeted to block its communication with other smart-security devices such
as entry sensors, smart cameras, etc. In Figure 4.6, we can see one such attack path
which blocks the data transmission between the Gateway 1 and Entry sensor 2.
2. Wormhole attack: Since Zigbee devices are vulnerable to Wormhole attack [7], Gateway
2 has been targeted to misguide the network traffic between the gateway and other
Zigbee devices such as home assistants, smart thermostats, etc.24 CHAPTER 4. RESULTS
Figure 4.4: Security system setting of Smart home layout 2
Figure 4.5: Automation system setting of Smart home layout 24.3. SMART HOME LAYOUT 3 25
Figure 4.6: An example DDoS attack on smart security system of Smart home layout 2
3. Light command attack: In Figure 4.7, we can see the attacker targets the home as-
sistant devices which are visible from outside to unlock the smart lock. The attacker
exploits the vulnerability of MEMS microphones to remotely inject inaudible and in-
visible commands into voice assistants.
4.3 Smart home layout 3
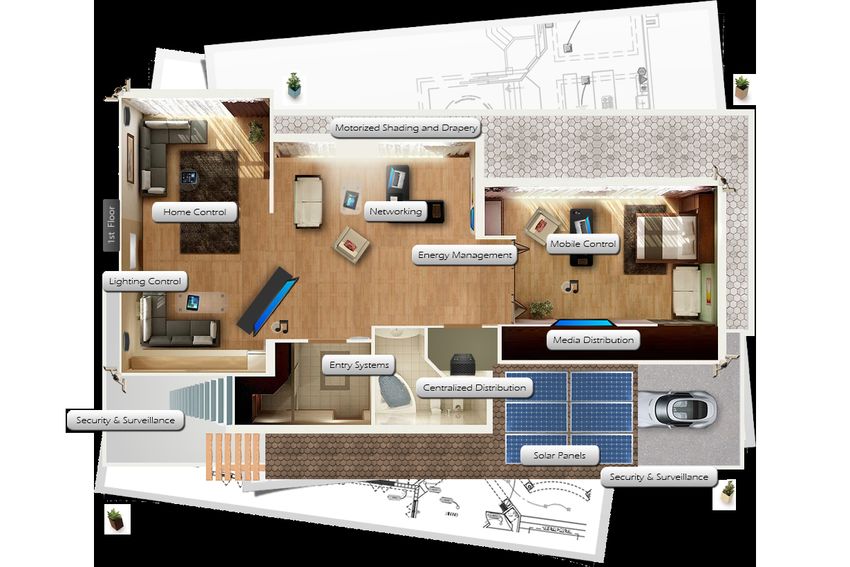
We took the design inspiration of the third smart home layout from Surreal System’s website
[27]. On their homepage, they provide the floor plan (as shown in Figure 4.8) of a smart26 CHAPTER 4. RESULTS
Figure 4.7: Light command attack on Smart home layout 2
home which consists of a living room, bedroom, storage room, and a garage. The living
room has a voice-enabled assistant and a smart lighting system. The bedroom and living
room windows have motorized smart shades. The storage room contains the gateway and
the garage is being monitored via a smart camera. The devices communicate with others
over the Zigbee network and can be controlled via a switch, mobile app, or home assistant.4.3. SMART HOME LAYOUT 3 27
Figure 4.8: Smart home layout 3
4.3.1 Experiment 3: No occupants
For this experiment, we configured the spaces with no occupants while running the simula-
tion. We found the smart home design being quite vulnerable as the simulation provided us
31 different attack paths. The attacker was able to exploit the vulnerability of the Zigbee
network and perform three different kinds of cyber-physical attacks:
1. Wormhole attack: The attacker inserts a malicious node to form a tunnel between the
Home assistant and other smart devices such as smart light, smart shades, etc. By
doing this, the attacker can misguide network traffic and even modify data packets.
The attacker has the option of doing the entire process from outside the home (if
he/she can receive a signal) or by entering the house (since most of the spaces are not28 CHAPTER 4. RESULTS
being monitored or occupied.)
2. Concealed jamming attack [3]: In this attack method, the attacker targets the gateway
to jam or delay the data transmission between gateway and other smart devices such
as Home assistant, smart lights, smart shades, smart camera, etc. In Figure 4.9, we
can see one such attack where the attacker jams the network between smart shades
and the gateway. Thus, if the resident wants to operate the smart shades using the
Home assistant, they would fail. However, they can still operate it via a switch or
mobile app.
3. Light command attack: The attacker targets the Home assistant device present in the
bedroom to inject laser commands. Thus, the attacker can gain control over other
controllable devices such as smart shades and smart lights.
4. Physical attack: The attacker has the option to break into the house through the living
room and bedroom windows as the spaces are not being monitored or occupied. The
attacker cannot enter through the garage as it is being monitored by a camera.
From this experiment, it’s evident that not having a smart home security system can make
it easy for the attacker to perform cyber-physical attacks when no one is at home.
The experiments conducted illustrate that the current generation of smart home systems
are not always sufficiently secure. The attacker, by sensing weak entry points, can launch
cyber-physical attacks to either enter the house or gain access to the network. We found
that the Base stations or the gateways are the prime targets to various cyber attacks. Spaces
which are not monitored or occupied can lead to physical attacks. The attacker on entering
the house can sense neighbouring spaces and plan his next attack accordingly.4.3. SMART HOME LAYOUT 3 29
Figure 4.9: Concealed jamming attack on Smart home layout 3Chapter 5
Discussion
SHSIM can be used by researchers and customers to analyze the security of their smart
home systems. Using the simulation engine, device manufacturers can find loopholes and
try to fix them. Typically, a smart homeowner installs devices that are compatible with
one common smart home solution (e.g., Google, Amazon, etc.) to avoid having multiple
different gateways. However, our simulation engine can handle multiple smart home solution
ecosystems.
Even though we conducted several experiments to test the simulation engine and explore
different attack paths, more study is needed to further improve the proposed system.
1. More experiments using a real-life smart home setting can bring out interesting insights
as well as test the robustness of the simulation engine to handle different circumstances.
2. Currently, our attack models are based on the vulnerability of Z-Wave and Zigbee
communication protocols. However, there exist many more communication protocols
such as Insteon, Thread, KNX, BACnet, etc. for building a smart-home network which
need to be investigated.
3. We made certain assumptions for successfully running the simulation engine which can
be taken as parameters in a future version of SHSIM. For instance, we assume that
the attacker from outside gets the network signal to access a few smart home devices.
However, we do not consider signal information in our modeling. Thus, for future
3031 development, we can build a large database of smart home devices with their profile and provide a user the option to select a device from the list. 4. In our attack model, we assume that all of the smart devices that work on a vulnerable communication protocol are vulnerable devices. However, it might not always be the case. Smart home vendors can push firmware updates on top of communication protocols to fix certain vulnerabilities. Thus, in future iterations, one can focus on device-level vulnerability rather than network-level vulnerability. 5. Currently we take user input about building layout and device placements through HTML form elements. However existing work shows that the corresponding graph for spatial breach analysis can be built using the building’s BIM information [20]. Thus, in a future version of SHSIM, we can use a similar methodology to extract smart building information from BIM. Also, current smart home services already collect some spatial location data of the devices to provide better service, so one can explore the idea of extracting such location data for device placement.
Chapter 6

Conclusions

Cyber-physical security for smart-building is a relatively new topic and requires a scientific
tool to help study potential cyber-physical attacks and impacts. This research has proposed
a system that can simulate cyber-physical systems using graphs, and offered a prototype
that is expandable and capable of analyzing the threat to the smart-home environment. We
conducted several experiments to analyze the vulnerability of different smart home designs.
We found that gateways or hubs are primary targets of cyberattacks. Also, the lack of a
smart security system can provide an opportunity for a physical attack which in turn can
result in cyberattacks on smart devices. Future directions of improvements include more
detailed modeling that better reflects reality, optimized algorithms for simulation, different
algorithms to simulate a different aspect of the system, a standardized attack and impact
library, and standardized modeling of devices and protocols.

                                             32
Bibliography
[1] Autodesk. Sample Revit project, 2021. URL https://www.autodesk.com/products/
revit/overview?term=1-YEAR. [Accessed April 21st, 2021].
[2] Mike Bostock. D3.js - Data-Driven Documents, 2012. URL http://d3js.org/. [Ac-
cessed March 21, 2021].
[3] Zicheng Chi, Yan Li, Xin Liu, Wei Wang, Yao Yao, Ting Zhu, and Yanchao Zhang.
Countering Cross-Technology Jamming Attack. In Proceedings of the 13th ACM Con-
ference on Security and Privacy in Wireless and Mobile Networks, WiSec ’20, page
99–110, New York, NY, USA, 2020. Association for Computing Machinery. ISBN
9781450380065. doi: 10.1145/3395351.3399367. URL https://doi.org/10.1145/
3395351.3399367. Accessed 9-February-2021].
[4] Pierre Ciholas, Aidan Lennie, Parvin Sadigova, and J. Such. The Security of Smart
Buildings: a Systematic Literature Review. ArXiv, abs/1901.05837, 2019.
[5] Michela Cozza, Antonella De Angeli, and Linda Tonolli. Ubiquitous technologies
for older people. Personal and Ubiquitous Computing, 21, 06 2017. doi: 10.1007/
s00779-017-1003-7.
[6] Behrang Fouladi and Sahand Ghanoun. Honey, I’m Home!!, Hacking Z-Wave
Home Automation Systems. In Black Hat, 2013. URL https://cybergibbons.com/
wp-content/uploads/2014/11/honeyimhome-131001042426-phpapp01.pdf. [Ac-
cessed March 17th, 2021].
[7] Julian Ramirez Gómez, Héctor Fernando Vargas Montoya, and Alvaro Leon Henao.
3334 BIBLIOGRAPHY
Implementation of a Wormhole Attack on Wireless Sensor Networks with XBee S2C
Devices. In Jairo E. Serrano C. and Juan Carlos Martínez-Santos, editors, Advances
in Computing, pages 98–112, Cham, 2018. Springer International Publishing. ISBN
978-3-319-98998-3.
[8] Miguel Grinberg. Flask web development: developing web applications with Python.
O’Reilly Media, Inc., 2018.
[9] M. Hager, S. Schellenberg, J. Seitz, S. Mann, and G. Schorcht. Secure and QoS-aware
communications for smart home services. In 2012 35th International Conference on
Telecommunications and Signal Processing (TSP), pages 11–17, 2012. doi: 10.1109/
TSP.2012.6256188.
[10] Ryan Heartfield, George Loukas, Sanja Budimir, Anatolij Bezemskij, Johnny R.J.
Fontaine, Avgoustinos Filippoupolitis, and Etienne Roesch. A taxonomy of cyber-
physical threats and impact in the smart home. Computers Security, 78:398–
428, 2018. ISSN 0167-4048. doi: https://doi.org/10.1016/j.cose.2018.07.011. URL
https://www.sciencedirect.com/science/article/pii/S0167404818304875. [Ac-
cessed 2nd February, 2021].
[11] Y. Hu, Dominique Tilke, Taylor Adams, Aaron S. Crandall, D. Cook, and M. Schmitter-
Edgecombe. Smart home in a box: usability study for a large scale self-installation of
smart home technologies. Journal of Reliable Intelligent Environments, 2:93–106, 2016.
[12] Ladislav Huraj, Marek Šimon, and Tibor Horák. Resistance of IoT Sensors against
DDoS Attack in Smart Home Environment. Sensors, 20(18), 2020. ISSN 1424-8220.
URL https://www.mdpi.com/1424-8220/20/18/5298. [Accessed 2nd February, 2021].
[13] Prem Khatri. Why some developers prefer Node.js React.js for application de-BIBLIOGRAPHY 35
velopment, 2021. URL https://www.chetu.com/blogs/technical-perspectives/
nodejs-and-reactjs-for-app-development.php. [Accessed April 22nd, 2021].
[14] Soo-Cheol Kim, Young-Sik Jeong, and Sang-Oh Park. RFID-Based Indoor Location
Tracking to Ensure the Safety of the Elderly in Smart Home Environments. Personal
Ubiquitous Comput., 17(8):1699–1707, December 2013. ISSN 1617-4909. doi: 10.1007/
s00779-012-0604-4. URL https://doi.org/10.1007/s00779-012-0604-4.
[15] Claire Lloyd. How to Design a Smart Home: An Expert Guide, 2020. URL https:
//www.homebuilding.co.uk/advice/how-to-design-a-smart-home. [Accessed April
19th, 2021].
[16] Sumit Majumder, Emad. Aghayi, Moein Noferesti, Hamidreza Memarzadeh-Tehran,
Tapas Mondal, Zhibo Pang, and M. Jamal Deen. Smart Homes for Elderly Healthcare—
Recent Advances and Research Challenges. Sensors, 17(11), 2017. ISSN 1424-8220. doi:
10.3390/s17112496. URL https://www.mdpi.com/1424-8220/17/11/2496. [Accessed
1st April-2021].
[17] Material-UI. React Paper Component, 2021. URL https://material-ui.com/
components/paper/. [Accessed April 21st, 2021].
[18] T. Mundt and P. Wickboldt. Security in building automation systems - a first analysis.
In 2016 International Conference On Cyber Security And Protection Of Digital Services
(Cyber Security), pages 1–8, 2016. doi: 10.1109/CyberSecPODS.2016.7502336.
[19] Node.js. About Node.js. URL https://nodejs.org/en/about/. [Accessed April 21st,
2021].
[20] Stuart Porter, Terence Tan, Tele Tan, and Geoff West. Breaking into BIM: Performing
static and dynamic security analysis with the aid of BIM. Automation in Construction,36 BIBLIOGRAPHY
40:84–95, 2014. ISSN 0926-5805. doi: https://doi.org/10.1016/j.autcon.2013.12.002.
URL https://www.sciencedirect.com/science/article/pii/S0926580513002148.
[Online; accessed 7-April-2021].
[21] François Portet, Michel Vacher, Caroline Golanski, Camille Roux, and Brigitte Meillon.
Design and evaluation of a smart home voice interface for the elderly � Acceptability
and objection aspects. Personal and Ubiquitous Computing, 17:1–18, 01 2012. doi:
10.1007/s00779-011-0470-5.
[22] React. About React.js, 2021. URL https://reactjs.org/. [Accessed April 20th,
2021].
[23] Rosslin Robles and Tai-hoon Kim. Applications, Systems and Methods in Smart Home
Technology: A Review. 15, 01 2010.
[24] S. Safaric and K. Malaric. Zigbee wireless standard. In Proceedings ELMAR 2006,
pages 259–262, 2006. doi: 10.1109/ELMAR.2006.329562.
[25] Nimalaprakasan Skandhakumar, Farzad Salim, Jason Reid, Robin Drogemuller, and
Ed Dawson. Graph theory based representation of building information models for
access control applications. Automation in Construction, 68:44–51, 08 2016. doi: 10.
1016/j.autcon.2016.04.001.
[26] Takeshi Sugawara, Benjamin Cyr, Sara Rampazzi, Daniel Genkin, and Kevin Fu.
Light Commands: Laser-Based Audio Injection Attacks on Voice-Controllable Sys-
tems. In 29th USENIX Security Symposium (USENIX Security 20), pages 2631–
2648. USENIX Association, August 2020. ISBN 978-1-939133-17-5. URL https:
//www.usenix.org/conference/usenixsecurity20/presentation/sugawara. [Ac-
cessed 17th April, 2021].BIBLIOGRAPHY 37
[27] Surreal System. Smart Home Layout, 2021. URL https://www.surrealsystems.com/
solutions/home-solutions/smart-home-layout. [Accessed April 18, 2021].
[28] TaraSeals. BlackHat: Critical ZigBee Flaw Compromises Smart
Homes, 2015. URL https://www.infosecurity-magazine.com/news/
blackhatcritical-zigbee-flaw-smart/. [Accessed March 17th, 2021].
[29] Katell Thielemann. Organizations now facing new threats - Protecting cyber-
physical systems, Dec. 22, 2020 . URL https://www.itproportal.com/features/
organizations-now-facing-new-threats-protecting-cyber-physical-systems/.
[Online; accessed 9-April-2021].
[30] R.J. Trudeau. Introduction to Graph Theory. Dover Books on Mathematics. Dover
Pub., 1993. ISBN 9780486678702. URL https://books.google.com/books?id=
8nYH5OYEW24C. [Online; accessed 9-April-2021].
[31] Wikipedia contributors. Document object model — Wikipedia, the free encyclope-
dia, 2021. URL https://en.wikipedia.org/w/index.php?title=Document_Object_
Model&oldid=1014012523. [Online; accessed 9-April-2021].
[32] Wikipedia contributors. Z-wave — Wikipedia, the free encyclopedia, 2021. URL
https://en.wikipedia.org/w/index.php?title=Z-Wave&oldid=1000389478. [On-
line; accessed 9-April-2021].
[33] Wikipedia contributors. OSI protocols — Wikipedia, The Free Encyclope-
dia, 2021. URL https://en.wikipedia.org/w/index.php?title=OSI_protocols&
oldid=1010987681. [Online; accessed 20-May-2021].
[34] Matthias Wilhelm, Ivan Martinovic, Jens Schmitt, and Vincent Lenders. Short Paper:38 BIBLIOGRAPHY
Reactive Jamming in Wireless Networks—How Realistic is the Threat? pages 47–52,
06 2011. doi: 10.1145/1998412.1998422.
[35] Tatsuya Yamazaki. The ubiquitous home. International Journal of Smart Home, 1, 02
2007.
[36] S. T. Zargar, J. Joshi, and D. Tipper. A Survey of Defense Mechanisms Against Dis-
tributed Denial of Service (DDoS) Flooding Attacks. IEEE Communications Surveys
Tutorials, 15(4):2046–2069, 2013. doi: 10.1109/SURV.2013.031413.00127.You can also read