Habitat Quality Index Assessment Rangitata River Arundel to Ealing - Forest and Bird
←
→
Page content transcription
If your browser does not render page correctly, please read the page content below
Habitat Quality Index Assessment
Rangitata River
Arundel to Ealing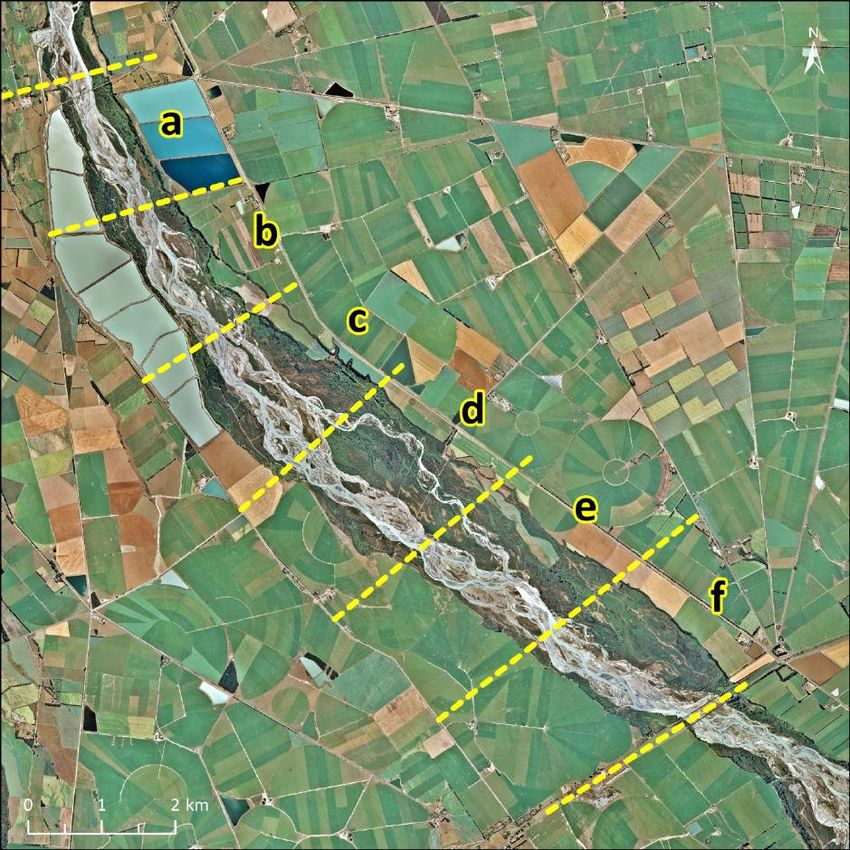
Rangitata River Habitat Quality Index (HQI) Assessment

Arundel to Ealing

Prepared by Thomas Kay

Forest & Bird | Te reo o te taiao

May 2020

Acknowledgements

Forest & Bird acknowledge the substantive work of Dr. Russell Death and Dr. Ian Fuller at Massey

University Innovative River Solution and their colleagues from various organisations in the development

of the Habitat Quality Index—this assessment is a merely re-application of their work to a different river.

We also acknowledge Oriane Etter for her work geo-referencing the historical imagery of the river.

Finally, acknowledgments to Massey Innovative River Solutions for the use of their drone to capture the

cover photo of this report and Victoria University staff Dugal McKinnon, Mo Zareei, and Jim Murphy for

their role in capturing the photo. Forest & Bird also acknowledge Dr Ian Fuller for his feedback on an

early draft of the report.

Cover photo

Looking down over the Rangitata riverbed and State Highway 72 bridge at Arundel from an altitude of

120m above ground level, July 2019. Photo: Thomas Kay.
Rangitata River HQI Assessment – Forest & Bird

Executive Summary

   1.   The modification of rivers for flood management, irrigation, and agriculture has resulted in a

        decline in the geomorphic condition and habitat quality of river systems.

   2.   Death et al. (n.d.a., n.d.b., in prep.) developed the Habitat Quality Index (HQI) as a method to

        identify and quantify changes in river habitat quality over time. Their method allows for a river’s

        ‘current’ physical condition to be assessed against its historical, or ‘near natural’ condition. It

        presents a measure of the change in condition from ‘then’ to ‘now’.

   3.   Forest & Bird undertook an HQI assessment of the Rangitata River between Arundel and Ealing

        in order to quantify any changes in habitat quality from 1937 to 2016-2018.

   4.   Parameters measured were active channel width, natural and permitted floodplain width, and

        mid-channel bar length, which was used to calculate a braiding index.

   5.   Resultant HQI scores are presented in the table below:

          REACH                 a         b         c          d         e          f          HQI overall

          Active channel      0.67      0.88       0.57       0.41      0.39      0.52           0.55

          Floodplain          0.53      0.55       0.85       1.00      1.00      1.00           0.92

          Braiding index      1.85      0.95       0.76       2.46      0.91      1.00           0.98

          HQI overall         0.67      0.88      0.76        1.00     0.91       1.00

   6.   Overall HQI scores, either for each reach or each parameter measured, are calculated as the

        median of all component scores. Pratt, Neverman, Fuller, & Death (2018) state that a decline of

        more than 15% in an overall score, or 40% in any single component score should be cause for

        concern and would indicate a potential need for mitigation activity.

   7.   The overall HQI scores for reaches a (0.67), and c (0.76), and the overall score for active channel

        width (0.55) are therefore cause for concern, indicating a significant reduction in the physical

        condition of the river through the a and c reaches and of the active channel width through all

        reaches. These low scores are likely a result of the reduction in flows that has occurred with

        increased water takes for irrigation, and the ‘development’ of vegetated bars and the

        floodplain along the edges of the river by farmers.

   8.   Flooding in December 2018 illustrated the impacts of these changes when the river temporarily

        reclaimed previously flowing channels and again resembled its condition in 1937.

                                                                                                             1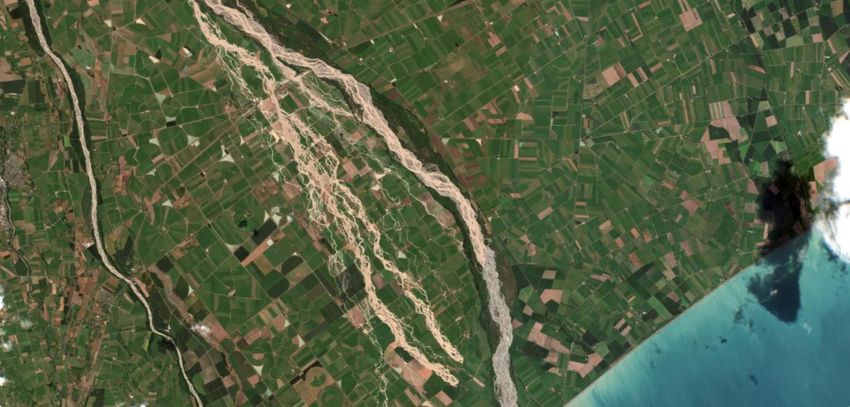
Rangitata River HQI Assessment – Forest & Bird

9.   The component floodplain scores for reaches a (0.53) and b (0.55) are also cause for concern.

     Construction of the storage ponds for the South Rangitata irrigation scheme appears to be the

     cause of this reduction.

10. The extension of this HQI assessment to the coast and to additional reference years would

     assist in illustrating more clearly the extent and cause of changes in habitat quality along the

     Rangitata River through time.

                                                                                                     2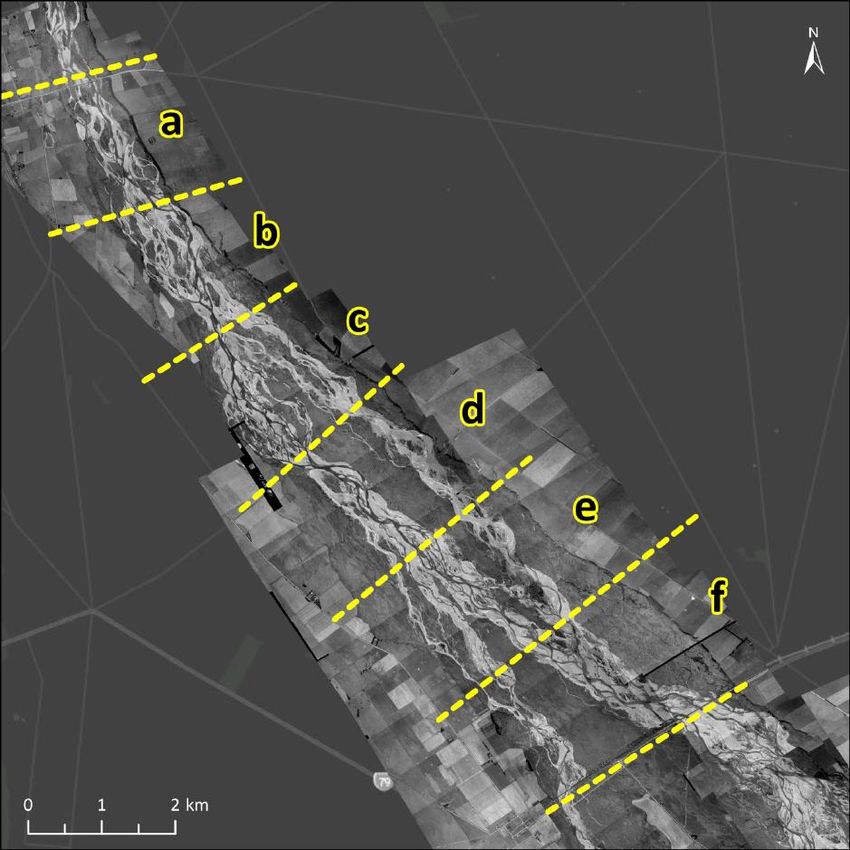
Rangitata River HQI Assessment – Forest & Bird

Introduction

Despite an increasing recognition of the importance of river and stream systems in providing life

supporting services to communities and biota, the condition of these environments continues to

decline (Maddock, 1999; Death, Fuller, & Macklin, 2015; Vaughan et al., 2009). With the frequency of

extreme climatic events increasing there is a perception that further modification to river systems will

be required as communities attempt to alleviate resultant effects on agriculture, health, or infrastructure

(Death, Fuller, & Macklin, 2015; Vaughan et al., 2009). While there has been some recognition of the

effect of these changes on biota, attention has generally been directed towards measuring the impact

of changes in water quality, water quantity, or the biotic assemblages themselves (Death, Fuller, &

Death, in prep.; Harding et al., 2009; Maddock, 1999; Raven, Fox, Everard, Holmes, & Dawson, 1997). It

has, until relatively recently, been ignored by many—including regulators—that the maintenance and

protection of physical habitat is vital to ensuring the health of river systems does not continue to

degrade (Death et al., in prep; Elosegi, Díez, & Mutz, 2010; Elosegi & Sabater, 2013).

        In response to this lack of attention towards the importance of physical habitat in riverine

ecosystems, Death et al. (n.d.a, n.d.b, in prep.) developed the 'Habitat Quality Index' (HQI) as a method

for assessing the current condition of a river’s physical habitat against its historic condition. It allows for

the quantification and assessment of those habitat variables most relevant for assessing the ecological

health, or geomorphological condition, of a river, and presents them as simple ratio scores of current

to natural condition. It also allows for the measurement of any number of parameters and measurement

at any scale, provided sufficient historic data from which to form a reference condition can be obtained.

        Forest & Bird considered the Rangitata River to be in desperate need of such an assessment

given that substantial modification to the river has occurred in recent decades. In particular, water takes

and diversions for irrigation, construction of water storage ponds, the cessation of flows down the south

branch of the river, and reclamation of vegetated banks/bars by neighbouring farmers appear to have

had a gross negative effect on the character of the river—perpetuated by a lack of regulation or a

suitable management framework for the protection of the river. We have undertaken this assessment

for a section of the Rangitata in an attempt to quantify the consequences of these actions and issues

on the physical condition of the river and illustrate the application of the HQI in future river

management.

                                                                                                             3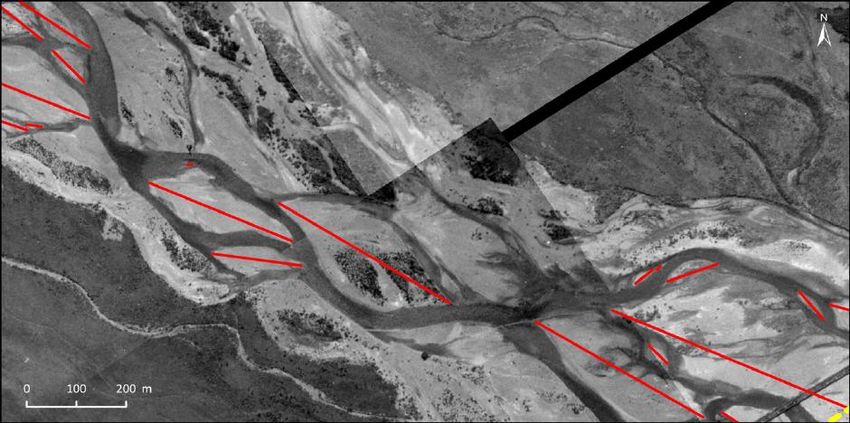
Rangitata River HQI Assessment – Forest & Bird
Rangitata River Context
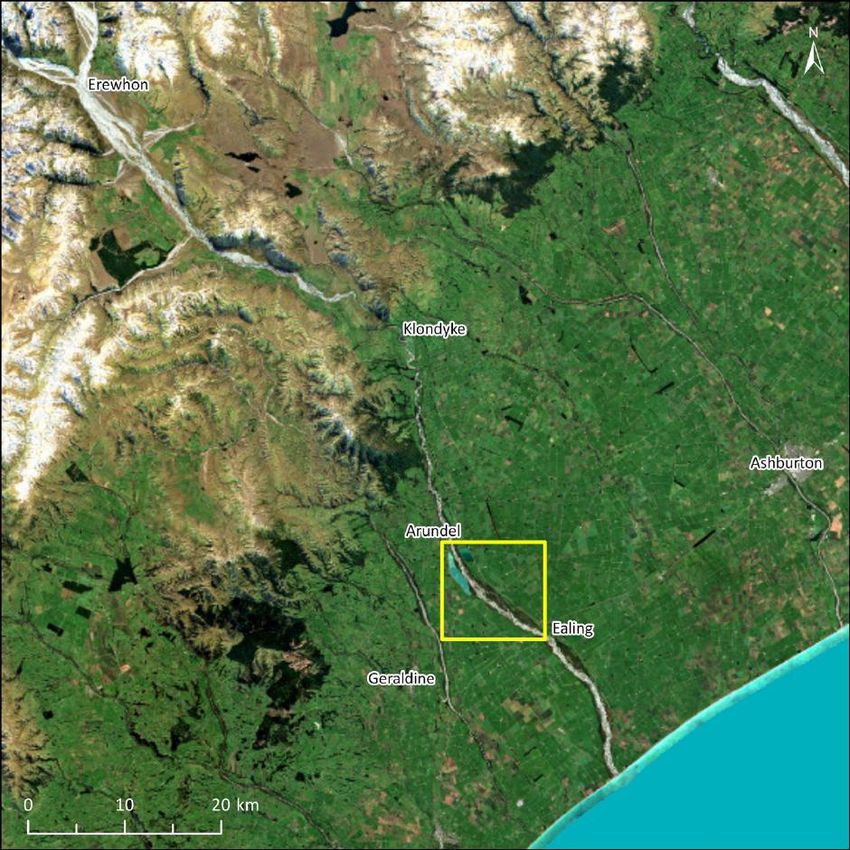
The Rangitata River is located in New Zealand’s South Island and flows from the Eastern edge of the
Southern Alps, near Erewhon, to the Pacific Ocean, between Ashburton and Geraldine (see Figure 2).
Beginning at the confluence of the Clyde and Havelock Rivers, the Rangitata’s upper catchment is
largely unmodified, dominated by alpine and sub-alpine ecosystems and braided river valleys. Except
for the impact of some agricultural activity at Erewhon and Mesopotamia (grazing of the riverbed
through LINZ agreements, etc.), the river is largely unmodified through this section. However, following
its emergence from the Rangitata Gorge at Klondyke, the river is subject to a substantial number of
takes and diversions for irrigation, including the large Rangitata River Diversion Race, completed in
1944 (RDR, n.d.), and the Rangitata South irrigation scheme (Piddington, 2013), before emerging on to
the Canterbury Plains, the most intensely irrigated area of land in the entire country (Statistics NZ,
2017).
The Rangitata was granted a Water Conservation Order in 2006 to protect a range of remaining
‘outstanding characteristics’ throughout the length of the river, from the sources of the Clyde and
Havelock Rivers all the way to the coast. This included the protection of geomorphological
characteristics noted in the order as “Scientific - braided river” from upstream of the Arundel bridge to
the coast (Rangitata WCO, 2006). The Rangitata River has only one flow monitoring station, located on
the final reach of the Rangitata Gorge at Klondyke (ECan, n.d.).
4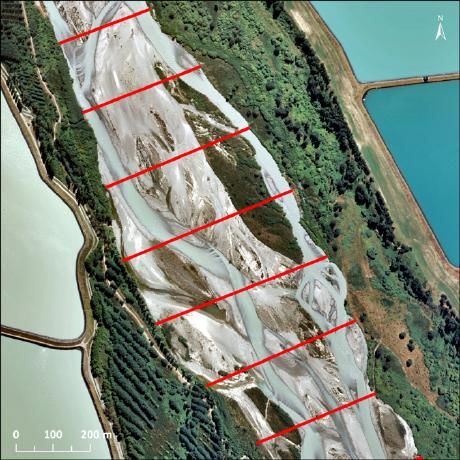
Rangitata River HQI Assessment – Forest & Bird

Figure 1: The Rangitata River, flowing from the top left to the bottom right of the map. The area

assessed in this report is contained within the yellow box and reproduced in figures 2 and 3 below.

                                                                                                       5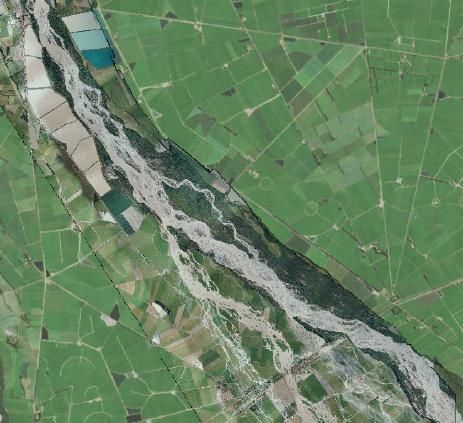
Rangitata River HQI Assessment – Forest & Bird

Measured Parameters and Data Sources

The assessment of the Rangitata River’s ‘current’ (2016-2018) habitat quality against its pre-modification

habitat quality was limited by the availability and quality of historical data (in the same way that Death

et al.’s (n.d.a., in prep.) assessments were limited). Historical black and white aerial imagery of the

Rangitata obtained from 1937 was considered a sufficient and near-natural ‘baseline’ on which to form

an assessment of some key habitat parameters, particularly as it was captured before any major water

diversions were operational. Coincidentally, work on the ‘Rangitata Diversion Race’, which was “New

Zealand’s first major river diversion and largest irrigation scheme” (ENZ, n.d.)—and which has likely had

an adverse effect on the Rangitata’s habitat quality—was started in 1937 but not completed until 1944

(RDR, n.d.).

        Parameters measured in this assessment were active channel width, natural and permitted

floodplain widths, and total length of mid channel bars (which was used to calculate a braiding index)

as these were readily measurable from historical and LiDAR imagery and were considered appropriate

to inform a relatively comprehensive picture of changes in physical habitat over time. Other relevant

finer-scale parameters (such as substrate composition, deposited sediment (Death et al., in prep.)) are,

at this time, not able to be accurately estimated from aerial imagery obtained at these resolutions

(Woodget, Fyfe, & Carbonneau, 2018) and would need to form part of a shorter-term assessment.

        Geo-referenced aerial photographs from 1937 and 2016-2018 were used to measure channel

characteristics, with ‘Light Detection and Ranging’ (LiDAR) imagery and NZ Topo50 maps used to

inform measures of floodplain width. Imagery from 1937 was obtained from the ‘RetroLens’ website

(http://retrolens.nz/map/) while all other data was obtained through the LINZ Data Service. Parameters

were assessed for a series of reaches (a-f as illustrated in Figures 2 and 3), each approximately 2km

long, in order to simplify subsequent analysis.

        Active Channel and Floodplain Widths

        Active channel and floodplain widths were measured in ArcGIS Pro 2.3.1 using aerial and LiDAR

        imagery and a New Zealand Topo50 topographic map (LINZ, 2020). Both were defined and

        measured in line with the methodology of Death et al. (in prep.). That is—active channel width

        was defined as the width of the wetted channel, active gravel bars, and mid-channel islands

        combined (including those with vegetation where it wasn’t mature enough to limit reworking);

        natural floodplain width was defined as the width between the two youngest river terraces; and

        permitted floodplain width was defined as the width of floodplain still accessible to the river

                                                                                                         6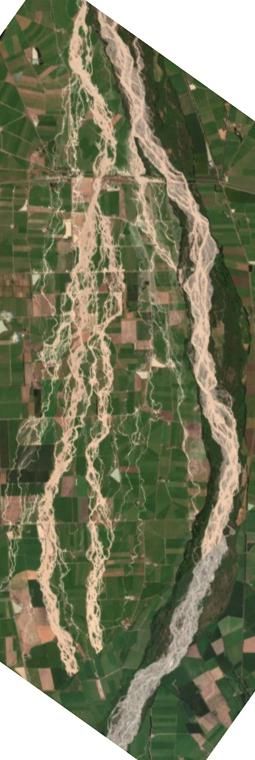
Rangitata River HQI Assessment – Forest & Bird

during a flood. Widths were measured using the line tool ArcGIS Pro on transects at

approximately 200 metre intervals running perpendicular to the channel’s flow. The assessment

of natural floodplain width was supplemented with the use of a topographic map as

comprehensive LiDAR imagery was not available for the Arundel-Ealing reach and substantial

engineering works on the true right bank have destroyed any remnant river terraces that may

have otherwise been visible with LiDAR. An example of active channel width measurement is

illustrated in Figure 4.

Braiding

Braiding was assessed using Brice’s Index, as defined in the work of Death et al. (in prep.),

which states the extent of braiding is twice the total length of mid-channel bars in a reach

divided by the mid-channel length of that reach. Bar length for each reach was measured in

ArcGIS Pro using the line tool, multiplied by two, and then divided by the reach length as

measured with the ruler tool. Given that the Rangitata River has many thalwegs, the mid-

channel length was considered to be the length down the centre of the riverbed from the start

to the end of each reach and was identical in 1937 and 2017/2018. An example of how braids

were measured is illustrated in Figure 5.

                                                                                              7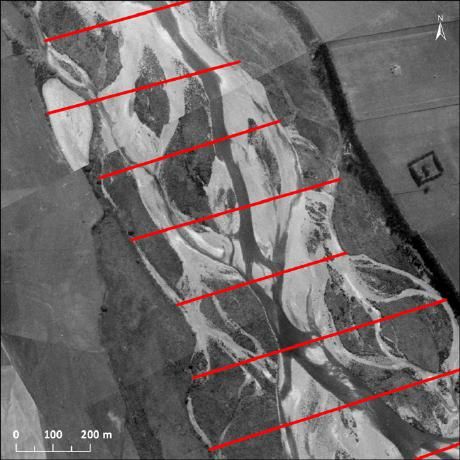
Rangitata River HQI Assessment – Forest & Bird

Figure 2: Rangitata River from Arundel to Ealing in 1937. The river has been divided into reaches (a-f)

for analysis. Arundel is at the top left of the map, while Ealing is at the bottom right. The first and last

yellow lines overlap approximately with the two State Highway bridges.

                                                                                                          8
Rangitata River HQI Assessment – Forest & Bird
Figure 3: Rangitata River from Arundel to Ealing in 2016-2018. The river has been divided into reaches
(a-f) for analysis. Arundel is at the top left of the map, while Ealing is at the bottom right. The first and
last yellow lines overlap approximately with the two State Highway bridges.
9Rangitata River HQI Assessment – Forest & Bird
Figure 4: An example of how lines were drawn in ArcGIS Pro to measure the active channel width in
1937 (left) and 2016-2018 (right). The total length of all lines in a reach was divided by the number of
transects in the reach to calculate an average width. Imperfections, lower clarity, and a lack of colour in
the 1937 imagery made accurate assessment more difficult. Note that the two images here are the same
location and scale.
Figure 5: Lines drawn in ArcGIS Pro following the long axis of mid-channel bars in 1937. The total length
of all lines in a reach was multiplied by two and then divided by the reach length to obtain a braiding
index. The end of reach f can be seen at the bottom right of the image. Accurate assessment in some
parts of the riverbed was difficult as a result of discontinuities (from the orthomosaic), lower resolution,
and a lack of colour in the 1937 imagery, and over-exposure in some of the 2016-2018 imagery.
10Rangitata River HQI Assessment – Forest & Bird
Results
HQI scores are presented as a ratio of the current condition of each parameter over its historical (or
‘natural’) condition (Death et al., in prep.). As an example, the average active channel width of reach a
in 2016-2018 was 382m, while its average width in 1937 was 569m. The HQI score for active channel
width in reach a is therefore expressed as:
Width in 2017 382
HQIactive channel = = = 0.67
Width in 1937 569
Measurements for active channel and floodplain width, mid-channel bar length, and braiding indices
are presented in Table 1 with resultant HQI scores. Table 2 summarises these HQI scores and includes
an ‘overall’ median HQI score for each reach and parameter. The median is used as the overall HQI
score as it avoids any skewing in the assessment that may occur as a result of using the mean (Death et
al., in prep.).
Table 1: Component HQI scores for each reach and each parameter measured.
REACH a b c d e f
Active width 1937 (m) (avge) 569 689 1271 1388 1559 1098
Active width 2016-2018 (m)
382 604 727 569 605 571
(avge)
HQI active channel 0.67 0.88 0.57 0.41 0.39 0.52
Natural floodplain (m) (avge) 1836 1963 2480 3310 3723 4428
Permitted floodplain (m) (avge) 978 1072 2107 3310 3723 4416
HQI floodplain 0.53 0.55 0.85 1.00 1.00 1.00
Mid-channel bars 1937 (m)
2007 4017 8775 3445 9681 6655
(total)
Mid-channel bars 2016-2018 (m)
3716 3831 6628 8484 8764 6688
(total)
Braiding index 1937 2.02 4.04 8.98 3.37 9.74 6.35
Braiding index 2018 3.74 3.85 6.79 8.30 8.82 6.38
HQI braiding 1.85 0.95 0.76 2.46 0.91 1.00
11Rangitata River HQI Assessment – Forest & Bird
Table 2: Component and overall HQI scores for each reach parameter measured.
REACH a b c d e f HQI overall
Active channel 0.67 0.88 0.57 0.41 0.39 0.52 0.55
Floodplain 0.53 0.55 0.85 1.00 1.00 1.00 0.92
Braiding index 1.85 0.95 0.76 2.46 0.91 1.00 0.98
HQI overall 0.67 0.88 0.76 1.00 0.91 1.00
Active channel width was the only parameter with HQI values lower than 1.00 across all reaches and
had relatively consistently values from Arundel to Ealing. It also had the lowest HQI score (0.39 in reach
e). Floodplain width also had some low scores (0.53 in reach a and 0.55 in reach b) but values increased
to 1.00 by reach d and were then consistently 1.00 through to reach f. Braiding scores were variable
with some scores greater than, and others less than, 1.00. Braiding was the only parameter with HQI
scores greater than 1.00.
Discussion
Pratt, Neverman, Fuller, & Death (2018) state that a decline of more than 15% in an overall HQI score
or more than 40% in any single component score (i.e. HQI scores below 0.85 and 0.60 respectively)
should be cause for concern and would indicate a potential need for mitigation activity. The overall
HQI scores for reaches a (0.67) and c (0.76) are therefore cause for concern, indicating a significant
reduction in the physical condition of the river through these sections of the river (approximately 4km
in total). Notably in these reaches all component scores—except the braiding index in reach a—were
0.85 or less. These low scores appear to be primarily a result of the encroachment of the storage ponds
for the South Rangitata irrigation scheme on to the floodplain and the reduction in flows that is likely
to have occurred with the increased water takes for irrigation (Stats NZ, 2020). Specific analysis of the
floodplain immediately before and after the construction of the storage ponds and analysis of flow
trends would be needed to confirm this.
The overall HQI score for active channel width (0.55) is also cause for concern. It is likely that a
substantial increase in water takes since 1937 to service intensive farming on the Canterbury Plains is
the main driver for this score, along with the reclamation by farmers of vegetated bars and the
floodplain along the edges of the river (most clearly illustrated by the disappearance of the ‘south
branch’ of the river).
12Rangitata River HQI Assessment – Forest & Bird
Interestingly, the overall HQI score for floodplain width is relatively high at 0.98. This indicates
the river is largely still connected to its floodplain and in a relatively ‘natural’ condition (although it
should be noted that many aspects of the floodplain, such as its vegetation, are not in a natural
condition). This high score appears to be a result of the relatively limited presence of any flood control
measures or stopbanks along the river, allowing the river to spill on to its floodplain in times of high
flow, and should be commended for preserving its floodplain connection. The connection of the river
to its floodplain was emphasised by the ‘reclamation’ of the south branch of the river during floods in
December 2019, as shown in Figures 6, 7, and 8. Figure 8 shows how the maintained floodplain
connection allowed the river to temporarily reclaim its south branch during flooding in December 2019,
resembling a more natural condition illustrated in the 1937 imagery. It also illustrates the floodplains
role in energy dispersal during a large flood (note this lower section was not assessed for its HQI).
Braiding index HQI scores were lower than 1.00 in some reaches, significantly higher than 1.00
in other reaches, and close to 1.00 in others. The reason for this is beyond the scope and expertise of
this report, however it is suspected that a potential difference in flow between aerial surveys (with the
1937 survey undertaken in spring (October) and the 2016-2018 survey undertaken over two summers),
a difference in the resolution of the images (which may affect the accuracy of judgement between a wet
and dry channel and the size of braids), and potential interactions with channel width would explain
some of this difference.
13Rangitata River HQI Assessment – Forest & Bird
Figure 6: Rangitata River from Arundel to Ealing before (left) and during (right) flooding on the 9th of
December 2019. Note the ‘reclamation’ of the south branch of the river. (ECan, n.d.).
Figure 7: Orthomosaic image of the Rangitata River in flood, December 2019. Note the ‘reclamation’
of the south branch of the river.
14Rangitata River HQI Assessment – Forest & Bird
Figure 8: The lower Rangitata River in 1937 (left) and in flood in December 2019 (right). The flood
allowed the river to temporarily reclaim its south branch and greatly resemble its 1937 condition.
15Rangitata River HQI Assessment – Forest & Bird
Limitations and Opportunities
While the HQI is a useful tool for the summary of geomorphic variables, it is not an absolute measure
of habitat quality (Death et al., in prep.). It simply expresses the relative change in those variables of
river character that are relevant and readily measurable based on the data available—it assigns a value
to the degree of ‘improvement’ or ‘degradation’. In this assessment the desire to measure against a
reference condition as close to ‘natural’ as possible limited the meaningful variables we could readily
measure to three. As mentioned earlier, measurement of additional variables may be achievable from
additional aerial imagery at intermediary timeframes.
In measuring parameters there is a somewhat arbitrary nature in the judgement of an assessor
in analysing aerial imagery (e.g. when is a braid/mid-channel bar no longer sufficiently separated from
the bank or another bar? Is that over-exposed section of riverbed a result of bright boulders or the
reflection from a wetted channel?). While in this assessment the potential for these judgment calls to
introduce error has been minimised through the use of a single assessor undertaking all of the analysis
(utilising the same ‘rules of judgement’ to map the parameters of the 1937 and 2016-2018 features),
there is always room for errors of human judgement to creep in. Reductions in the accuracy of
assessment may also occur as a result of the differences in resolution and continuity of the imagery—
e.g. that of 1937 had to be mosaicked together from historic ‘slides’ and was limited to a grayscale
band, while that of 2016-2018 was in full colour and a higher resolution, but still had over-exposed
sections. Despite this, we are confident that for the purposes of this analysis any cumulative error would
be minimal and the scores in this report can be considered as robust as is realistically achievable.
There are numerous opportunities for further assessment of the Rangitata River with the HQI.
As a start this assessment against the 1937 baseline could be continued downstream to the coast.
Further assessment could be completed against data from intermediary years (i.e. between 1937 and
2016-2018) to draw out rates of change or moments when change was most apparent or at significant
times, such as when the Water Conservation Order was gazetted, to determine whether management
actions had any effect on preventing the degradation of physical habitat. Additional parameters, such
as the area of bars or percentage of pools, could also be introduced where reference imagery is more
detailed.
16Rangitata River HQI Assessment – Forest & Bird
Conclusion
The physical habitat condition of the Rangitata River between Arundel and Ealing in 2016-2018 is lower
than it was in 1937. Overall habitat quality in two of the six reaches assessed has declined by an amount
worthy of concern and mitigation/remediation, while in the other reaches the condition had dropped
only slightly or remained stable. Habitat quality scores within a number of reaches, and for a number of
parameters are, however, worryingly low. It is suspected that this is primarily a result of the
encroachment of the storage ponds for the South Rangitata irrigation scheme on the floodplain, the
likely reduction in flows that has occurred with increased water takes for irrigation, and the reclamation
by landowners of vegetated bars and the floodplain along the edges of the river. The extension of this
HQI assessment to the coast and to additional reference years would assist in illustrating clearly the
extent and cause of changes in habitat quality along the Rangitata River.
Note:
2016-2018 Orthophotography was taken in the Canterbury Region in the flying seasons (summer period)
2016-2018. Imagery was captured for the Canterbury Regional Council by Aerial Surveys Ltd, Unit A1, 8
Saturn Place, Albany, 0632, New Zealand.
1937 imagery was obtained from http://retrolens.nz/ and licensed by LINZ CC-BY 3.0. Images were
captured on the 6/10/1937, survey number: SN62, at an elevation of 9000 feet.
17Rangitata River HQI Assessment – Forest & Bird
References
Death, R., Death, A., Jordan, C., Fuller, I. C., & Cameron, D. (n.d.a). A technique (eNCI) for assessing
natural character impacts of river management activities.
Death, R. G., Fuller, I. C., & Death, A. M. (in prep). A technique to assess river habitat change – the
missing dimension for water resource management.
Death, R. G., Fuller, I. C., Death, A. M., & Petrove, N. (n.d.b). Protection of New Zealand native fish
habitat - a technique to assess change in river habitat – the eHQI.
Death, R. G., Fuller, I. C., & Macklin, G. (2015). Resetting the river template: the potential for climate
related extreme floods to transform river geomorphology and ecology. Freshwater Biology, 60,
2477-2496.
Elosegi A., & Sabater, S. (2013). Effects of hydromorphological impacts on river ecosystem functioning:
a review and suggestions for assessing ecological impacts. Hydrobiologia, 712, 129-143.
Elosegi, A., Diez, J., & Mutz, M. (2010). Effects of hydromorphological integrity on biodiversity and
functioning of river ecosystems. Hydrobiologia, 657, 199-215.
ENZ (Engineering New Zealand) (n.d.). Rangitata Diversion Race. Retrieved from
https://www.engineeringnz.org/our-work/heritage/heritage-records/rangitata-diversion-race/
ECan (Environment Canterbury Regional Council). (n.d.). River flow data. Retrieved from
https://www.ecan.govt.nz/data/riverflow/
ECan (Environment Canterbury Regional Council). (n.d.). Rangitata Flood Imagery.
https://ecan.maps.arcgis.com/apps/Compare/index.html?appid=e62383f6c37d42b79
9c527f71193bdc5
ECan (Environment Canterbury Regional Council). Rangitata River – why did it flood and what happens
now? https://www.ecan.govt.nz/get-involved/news-and-events/2019/rangitata-river-
why-did-it-flood-and-what-happens-now/
18Rangitata River HQI Assessment – Forest & Bird
Harding, J., Clapcott, J., Quinn, J., Hayes, J., Joy, M., Storey, R., ... Boothroyd, I. (2009). Stream Habitat
Assessment Protocols for wadeable rivers and streams of New Zealand. Christchurch, New
Zealand: University of Canterbury.
LINZ. (2020). NZ Topo50 Maps. https://data.linz.govt.nz/layer/50767-nz-topo50-maps/
Maddock, I. (1999). The importance of physical habitat assessment for evaluating river health.
Freshwater Biology, 41, 373-391.
Piddington, S. (2013, October 22). Ponds of liquid Rangitata gold. Timaru Herald. Retrieved from
http://www.stuff.co.nz/timaru-herald/news/9309872/Ponds-of-liquid-Rangitata-gold
Pratt, R., Neverman, A., Fuller, I., & Death, R. (2018). Waikanae River Habitat Quality Index Assessment:
Jim Cooke Memorial Park. Palmerston North, New Zealand: Massey University School of
Agriculture & Environment.
Rangitata WCO (Water Conservation (Rangitata River) Order). (2006). Retrieved from
http://legislation.govt.nz/regulation/public/2006/0401/latest/DLM6667952.html
Raven, P. J., Fox, P., Everard, M., Holmes, N. T. H., & Dawson, F. H. (1997). River habitat survey: a new
system for classifying rivers according to their habitat quality. In P.J. Boon & D. L. Howell (Eds.),
Freshwater Quality: Defining the indefinable. (pp. 215–234). Edinburgh, UK: Stationery Office.
RDR (Rangitata Diversion Race Management Ltd). (n.d). The Rangitata Diversion Race. Retrieved from
http://www.rdrml.co.nz/about-us/37-the-rangitata-diversion-race
Statistics NZ. (2017). Irrigated Land Area. https://statisticsnz.shinyapps.io/irrigated_land_area/
Vaughan, I. P., Diamond, M., Gurnell, A. M., Hall, K. A., Jenkins, A., Milner, ... Ormerod, S. J. (2009).
Integrating ecology with hydromorphology: a priority for river science and management.
Aquatic Conservation: Marine and Freshwater Ecosystems, 19, 113-125.
Woodget, A.S., Fyfe, C., & Carbonneau, P. E. (2018). From manned to unmanned aircraft: Adapting
airborne particle size mapping methodologies to the characteristics of sUAS and SfM. Earth
Surface Processes and Landforms, 43, 857-870.
19You can also read