Health and Safety Update - Cincinnati ...
←
→
Page content transcription
If your browser does not render page correctly, please read the page content below

Health and Safety Update

Sarah Trimble-Oliver

Krista Boyle

Jeremy Gollihue

                       1
Health and
Safety

             2
School Measures for COVID Safety as of March 9, 2021
Measure Value Cincinnati Public Schools Positive Cases
140
# In School Transmissions: 7 CPS Student Positive cases CPS Staff Positive cases
120
% Implementation of safety protocols: 96.9%
100
Number of classes or schools with a 0
cluster of positive cases: 80
Number of student positive cases: 500 62
59 57
60
49
Number of staff positive cases: 575 43 43 43 42 41 45
37 37 38
40 35
32
28 28 30
Certificated Staff Attendance 96.35% 20 20
26
20
23 22 22
18
20 17 15 14 13
16
11 10 12
Civil Service Staff Attendance 91.39% 2
7 5 4 6
2
0
Percent of screening testing with positive X
results:
Health officials stress the importance of protection protocols in schools, including measuring the implementation of reliable protocols, maintaining protocols consistently over time, and measuring daily cases and quarantines in schools. Before September
2020, this data was not readily available for our region. However as charter, non-public, and public schools began opening for in-person learning in Hamilton County, and Ohio Department of Health created a reporting system for school COVID-19 cases,
this data is now readily available to measure the amount of COVID-19 spread in schools. Early evidence is that there is little to no spread within schools in our region, however health officials are working on a system to better utilize the new data from
schools that have re-opened in person.
3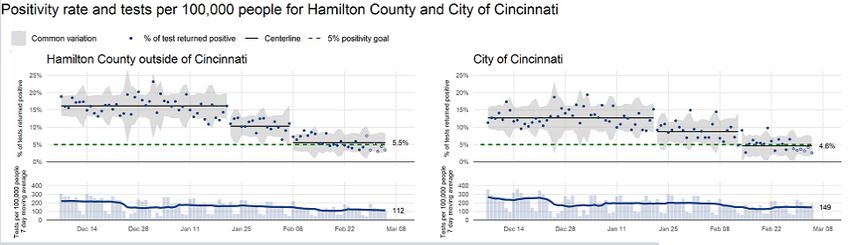
Community Trends
           Hamilton County School Districts as of
                      March 4, 2021
                             Public            Charter            Private                Total
                            Schools            Schools            Schools

 New Student                    56                  0                  8                   64
  COVID-19
   Cases*
   New Staff                    12                  0                  4                   16
   COVID-19
    Cases*
   Cumulative                 2472                102               1278                 3852
    Student
   COVID-19
    Cases**
  Cumulative                  1716                 96                478                 2290
 Staff COVID-
  19 Cases**
 Total number              114,225              6,963             34,838              156,026
  of students
   enrolled
*New cases are for the past one week. **Cumulative cases beginning 9/7/20
Health officials stress the importance of protection protocols in schools, including measuring the implementation of reliable protocols, maintaining protocols consistently over time, and measuring daily cases and quarantines in schools. Before September
2020, this data was not readily available for our region. However as charter, non-public, and public schools began opening for in-person learning in Hamilton County, and Ohio Department of Health created a reporting system for school COVID-19 cases, this
data is now readily available to measure the amount of COVID-19 spread in schools. Early evidence is that there is little to no spread within schools in our region, however health officials are working on a system to better utilize the new data from schools that
have re-opened in person.
For more information about measuring protection protocols, see Source: Ohio Department of Health COVID-19 Dashboard for Schools: https://coronavirus.ohio.gov/wps/portal/gov/covid-19/dashboards/schools-and-children/schools

                                                                                                                                                                                                                                      4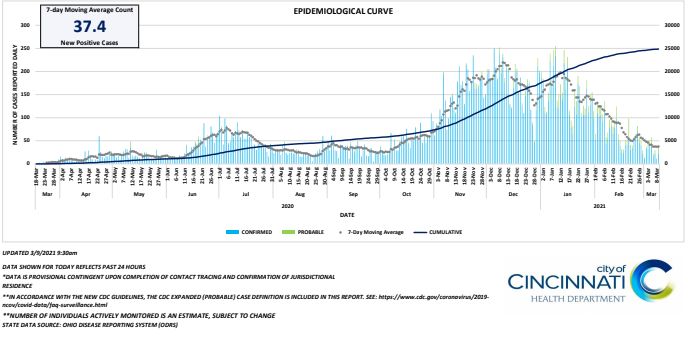
Community Trends
City of Cincinnati Daily New Cases as of March 9, 2021
                                                     The City of Cincinnati Epidemiological Curve shows
                                                     the cumulative number of new cases (dark blue
                                                     line), the daily number of new COVID-19 cases in
                                                     the city (light blue column), and the 7-Day moving
                                                     average of daily new cases (gray dotted line). The
                                                     7-Day moving average demonstrates the level of
                                                     virus in the community. Health officials
                                                     recommend using the 7-Day moving average and
                                                     the suggested thresholds from the Harvard Global
                                                     Health Institute based on Daily New Cases per
                                                     100,000 individuals (see further explanation of
                                                     these thresholds at: Source: The Health
                                                     Collaborative — https://www.cincinnati-
                                                     oh.gov/health/covid-19/covid-19-measures-to-
                                                     inform-school-district-decisions//

                                                                            5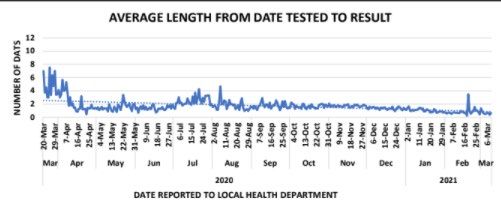
Community Trends
Number of Cases as of March 9, 2021

 The City of Cincinnati Number of Cases in 14-Day Period shows the daily number of new cases (dark blue line) and the 7-Day moving
 average (red/green dots). The 7-Day moving average dot is red if the value increased from the prior day and green if it decreased from
 the prior day. Health officials recommend using the 7-Day moving average suggested thresholds from the Harvard Global Health
 Institute AND the 7-Day moving average 14-Day trends. See further explanation of these thresholds at: Source: The Health
 Collaborative — https://www.cincinnati-oh.gov/health/covid-19/covid-19-measures-to-inform-school-district-decisions/

                                                                                                                                          6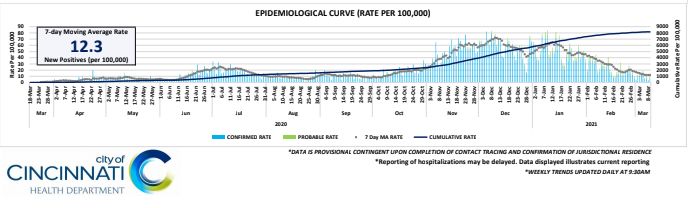
Community Trends
Positivity Rate as of March 7, 2021

The positivity rate is the percent of COVID-19 tests that are positive out of all the tests administered each day. The rate is shown for the City of Cincinnati on
the right, and for the county outside of the City of Cincinnati on the left. Health officials recommend a positivity rate below 5%.Source: The Health
Collaborative — https://www.cincinnati-oh.gov/health/covid-19/covid-19-measures-to-inform-school-district-decisions/

                                                                                                                                                      7
Community Trends
Average Length from Date Tested to Result as of March 9, 2021
The City of Cincinnati Average Length from Date Tested to Result measure shows the average number of days from test administered to
test result reported to local health department for positive results. This measure indicates whether our testing and reporting system can
adequately handle the demand and is important to identifying and isolating positive cases. Source: Source: City of Cincinnati COVID-19
Dashboard
https://www.cincinnati-oh.gov/covid19/interactive-map/
8Virus Variants
• How prevalent are the variants in
Cincinnati and Ohio?
• Are they more contagious, are they causing
more admissions to hospitals, are there
different effects in children, and are the
vaccines effective against them?
• Is there any idea when they may peak
in this area?
• What are the concerns specifically for the
B117 virus?
910
Survey Results in Context
• We have a statistically relevant sample size across stakeholder
  groups and higher parent participation than we have seen in
  similar previous surveys – this is good!

• It is not intended to be a count of individual preference or a “vote”
  that leads to a “win” or a “loss”

• It is an aid to judgement and one factor of many in decision
  making

                                                                 11
Parent Survey: Key Take-Aways
Parent participation districtwide was similar to bi-weekly pulse checks
and higher than previous surveys on the same topic
• 21% Districtwide, excluding Walnut Hills
• 40% Walnut Hills
The percent of parents who prefer additional in-person instruction during
4th-quarter is fairly consistent across the district, including with staff
• 58% Districtwide parents, excluding Walnut Hills
• 54% Walnut Hills parents
• 57% Staff
Similarly, the percent of parents who prefer 5 days per week in-person
instruction for fall is also fairly consistent and a little higher for staff
• 67% Districtwide, excluding Walnut Hills
• 70% Walnut Hills
• 86% Staff
12Detailed Parent Survey Results
Fourth Quarter: Learning model preferences
Prefer Blended 1377 (20%) 116 (10%)
Prefer 4 or 5 days in person 3955 (58%) 610 (54%)
4-day: 1,055 (16%) 4-day: 170 (15%)
5-day: 2,900 (43%) 5-day: 440 (39%)
Prefer 5-day distance 897 (22%) 405 (36%)
CDA: 41 (1%) CDA: 8 (1%)
Current school: 856 (20%) Current school: 397 (35%)
Fall: Comfort-level with 5-day per week in-person learning
Yes 67% 70%
No 26% 9%
Unsure 7% 21%
13Walnut Hills Student Survey
Why a survey for Walnut Hills
students?
It was a student-led initiative and a Participation 729 Representing 74 zip
result of their unique circumstance of (26%) codes
being fully distant for the school year
5-days online 191 31% prefer distance
CDA 37
How was it fielded?
5 days in-person 147 42% prefer mostly/all
Through official school channels in-person
4 days in-person 157
2 days blended 197 27% prefer blended
What does it tell us?
Students appear to be more evenly
split across distance, in-person and
blended than parents
14Staff Survey: Key Take-Aways
Fourth Quarter: 57% of staff “somewhat comfortable” to “highly comfortable”
returning to 5-day in-person learning
Fall: 86% of staff “somewhat comfortable” to “highly comfortable” returning to
5-day in-person learning
Staff identified the “most important” factor to their decision (top 4)
Fourth Quarter Fall
20% 6-feet of social distance 22% student instructional time
16% robust safety protocols in buildings 20% community health data
16% student instructional time 15% robust safety protocols in buildings
16% learning model consistency 14% learning model consistency
15Detailed Staff Survey Results
Participation 1,617 (29%)
Teachers: 944 (62% of participants)
Fourth Quarter: Comfort-level with 5-day per week in-person learning in 4th quarter?
Highly comfortable, comfortable, 57%
somewhat comfortable Highly comfortable: 301 (20%)
Comfortable: 242 (16%)
Somewhat comfortable: 306 (21%)
Not comfortable 43%
Fall: Comfort level with 5-day per week in-person learning in fall?
Highly comfortable, comfortable, 86%
somewhat comfortable Highly comfortable: 474 (32%)
Comfortable: 377 (25%)
Somewhat comfortable: 422 (29%)
Not comfortable 14%
1617
What is Possip?
• Bi-weekly pulse checks for families to share their “happiness”
  level with their school and also an opportunity to ask questions,
  share concerns and engage with school leaders
• Via email or text – 87% prefer text
• 71 language options fielded within CPS
• Multiple strategies in place to encourage participation and
  engagement, including numerous touch points (district and
  school newsletters, parent forums, principal and resource
  coordinator outreach, follow-up on individual needs and
  questions)

                                                              18
Possip Update
Engagement is increasing but we still have work to do to reach our goal of 45%
Response Rate/Engagement: Lead Indicator
Baseline (December) February March Goal
7% 23.3% 26.2% 45%
Happiness dipped slightly from 65.4% in February, to 63.8% in March, but we expect to see it
trend upward again as parents have clarity for fourth quarter and fall
Sentiment: Lag Indicator
Baseline (December) February March Goal
60% 65.4% 63.8% 65%
19Response Rate is Improving
February: March:
Title 1 Schools Title 1 Schools
• Elementary: 16.7% • Elementary: 19%
• High School: 14.1% • High School:16%
• Total: 16.2% • Total: 18%
Non-Title 1 Schools Non-Title 1 Schools
• Elementary: 29.9 • Elementary: 32%
• High School: 28.5 • High School:34%
• Total: 32%
• Total: 28.3
20Sentiment Has Slightly Declined
March: Title 1 Schools
• Elementary: 58.7% are “happy”, 26.2% are “mostly happy”, 15.1% are “not happy”.
• High School: 54.8% are “happy”, 37.1% are “mostly happy”, 8.1% are “not happy”.
Non-Title 1 Schools
• Elementary: 41.7% are “happy”, 36.8% are “mostly happy”, 21.5% are “not happy”.
• High School: 41.8% are “happy”, 25.6% are “mostly happy”, 32.6% are “not happy”.
February: Title 1 Schools
• Elementary: 70.3% are “happy”, 16.7% are “mostly happy”, 13% are “not happy”.
• High School: 56.7% are “happy”, 20.5% are “mostly happy”, 22.8% are “not happy”.
Non-Title 1 Schools
• Elementary: 60.6% are “happy”, 27% are “mostly happy”, 12.4% are “not happy”.
• High School: 53.2% are “happy”, 25.8% are “mostly happy”, 21% are “not happy”.
2122
Original Timeline (3+ years)

                               23
Consultancies
Enterprise partners – Cisco, Hewlett Packard, JW Affinity, Cincinnati Bell
and dozens of individual solution vendors
• Alignment and support
• Provide resources and project management
• Bring new players to the table as discovered if can be helpful
Parents/parent advocate groups and IT professionals
• Clarity to the detailed nature of the limitations
• Willingness to help in any way possible
Other districts
• Facing many of the same limitations and resource decision
• Both successes and lessons learned
24The Focus of our work
What we have done so far
To condense the • Deployed 35,000+ devices to all of our students,
timeline to be as short upgraded all teachers to a laptop for mobile and
as possible to be able remote-capable teaching, and are in process of
upgrading our administration likewise
to provide Concurrent • Provided 7000+ students with Free Internet
Instruction with and Wi-Fi
equitable quality to • Upgraded all CPS sites to support all staff
both in-person and working in buildings to support the full
remote students. remote option
25The Focus of our work
• Devices (recovery, distribution)
• Access (Connect Our Students/Internet service provision)
• Remote capable access for teaching supports
• In-building cabling
• Internet (monitoring/security)
• Wi-Fi (upgrade and outdoor)
• Classroom technology (video, audio, virtual space)
• Student outcome data available to schools and teachers
• Training
26Outcome Timeline (18 months)
Capacity growth and progression milestones:
Fall: Classes with highest amount of remote only students
Spring: All appropriate class rooms
As capacity increases, the number of classes
able to offer concurrent instruction directly increases.
2728
Choice for Families: What it could look like
5 Days/Week In-Person Choice                             Distance Learning Choice

• Universal use of masks                                 • Cincinnati Digital Academy
• Physical distancing to the maximum extent
  possible but may not be 6’
                                                         OR
• Handwashing and respiratory etiquette
• Cleaning and ventilation                               • Distance Learning from home school options
• Contact tracing, isolation, quarantine                    Spring 2021 – Distance Learning with Schoology
                                                            Fall 2021 – Concurrent/live streaming options for classrooms
• Screening testing (coming for high schools)                          with highest amount of remote only students
                                                            Spring 2022 – Concurrent/live streaming options for all
• Vaccinations for staff

                                 COULD BEGIN WEDNESDAY MARCH 31
                  Walnut Hills to be phased in by grade level to learn new safety protocols

                                                                                                           29
/CincinnatiPublicSchools /user/IamCPS @IamCPS @IamCPS
You can also read