Health and the Built Environment
←
→
Page content transcription
If your browser does not render page correctly, please read the page content below
Intersections: Health and the Built Environment
                                                  C   an we build our way to better health? Intersections: Health and the Built
                                                      Environment answers this question with a resounding yes. From community
                                                  design that facilitates active living to fostering access to healthy foods and offer-
                                                  ing building amenities that support active lifestyles, ULI members, partners, and
                                                  other leaders in real estate and land use have a role to play in responding to one
                                                  of the most pressing challenges of our day: health.
                                                      Whether it’s adding trails and sidewalks to master-planned communities,
                                                  recycling an abandoned rail line as public open space, or building new food desti-
                                                  nations, developers, architects, planners, and others are working together to add
                                                  both health and value to the metropolitan landscape.
                                                      This publication explores global health trends and makes the link between
                                                  those trends and what has been happening to our built environment. Leading
                                                  thinkers—a developer, an architect, a doctor, and an advocate—share their in-
                                                  sights on where the relationship between health and development is going. And
                                                  innovative approaches and projects that are helping to move the needle on health
                                                  are showcased.
                                                      Global health challenges are daunting. But Intersections: Health and the Built
                                                  Environment shows how change can happen—one community, and one project,
                                                  at a time.
                                                      How are you helping move the needle on health? Join the conversation via

                                                                                                                                                                                            Intersections
                                                  Twitter at #ulihealth.

                                                                                                                                                                                            Health and the Built Environment
                                              1025 Thomas Jefferson Street, NW
                                              Suite 500 West
                                              Washington, DC 20007
                                              www.uli.org
                                              ISBN: 978-0-87420-282-3

                                              I S B N 978-0-87420-282-3
                                                                          52495

                                              9   780874 202823

Intersections-2013_cover+spine_v5_AA.indd 1                                                                                                                                                                                    10/24/13 3:45 PM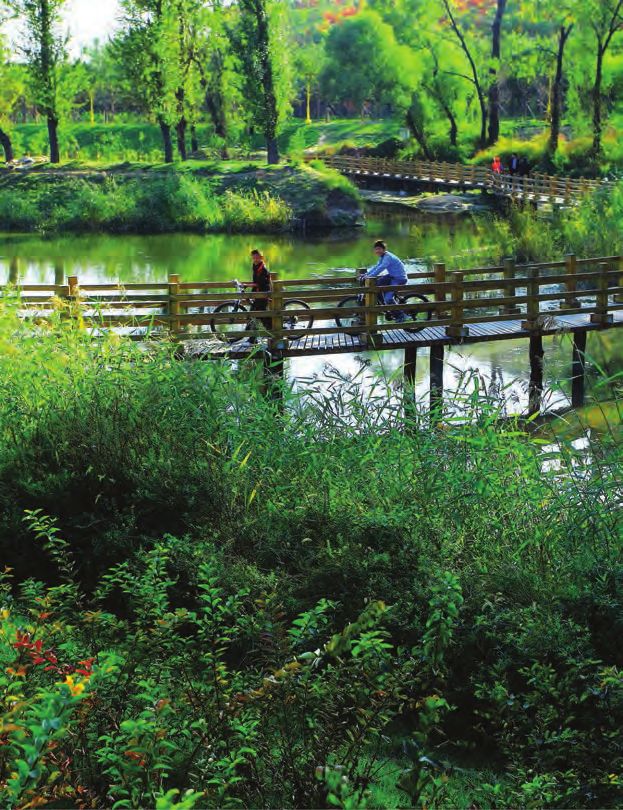
Intersections
              Health and the Built Environment

Intersections-2013.indb 1                        10/21/13 5:02 PM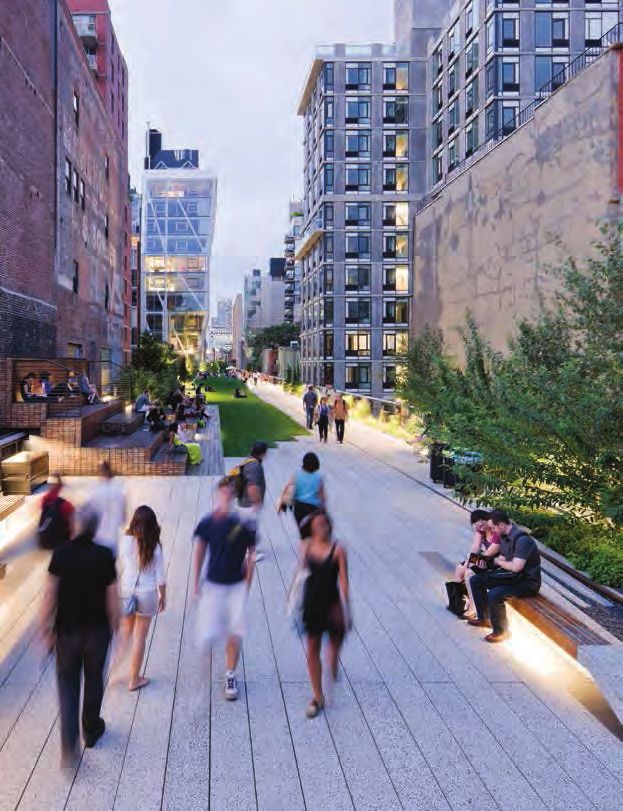
About the Urban Land Institute
                                 The Urban Land Institute is a nonprofit research and education
                                 organization whose mission is to provide leadership in the respon-
                                 sible use of land and in creating and sustaining thriving communities
                                 worldwide.
                                 The Institute maintains a membership representing a broad spec-
                                 trum of interests and sponsors a wide variety of educational pro-
                                 grams and forums to encourage an open exchange of ideas and
                                 sharing of experience. ULI initiates research that anticipates emerg-
                                 ing land use trends and issues, provides advisory services, and
                                 publishes a wide variety of materials to disseminate information on
                                 land use development.
                                 Established in 1936, the Institute today has nearly 30,000 members
                                 and associates from some 92 countries, representing the entire
                                 spectrum of the land use and development disciplines. Professionals
                                 represented include developers, builders, property owners, inves-
                                 tors, architects, public officials, planners, real estate brokers, ap-
                                 praisers, attorneys, engineers, financiers, academics, students, and
                                 librarians.
                                 ULI relies heavily on the experience of its members. It is through
                                 member involvement and information resources that ULI has been
                                 able to set standards of excellence in development practice. The
                                 Institute is recognized internationally as one of America’s most re-
                                 spected and widely quoted sources of objective information on urban
                                 planning, growth, and development.

                                 © 2013 by the Urban Land Institute
                                 Printed in the United States of America. All rights reserved.

                                 Recommended bibliographical listing:
                                 Urban Land Institute. Intersections: Health and the Built Environment. Washington, D.C.: Urban Land
                                 Institute, 2013.

                                 ISBN: 978-0-87420-282-3

    ii   Intersections: Health and the Built Environment

Intersections-2013.indb 2                                                                                                              10/21/13 5:02 PM
About the Building Healthy Places Initiative
                            Around the world, communities face pressing health challenges re-
                            lated to the built environment. For many years, ULI and its members
                            have been active players in discussions and projects that make the
                            link between human health and development; we know that health is
                            a core component of thriving communities.
                            In January 2013, ULI’s Board of Directors approved a focus on healthy
                            communities as a two-year cross-disciplinary theme for the organization.
                            Through the Building Healthy Places Initiative, ULI is leveraging the
                            power of its global networks to shape projects and places in ways
                            that improve the health of people and communities. The organiza-
                            tion is focusing on four main areas of impact:
                            ●●   Awareness. Raise awareness of the connections between health
                                 and the built environment in the real estate community, working
                                 to ensure that health is a mainstream consideration.
                            ●●   Tools. Develop or share tools—including best practices, criteria,
                                 and other materials—that define and advance approaches to
                                 healthy buildings, projects, and communities.
                            ●●   Value. Build understanding of the market and nonmarket factors
                                 at play in building healthy places, and the value proposition of
                                 building and operating in health-promoting ways.
                            ●●   Commitments. Gain commitments from members and others,
                                 including local governments, to work, build, and operate in more
                                 health-promoting ways.
                            Learn more and connect: http://www.uli.org/health.
                            Share your story via Twitter: #ulihealth.

                            About This Report
                            Intersections: Health and the Built Environment explores the relation-
                            ship between how healthy we are and the way our buildings and
                            communities function. We can build our way to better health, it pro-
                            poses, by changing our approach to cities, communities, and places.
                            As real estate leaders and stewards of the built environment, we can
                            do more to improve lives and foster healthy outcomes. And along the
                            way, we can create places of enduring value.

                                                                             Intersections: Health and the Built Environment   iii

Intersections-2013.indb 3                                                                                               10/21/13 5:02 PM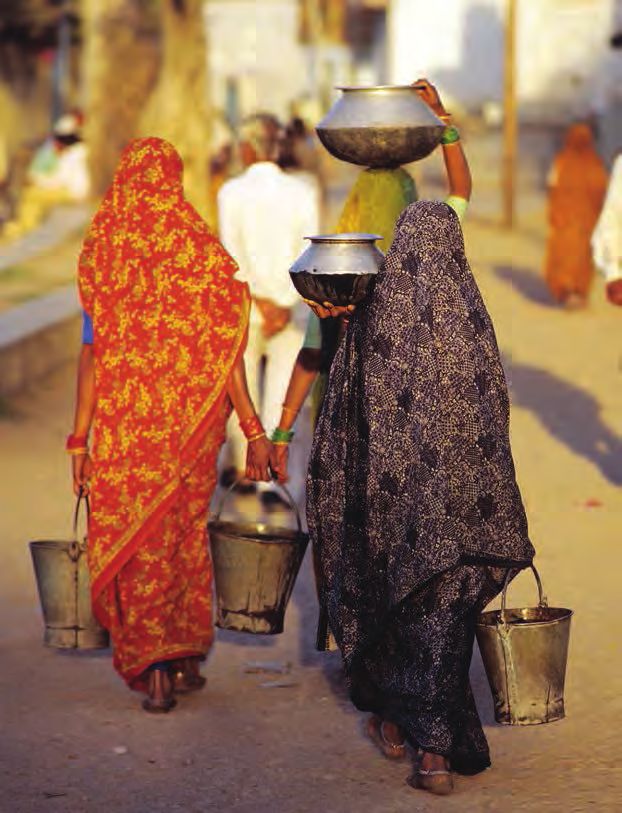
ULI Senior Executives                          ULI Project Staff
                                 Patrick Phillips                               Rachel MacCleery
                                 Chief Executive Officer                        Senior Vice President, Content
                                 Cheryl Cummins                                 Sara Hammerschmidt
                                 Executive Officer                              Associate, Content
                                 Michael Terseck                                Basil Hallberg
                                 Chief Financial Officer/Chief Administrative   Senior Research Associate
                                   Officer                                      Ed McMahon
                                 Joe Montgomery                                 Senior Resident Fellow, Environment
                                 Chief Executive, Europe                        Maureen McAvey
                                 David Howard                                   Senior Resident Fellow, Retail
                                 Executive Vice President, Development and      Sarah Jo Peterson
                                   ULI Foundation                               Senior Policy Director
                                 Kathleen Carey                                 James Mulligan
                                 Executive Vice President/Chief Content         Managing Editor
                                   Officer
                                                                                Joanne Platt
                                 Lela Agnew                                     Publications Professionals LLC
                                 Executive Vice President, Communications       Manuscript Editor
                                 Marilee Utter                                  Betsy VanBuskirk
                                 Executive Vice President, District Councils    Creative Director

                                 Principal Author                               Deanna Pineda
                                                                                Muse Advertising Design
                                 Kathleen McCormick                             Graphic Designer
                                 Fountainhead Communications LLC
                                                                                Craig Chapman
                                 Boulder, Colorado
                                                                                Senior Director
                                                                                Publishing Operations
                                 Contributing Authors
                                 Rachel MacCleery
                                 Senior Vice President, Content
                                 Sara Hammerschmidt
                                 Associate, Content

    iv    Intersections: Health and the Built Environment

Intersections-2013.indb 4                                                                                             10/21/13 5:02 PM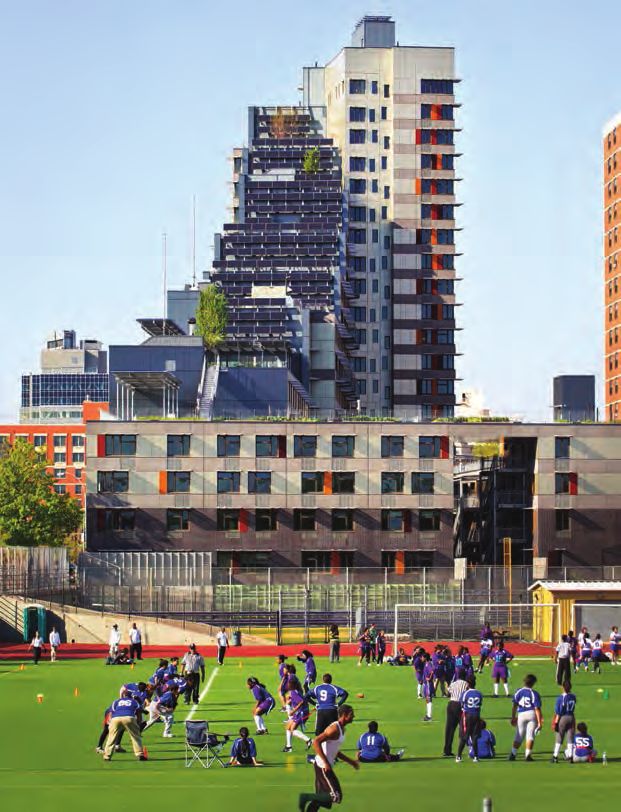
Cover Letter
               Dear Reader,
               The built environment is part of the health problem. But it is also part of the solution.
               That is the main message of Intersections: Health and the Built Environment, an important new
               report from ULI. As the world grapples with a host of health problems—including the growing
               toll of chronic disease, air and water pollution, and surging health care costs—we, the de-
               velopers, builders, designers, and financiers of the built environment, are being looked to for
               solutions.
               We know a lot about how to craft cities, communities, and projects that help foster healthier
               outcomes for people. Opportunities for active transportation, accessible and attractive stair-
               cases, proximity to nature and transit—all have been shown to improve health. And by re-
               sponding to market demands, healthy places also help generate economic value. We know
               that health is a core component of thriving communities.
               But there is still a lot we can learn. And when it comes to public health, there are many un-
               tapped opportunities to do more. That is why ULI has launched the Building Healthy Places
               Initiative, which will leverage the power of ULI’s global networks to shape projects and places
               in ways that improve the health of people and communities.
               Over the course of the initiative, public health topics will be threaded through ULI’s conven-
               ings, publications, research, partnerships, and conversations. We will be sharing stories about
               innovative projects and approaches, learning from each other and from experts in the field,
               and seeking to advance understanding of what works when it comes to health.
               We can build our way to better health. ULI members are in the business of improving the
               places in which we live our lives. Through a better understanding of the complex health chal-
               lenges we face, and through putting our knowledge into practice in the decisions we make as
               stewards of the built environment, we can promote health—one project, and one community,
               at a time.

               Lynn Thurber                           Patrick Phillips
               Urban Land Institute Chairman          Urban Land Institute Chief Executive Officer

                                                                                            Intersections: Health and the Built Environment   v

Intersections-2013.indb 5                                                                                                             10/21/13 5:02 PM
Contents
Chapter 1: We Can Build Our Way to Better Health . . . . . . . . . . . . . . . . . . . . . . . . 2
ULI Leadership for Healthy Places . . . . . . . . . . . . . . . . . . . . . . . . . . . . . . . . . . . . . . . . . . . . . . . 5
U.S. Health Trends: Troubling Directions . . . . . . . . . . . . . . . . . . . . . . . . . . . . . . . . . . . . . . . . . . 6
Health and Income . . . . . . . . . . . . . . . . . . . . . . . . . . . . . . . . . . . . . . . . . . . . . . . . . . . . . . . . . . . . . 8
The Healthy Place Opportunity . . . . . . . . . . . . . . . . . . . . . . . . . . . . . . . . . . . . . . . . . . . . . . . . . . 11
Chapter 2: Moving in the Wrong Direction? Global Health Trends . . . . . . . 12
The Rise of Chronic Disease . . . . . . . . . . . . . . . . . . . . . . . . . . . . . . . . . . . . . . . . . . . . . . . . . . . . 14
Trends Influencing Health . . . . . . . . . . . . . . . . . . . . . . . . . . . . . . . . . . . . . . . . . . . . . . . . . . . . . 16
A Path Forward . . . . . . . . . . . . . . . . . . . . . . . . . . . . . . . . . . . . . . . . . . . . . . . . . . . . . . . . . . . . . 23
Chapter 3: Better Health through Community Design . . . . . . . . . . . . . . . . . . . . 24
Smart Growth: Building toward Health and Saving Money . . . . . . . . . . . . . . . . . . . . . . . . . . . 26
The Power of Parks and Trails . . . . . . . . . . . . . . . . . . . . . . . . . . . . . . . . . . . . . . . . . . . . . . . . . . 29
Aging in Place: It Never Gets Old . . . . . . . . . . . . . . . . . . . . . . . . . . . . . . . . . . . . . . . . . . . . . . . . 31
School’s (Too Far) Out . . . . . . . . . . . . . . . . . . . . . . . . . . . . . . . . . . . . . . . . . . . . . . . . . . . . . . . . . 32
Chapter 4: Active Transportation . . . . . . . . . . . . . . . . . . . . . . . . . . . . . . . . . . . . . . . . . . 34
Transportation That Gets Us Moving . . . . . . . . . . . . . . . . . . . . . . . . . . . . . . . . . . . . . . . . . . . . . 36
Complete Streets: A Safe Bet . . . . . . . . . . . . . . . . . . . . . . . . . . . . . . . . . . . . . . . . . . . . . . . . . . . 43
Shared Cars and Car-Free Zones . . . . . . . . . . . . . . . . . . . . . . . . . . . . . . . . . . . . . . . . . . . . . . . 43
Slimming Down Parking . . . . . . . . . . . . . . . . . . . . . . . . . . . . . . . . . . . . . . . . . . . . . . . . . . . . . . . 44
Chapter 5: Healthy Buildings, Healthy People . . . . . . . . . . . . . . . . . . . . . . . . . . . . 46
Location Choices . . . . . . . . . . . . . . . . . . . . . . . . . . . . . . . . . . . . . . . . . . . . . . . . . . . . . . . . . . . . . 48
Greener, Healthier Buildings . . . . . . . . . . . . . . . . . . . . . . . . . . . . . . . . . . . . . . . . . . . . . . . . . . . 48
Designing for Active Living . . . . . . . . . . . . . . . . . . . . . . . . . . . . . . . . . . . . . . . . . . . . . . . . . . . . . 52
Reworking Workplaces . . . . . . . . . . . . . . . . . . . . . . . . . . . . . . . . . . . . . . . . . . . . . . . . . . . . . . . 53
Healthy Learning Environments . . . . . . . . . . . . . . . . . . . . . . . . . . . . . . . . . . . . . . . . . . . . . . . . 53
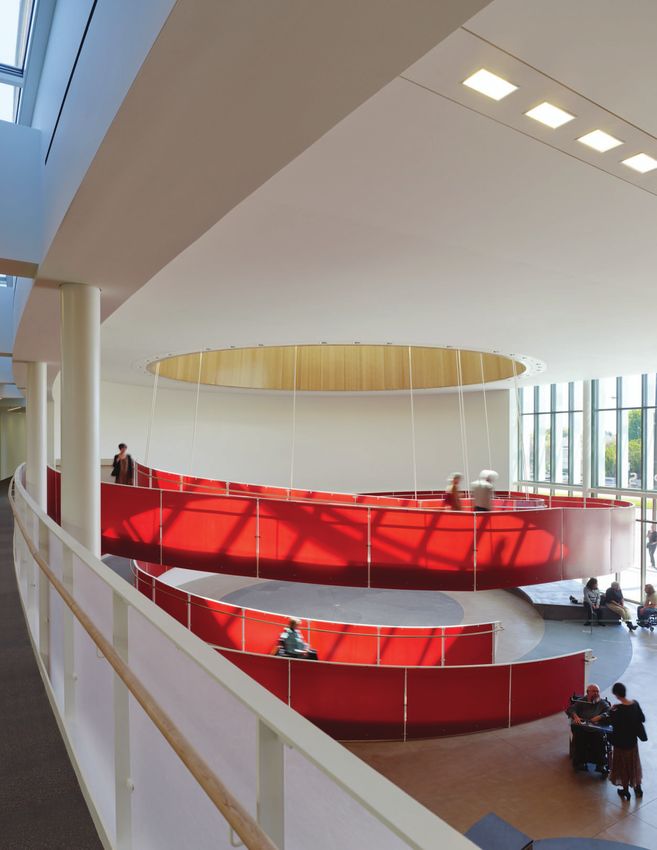
Health Care Facilities . . . . . . . . . . . . . . . . . . . . . . . . . . . . . . . . . . . . . . . . . . . . . . . . . . . . . . . . . 55
vi Contents
Intersections-2013.indb 6 10/21/13 5:02 PM
Chapter 6: Access to Healthy Food . . . . . . . . . . . . . . . . . . . . . . . . . . . . . . . . . . . . . . . . 56
                    Crossing the Food Desert: Grocery Stores . . . . . . . . . . . . . . . . . . . . . . . . . . . . . . . . . . . . . . . . 59
                    Urban Agriculture . . . . . . . . . . . . . . . . . . . . . . . . . . . . . . . . . . . . . . . . . . . . . . . . . . . . . . . . . . . . 63

               Chapter 7: Clear Air, Clean Water . . . . . . . . . . . . . . . . . . . . . . . . . . . . . . . . . . . . . . . . . . 64
                    Air Quality . . . . . . . . . . . . . . . . . . . . . . . . . . . . . . . . . . . . . . . . . . . . . . . . . . . . . . . . . . . . . . . . . . . 65
                    Water for Life . . . . . . . . . . . . . . . . . . . . . . . . . . . . . . . . . . . . . . . . . . . . . . . . . . . . . . . . . . . . . . . . 68
                    Green Infrastructure . . . . . . . . . . . . . . . . . . . . . . . . . . . . . . . . . . . . . . . . . . . . . . . . . . . . . . . . . . 71

               Adding It All Up: Elements of Healthy Development  . . . . . . . . . . . . . . . . . . . . . 74

                                                                                                                                    Intersections: Health and the Built Environment   vii

Intersections-2013.indb 7                                                                                                                                                       10/21/13 5:02 PM
Information Boxes
         Projects That Work for Health                                                        Protected Two-Way Bike Lanes in Chicago, Illinois . 39

              Via Verde, South Bronx, New York . . . . . . . . . . . . . . . . 9              Biking in Copenhagen, Portland, and Hangzhou  . . . 40

              Heartlands, Cornwall, England . . . . . . . . . . . . . . . . . 17              Global Programs for Sustainable and Healthy
                                                                                              Buildings and Communities . . . . . . . . . . . . . . . . . . . . 48
              Mueller, Austin, Texas  . . . . . . . . . . . . . . . . . . . . . . . . 25
                                                                                              Active Design Guidelines for Buildings . . . . . . . . . . . 52
              Mariposa, Denver, Colorado  . . . . . . . . . . . . . . . . . . . 28
                                                                                              Urban Farming, Detroit, Michigan . . . . . . . . . . . . . . . 57
              The Uptown, Oakland, California  . . . . . . . . . . . . . . . . 38
                                                                                              Fresh Food Retailer Initiative,
              HGST Campus, San Jose, California . . . . . . . . . . . . . 44
                                                                                              New Orleans, Louisiana  . . . . . . . . . . . . . . . . . . . . . . . 59
              The Bullitt Center, Seattle, Washington  . . . . . . . . . . 49
                                                                                              Healthy Food Chain, Boulder, Colorado . . . . . . . . . . 60
              Googleplex, Mountain View, California  . . . . . . . . . . . 54
                                                                                              Urban Gardens, Cape Town, South Africa . . . . . . . . . 63
              Alder Hey Children’s Health Park,
                                                                                              Clearing the Air in Mexico City, Mexico . . . . . . . . . . . 68
              Liverpool, England . . . . . . . . . . . . . . . . . . . . . . . . . . . 55
                                                                                              Community Sanitation Blocks, Mumbai, India . . . . . 69
              Union Market, Washington, D.C. . . . . . . . . . . . . . . . . . 60
                                                                                              Watershed Management Group and Tucson’s
              Willowsford, Loudoun County, Virginia . . . . . . . . . . . 61
                                                                                              Green Streets Policy . . . . . . . . . . . . . . . . . . . . . . . . . . 71
              Silver City Townhomes, Milwaukee, Wisconsin  . . . . 73
              Public Utilities Commission Headquarters,                                     Insights from the Experts
              San Francisco, California . . . . . . . . . . . . . . . . . . . . . . 73        Jonathan Rose, President, Jonathan Rose
                                                                                              Companies LLC . . . . . . . . . . . . . . . . . . . . . . . . . . . . . . 10
         Innovations in Health
                                                                                              Dr. Richard Jackson, Chair, Department
              U.S. Cities Invest in Infrastructure for Health  . . . . . . 4                  of Environmental Health Sciences, University of
              Colorado Health Foundation and                                                  California, Los Angeles . . . . . . . . . . . . . . . . . . . . . . . . 33
              Colorado Communities . . . . . . . . . . . . . . . . . . . . . . . . . 7        Bert Gregory, Chairman and CEO, Mithun  . . . . . . . . 51
              Upwardly Mobile Medellín, Colombia  . . . . . . . . . . . . 13                  Simon Ng, Head of Transport and Sustainability
              Augustenborg EcoDistrict, Malmö, Sweden . . . . . . . 23                        Research, Civic Exchange, Hong Kong . . . . . . . . . . . 67
              ULI’s Ten Principles for Building Healthy Places . . . 27
              Being Intentional about Health Outcomes . . . . . . . . . 29
              Blue Zones Project, Albert Lea, Minnesota  . . . . . . . 29
              International Development Banks:
              $175 Billion for Active Transportation . . . . . . . . . . . . 35
              Active Design Guidelines for Communities . . . . . . . . 37

    viii Contents

Intersections-2013.indb 8                                                                                                                                                    10/21/13 5:02 PM
Acronyms
               APTA         American Public Transportation Association
               BREEAM       Building Research Establishment Environmental Assessment Method
               BRT          bus rapid transit
               CSA          community-supported agriculture
               CSO          combined sewer overflow
               EPA          Environmental Protection Agency
               GDP          gross domestic product
               HDMT         Healthy Development Measurement Tool
               HIA          Health Impact Assessment
               LEED         Leadership in Energy and Environmental Design
               LEED-ND      Leadership in Energy and Environmental Design for Neighborhood Development
               MDB          multilateral development bank
               STAR         Sustainability Tools for Assessing and Rating
               VMT          vehicle miles traveled
               VOC          volatile organic compound

                                                                                    Intersections: Health and the Built Environment   1

Intersections-2013.indb 1                                                                                                      10/21/13 5:02 PM
1 We Can Build Our Way
Chapter
to Better Health
Children play soccer on a field adjacent to the Via
Verde housing complex in the South Bronx, New York.
(Jonathan Rose Companies)
2 Chapter 1: We Can Build Our Way to Better Health
Intersections-2013.indb 2 10/21/13 5:02 PMI n the 21st century, as the world meets the demands of population growth,
increasing urban development, and climate change, we face new challenges
in public health. Public health is no longer solely the business of health profes-
sionals: public officials, urban planners, transportation decision makers, archi-
tects, landscape architects, builders, and real estate developers all have a role
to play in addressing public health challenges.
Many of today’s health challenges are global megatrend that is making us rethink
driven by chronic or “lifestyle” diseases, land use and transportation patterns. Health
including cardiovascular and respiratory is becoming a competitive advantage or dis-
diseases, type 2 diabetes, and cancer. These advantage for cities.
diseases now cause nearly two-thirds of With this shift, market opportunities are
deaths worldwide each year. By 2030, chronic emerging to change the way we design and
diseases will cause 52 million global deaths build so that we support healthy living and
per year, nearly five times the number of vibrant economies. Like demographics, op-
deaths from communicable diseases. portunities to be healthy are influencing what
Epidemic rates of chronic disease have people want in their homes, workplaces,
become a drag on the economies and futures schools, public spaces, and communities.
of families, communities, nations, and whole People care about their health. So what does
regions. The growing cost of health care is a that add up to for real estate?
Health is a state of complete physical,
What Is a Healthy Place? mental, and social well-being and not
ULI believes that healthy places are designed, merely the absence of disease or infirmity.
built, and programmed to support the physi-
cal, mental, and social well-being of the —World Health Organization
people who live, work, learn, and visit there.
Healthy places
●● offer healthy and affordable housing op-
tions, and a variety of safe, comfortable,
and convenient transportation choices;
●● provide access to healthy foods, the natural
environment, and other amenities that
allow people to reach their full potential;
●● are designed thoughtfully, with an eye to
making the healthy choice the easy choice,
and they are built using health-promoting
materials; and
●● address unique community issues with
innovative and sustainable solutions.
Benches on the Calligraphy Greenway in Taichung,
Taiwan, provide respite for visitors. (AECOM)
Intersections: Health and the Built Environment 3
Intersections-2013.indb 3 10/21/13 5:02 PMInnovations in Health
U.S. Cities Invest in Infrastructure for Health
Campaigns by U.S. cities to encourage exercise to combat obesity
include the following:
Oklahoma City, Oklahoma. Worried that major companies were
bypassing his city because of its health issues, Oklahoma City’s mayor
Mick Cornett challenged city residents in 2008 to lose 1 million pounds. Market demands from millennials and baby
Cornett contributed to the goal by losing 43 pounds himself. The “This boomers are helping usher in active-living
City Is Going on a Diet” campaign was backed with investments in trails urban development. Millennials in particular
and programs that linked parks and recreation facilities.
express strong preferences for more compact,
The city has also made a series of health-promoting investments in
walkable, mixed-use, and mixed-income com-
its downtown. The latest set of improvements are funded by a one-cent
sales tax increase, which is channeling $777 million into a 70-acre munities. They want amenities like storage for
central park, 57 miles of new multiuse trails, and recreation upgrades exercise equipment within buildings and easy
for the Oklahoma River. access to parks and open space.
Atlanta, Georgia. Atlanta’s BeltLine is a revitalization and active- Overwhelmingly, baby boomers and older
community project with an ambitious set of physical activity–promoting people want to age in place. They want housing
amenities like public parks, multiuse trails, and transportation options. and communities that can meet their needs as
The BeltLine reuses 22 miles of historic railroad corridors circling down- they grow older. And across the generations,
town Atlanta and connects 45 neighborhoods to each other and to the
demand is strong for communities with transit
entire Atlanta region through enhanced transit offerings.
and other elements that support active living.
When completed, the project will have
developed 33 miles of multiuse trails, 1,300
acres of parks, and 5,600 units of affordable
housing.
Tax allocation district funding that
anchors the 25-year financial plan has
provided $120 million since 2005. An addi-
tional $179.5 million has been invested from
private and local government sources.
Atlanta Mayor Kasim Reed inaugurates the
BeltLine’s Eastside Trail in October 2012 with
a community bike ride. (Christopher T. Martin)
Living and Working Conditions in Homes and Communities Influence Health
Factors influencing health
Economic and social
opportunities and resources
Living and working
conditions in homes and communities
Medical Personal
care behavior
Interactions between genes and our experiences
HEALTH
Source: Robert Wood Johnson Foundation.
4 Chapter 1: We Can Build Our Way to Better Health
Intersections-2013.indb 4 10/21/13 5:02 PMHealth presents a market opportunity for Professionals involved in land use have a
forward-thinking developers and real estate powerful role to play in creating healthy places.
leaders, and the market presents an oppor- ULI members can lead in building healthier
tunity to help shape communities in health- environments in the following ways:
promoting ways. ●● Through their organizations, by following
Research points to how buildings, roads, principles of planning, design, and construc-
and neighborhood design affect human health. tion that incorporate healthy and sustainable
When devising strategies for the built environ- practices, and by setting an example with
ment to improve health, we can also draw healthy work environments and policies that
from decades of work on smart growth—many encourage fitness and healthy eating;
smart-growth approaches for the design, con- ●● As a fundamental consideration in de-
struction, management, and programming of velopment projects, by incorporating
communities also work for health. elements that enhance health and the en-
vironment, such as selecting development
ULI Leadership for sites with public transit access; building
in compact ways, including amenities
Healthy Places that promote healthy lifestyles; and using
healthy building materials; and
For many years, ULI and its members have ●● Through their influence on policy, by work-
been active players in discussions and projects ing with local and national governments, re-
that make the link between human health and gional transportation agencies, foundations
development; we know that health is a core and community groups, and business, health
component of thriving communities. Through care, education, and civic leaders to create
the Building Healthy Places Initiative, ULI is land use, zoning, and building frameworks
leveraging the power of its global networks to that are conducive to healthy lives.
shape projects and places in ways that im-
The good news is that the real estate
prove the health of people and communities.
industry is getting on board. A summer 2013
ULI Members Agree That Health and the Built Environment Are Linked
Responses to ULI member survey conducted in July 2013
Human health and the The real estate industry has The degree to which a project or place
built environment are an important role to play in efforts supports health and wellness can affect
inextricably linked. to promote health and wellness. its market success and/or economic value.
4% 1% 4%1% 8%
35% 1%
49% 56%
47% 36%
60% Strongly agree
Agree
Disagree
Strongly disagree
Source: Urban Land Institute.
Intersections: Health and the Built Environment 5
Intersections-2013.indb 5 10/21/13 5:02 PMU.S. Obesity Rates Increased Dramatically between 1990
and 2010
Obesity trends among U.S. adults
Percentage of adults who are obese, by state No data
(Body mass index of 30 kg/m2 or more,
or about 30 pounds overweight for a personInnovations in Health
Colorado Health Foundation and
Colorado Communities
Colorado is a magnet for millennials and others drawn by the natural
environment and active lifestyle, which in turn produce economic
benefits for the state: bicycling, for example, pumps over $1 billion
ity is directed toward treating disease. These into state coffers.
expenses have the potential to squeeze out In 2009, however, Colorado spent $1.6 billion treating conditions
spending on more productive endeavors. related to obesity. Reflecting rising obesity rates across the nation,
Here are some disturbing U.S. statistics: some 21 percent of Colorado’s adults and 14 percent of its children
●● Health care expenditures—a projected $3
are obese.
The Colorado Health Foundation, supported by a $2.2 billion
trillion in 2014—will consume 19 percent
endowment, is trying to reverse this trend to make Colorado “the
of the nation’s gross domestic product by
healthiest state in the nation.” The foundation supports projects such
2020, according to federal projections. as Mariposa, a healthy affordable-housing community in Denver.
●● Three-quarters of U.S. health care spend- To reinforce the connection between a healthy built environment
ing goes toward treating chronic diseases. and economic development, the foundation partnered with ULI to
●● Health care will require an investment conduct Advisory Services panels in three Colorado communities, the
of over $9,000 per person in 2014, more first step in an extended engagement process between the foundation
than any other country. The lives of U.S. and the communities aimed at increasing physical activity and foster-
residents, however, are nearly five years ing healthy outcomes among residents.
shorter than what would be expected with
such a high level of expenditure.
●● The U.S. adult obesity rate, now affecting
one in three adults, could reach 43 percent
by 2018, generating $344 billion annually in
health care costs related to type 2 diabe-
tes, hypertension, and related diseases.
Can we turn the tide on these troubling
health trends? It will be a daunting task. But
the success of the U.S. campaign against
tobacco over the past four decades—smoking
has declined in use from 37 percent of adults
to 19 percent—inspires those working to bend The Advisory Services panels in Colorado recommended strategies
the arc of U.S. health trends. to foster active living in three communities.
Health Care Expenditures Are Claiming a Larger and Larger Share of U.S. GDP
U.S. national health expenditures as a percentage of gross domestic product, by decade
20% 19%
18%
15% 14%
13%
10% 9%
7%
5%
5%
0%
1960 1970 1980 1990 2000 2010 2020
(PROJECTED)
Source: U.S. Centers for Medicare & Medicaid Services, Office of the Actuary.
Note: The projection for 2020 includes impacts of the Affordable Care Act.
Intersections: Health and the Built Environment 7
Intersections-2013.indb 7 10/21/13 5:02 PMTo work, efforts must be comprehen-
By the Numbers sive and must focus not just on health care
delivery but on all the forces shaping health,
including the built environment.
Chronic Health Concerns and Children
1in3 Share of U.S. children
considered overweight
or obese
Health and Income
Household income levels, educational attain-
500%
ment, and race are important factors in the
Increase in fast food health picture. Although the built environ-
consumption among
U.S. children since 1970 ment is not the whole story here, it is part of
the story. Higher incomes can translate into
5
better access to nutritious food, safe neigh-
Number of years by which obesity
threatens to shorten the lives of borhoods, recreational opportunities, and
U.S. children other elements of healthy lifestyles.
13 million
Life expectancy, infant mortality, child
Number of and adult health, and other indicators are
missed U.S. all affected by income, education, and racial
school days each
year due to asthma-related illnesses background. Efforts to ensure that all people
live in health-promoting communities, with
Sources: American Institute of Architects; Boston Children’s
Hospital; U.S. Department of Health and Human Services; U.S. access to healthy food, safe streets, high-
Environmental Protection Agency.
quality parks, and stable and healthy housing,
as well as pursuit of other strategies dis-
cussed in this report, can help address and
alleviate these disparities.
Health Outcomes Vary across Income Levels and by Racial and Ethnic Group
Percentage of U.S. adults in poor or fair health (age-adjusted)
32% 30.9%
24%
21.2% 20.8%
19.2%
16% 14.0%
11.4%
10.1%
8% 6.6%
0%
400 BLACK, HISPANIC WHITE,
NON-HISPANIC NON-HISPANIC
Family income (percentage of federal poverty level) Racial or ethnic group
Source: Robert Wood Johnson Foundation.
8 Chapter 1: We Can Build Our Way to Better Health
Intersections-2013.indb 8 10/21/13 5:02 PMProjects That Work for Health
Via Verde, South Bronx, New York
Jonathan Rose Companies LLC, a New York–based multidisciplinary
planning and development firm, is noted for holistic projects that em-
body aspects of healthy living. A recent project, Via Verde/The Green
Way, won the New Housing New York Legacy Competition and ULI’s
Jack Kemp Workforce Housing Models of Excellence Award.
The $98 million Via Verde, codeveloped with Phipps Houses and
designed by the partnership of Dattner Architects and Grimshaw,
features 294,000 square feet of mixed-use construction on 1.5 acres
close to transit. Completed in 2012, the project has 222 mixed-
income rental and co-op residential units, 7,500 square feet of retail
and community facility space, and 40,000 square feet of green roofs
and open space.
At its heart is a garden that serves as the organizing element and
spiritual identity for the community. The green roofs and open space,
located on connected low-rise townhomes, a mid-rise duplex build-
ing, and a 20-story tower, are used to harvest rainwater and grow
fruits and vegetables. The LEED Gold project features other healthy
living amenities, such as open-air courtyards, a health education and
The courtyard at the Station Center housing complex in wellness center, a community medical clinic, a fitness center, and
Union City, California, includes community gardens and bicycle storage.
a play area. (Bruce Damonte)
By the Numbers
The Built Environment and Physical Activity
67% Percentage of the
U.S. workforce that is
overweight or obese
47%
Increased likelihood that
people who live in neigh-
borhoods with sidewalks
get at least 30 minutes of
exercise per day
50%
Increased likelihood that
Rooftop vegetable gardens can be found at the Via Verde housing complex in
people who live near trails
meet physical activity the South Bronx, New York. (Jonathan Rose Companies)
guidelines
Sources: Public Health Institute; Active Living Research.
Intersections: Health and the Built Environment 9
Intersections-2013.indb 9 10/21/13 5:02 PMInsights from the Experts
Jonathan Rose, President, Jonathan Rose has advanced these principles for
low-income communities, but they
Companies LLC really apply to all communities—urban, subur-
Jonathan F.P. Rose, president of ban, rural—and at all economic levels.
Jonathan Rose Companies LLC, has
built a reputation for thinking outside Q: What specifically can ULI members do to im-
the box to develop holistic projects that prove the health of the built environment?
embody principles of diversity, environ- A: They can start by building healthier, greener,
mental responsibility, livelihood, and more diverse communities in the right loca-
interdependence. tions: connected places served by existing in-
frastructure and community resources. Human
Q: What are the key elements of a healthy health is dependent on a healthy natural envi-
community? ronment, and so it’s essential that we reduce
A: A healthy community begins with the environmental impact of development. If we
housing, which is the platform for physi- don’t, the outcome is the extraordinary pollution
cal, cognitive, and social health. But we evident in cities such as Guangzhou and Beijing.
also need to recognize that a community The internal environment of our buildings must
is more than a building—it includes its also be healthy, with clean fresh air, daylight,
context. Communities of opportunity healthy building materials, and reduced energy
include both the physical and social consumption. Taken together, making build-
infrastructure for well-being, including mul- ings and citywide environments healthier will
tiple transportation options; safe, affordable, improve well-being.
healthy, and green housing; affordable healthy
food; access to health care, jobs, education and Q: What should ULI members consider about
training, and social and physical connections; return on investment for healthy communities?
and culture. Enterprise Community Partners A: In our experience, green, walkable, mixed-
income, mixed-use communities like Highlands’
Garden Village in Denver are increasingly what
the market is looking for. Projects that fail to
In our experience, green, walk- address these market drivers are more likely
able, mixed-income, mixed-use to underperform. We’re seeing emerging new
standards of best practice for green and healthy
communities like Highlands’ projects. In our experience, healthier communi-
Garden Village in Denver are ties have lower turnover and higher occupancy.
Many of these strategies do not cost more, but
increasingly what the market is just take more time to think through, using
looking for. integrated design and planning. They may cost
more on the infrastructure side, but that is
—Jonathan Rose
balanced by cost savings in social services and
health care.
10 Chapter 1: We Can Build Our Way to Better Health
Intersections-2013.indb 10 10/21/13 5:02 PMThe Healthy Place
Opportunity
Thinking about the relationship between
health and the built environment is not new.
In the 19th and 20th centuries, architects
and planners in London, New York, and Paris
joined with public health professionals and
social reformers to reduce infectious dis-
eases by designing buildings, streets, parks,
neighborhoods, and clean water systems to
improve health.
Now, the built environment is once again
an important part of the solution to today’s
public health crisis. ULI members are helping
create active, green, and sustainable environ-
ments that are healthy for people and that
add value to real estate.
As the ULI member survey shows, many
ULI members understand that the design
and programming of a neighborhood or
building affect both its health and its value.
Demographic trends, including the preferen- The new Amazon headquarters in Seattle includes
ces of millennials, baby boomers, and other rain gardens, a green roof, and an exterior green wall.
groups, are driving real estate practice. (Benjamin Benschneider)
Projects and communities that can re-
spond to growing market demands for trans-
portation that supports active lifestyles, for
housing types that allow people to age in
place, and for a mix of uses and other ele-
ments that promote health will see their value
endure over time.
Meeting the demand for healthy living will
require new development features, as well
as investment in strategies that have proven
returns, like parks. What are the emerging
opportunities to meet the needs and desires
of the marketplace and improve health at the
same time? Savvy developers, planners, and
communities will be paying attention.
Intersections: Health and the Built Environment 11
Intersections-2013.indb 11 10/21/13 5:02 PM2 Moving in the Wrong Direction?
Chapter
Global Health Trends
Raised wooden boardwalks through wetland ponds
in Nanhu Eco-City Central Park in Tangshan, China,
increase interactions with plants and wildlife. (Beijing
Tsinghua Tongheng Urban Planning & Design Institute)
12 Chapter 2: Moving in the Wrong Direction? Global Health Trends
Intersections-2013.indb 12 10/21/13 5:02 PMH uman health is affected by many factors, such as the foods we eat, the air
we breathe, the water we drink, and whether we can walk or bike to work or
school. Health is also influenced by such factors as human choice and behavior,
as well as genetics, access to health care, transportation, housing, education,
income, and whether the environment is safe and promotes health.
Half the world’s population now lives in
cities. And although urbanization is gener- Innovations in Health
ally associated with increasing prosperity
and good health, rapid migration from rural Upwardly Mobile Medellín, Colombia
areas and enormous population growth are
In 2012, Medellín was recognized for having one of the best trans-
putting more pressure on infrastructure
portation systems in the world by the Institute for Transportation and
for food, water, housing, health care, open Development Policy, a global consortium for sustainable transporta-
space, and other elements that contribute to tion. The city has come a long way in the 20 years since it was branded
healthy environments. the murder capital of the world.
A major driver of Medellín’s transformation has been an innovative
transportation system that provides access to jobs, educational op-
Medellín, Colombia’s cable car system, opened in 2010,
portunities, and civic and recreational spaces for residents living in the
has revolutionized access and mobility for the city’s
city’s poor hillside favelas, or slums.
poorest residents. (Jess Zimbabwe)
The centerpiece is Metro de
Medellín, a network of clean efficient
train cars that serves over 500,000
passengers daily. Financed by a
public/private partnership, the tran-
sit network includes cable cars and
a 1,263-foot outdoor escalator that
carry favela residents up and down
the steep hillsides, saving hours
of travel time to reach jobs, health
care, schools, and services.
The metro’s transit hubs have
spurred new investment in infra-
structure, services, and ameni-
ties, such as hospitals and police
stations, many integrated into the
metro infrastructure. The transit
system benefits from new connec-
tions with new public green spaces
and pedestrian routes, a public
bike-share program linked to uni-
versities, and a rideshare/carpool
program involving more than 170
institutions.
Intersections: Health and the Built Environment 13
Intersections-2013.indb 13 10/21/13 5:02 PMBy the Numbers
The High Costs of Poor Health
4.3%
Percentage of China’s
GDP spent on health
costs attributed to air
and water pollution
9%
Average percentage Health impacts from the design of the
of GDP spent on built environment are a global concern. Many
health by European
Union countries health challenges are directly related to
transportation choices, land use patterns,
$240 billion
infrastructure, and accessibility. And many
opportunities exist to shift our approaches to
designing and developing buildings, neighbor-
Estimated national income India will hoods, and infrastructure to reverse chronic
forgo between 2005 and 2010 because disease trends and improve public health.
of premature deaths caused by heart
52 million
disease, stroke, and diabetes
Number of lives The Rise of Chronic
that by 2030
will be claimed
each year by chronic disease globally
Disease
Certain chronic diseases that used to affect
Sources: World Bank; Organization for Economic Cooperation
and Development and European Commission; World Health only wealthier populations in the developed
Organization.
world are “spreading” to countries undergo-
ing rapid urban development and the lifestyle
Grass and wooden decking at the Marco Polo Terraces, a new public open space at the HafenCity development in
Hamburg, Germany, invites visitors to stop and rest. (Thomas Hampel/Elbe & Flut)
14 Chapter 2: Moving in the Wrong Direction? Global Health Trends
Intersections-2013.indb 14 10/21/13 5:02 PMBy the Numbers
The High Impact of Chronic Disease
2in3 Share of deaths worldwide
caused by chronic diseases
300%
changes that go with it. Chronic diseases
Increase in the
now outpace infectious diseases in every prevalence of obesity
global region except Africa, where rates are in Europe since
the 1980s
also rising. These diseases are responsible
366 million
for two-thirds of deaths worldwide. By 2030,
chronic disease rates will increase by nearly
50 percent, claiming the lives of 52 million
people. Ischemic heart disease, caused in Projected number of people with diabetes
part by high cholesterol and diabetes, is the worldwide by 2030; 80% are projected to
be living in developing countries
number one cause of death worldwide.
1in3
Global populations are also aging as a
Share of U.S. adults who
result of public health efforts to curb in- are obese—the highest
fectious diseases. Urban populations face rate of obesity in the world
growing environmental threats and changing
lifestyle patterns, such as physical inactivity Sources: World Health Organization; Global Health Policy
Center at the Center for Strategic and International Studies;
and unhealthy habits related to food, alcohol, U.S. Centers for Disease Control and Prevention.
and tobacco.
The Wilmington Waterfront Park near the Port of Los Angeles, California, provides a venue for soccer games. How
to reconcile the impacts of ports with health is a global challenge. (Sasaki Associates)
Intersections: Health and the Built Environment 15
Intersections-2013.indb 15 10/21/13 5:02 PMThe World Is Becoming Increasingly Urban
Urbanization rates
100%
Percentage of urban population
83% 84%
80% 75% 76%
60%
60% 55% 53% 55%
47%
41%
40% 37%
33% 30%
20% 15% 17%
1950 2000 2030 1950 2000 2030 1950 2000 2030 1950 2000 2030 1950 2000 2030
0%
AFRICA ASIA LATIN AMERICA MORE DEVELOPED WORLD
AND THE CARIBBEAN REGIONS
Source: United Nations.
Today, for example, obesity affects one emerging countries such as China and India,
in ten adults globally and one in three adults rapidly growing populations are increas-
in the United States. High obesity rates are ing pressures on the natural resources that
linked to chronic and often lethal conditions, supply energy, food, and water. By 2050, over
including coronary heart disease, type 2 dia- 70 percent of the world’s population will
betes, and certain cancers. Obesity is caused live in cities, according to the World Health
by lifestyle factors, such as the consumption Organization.
of unhealthy or excessive amounts of food Aging. Over one-quarter of the population
and a lack of activity. in the 34 member nations of the Organization
Global obesity rates have doubled since for Economic Cooperation and Development
1980. In the United States, obesity rates have will be over 65 years old in 2050, compared
also increased dramatically: in 1990, no state with 15 percent today. Japan has increased
had an obesity rate greater than 15 percent, average life expectancy to 84 years, and
but by 2010, 12 states had obesity rates nearly one-quarter of its population is already
greater than 30 percent, and none had rates over 65. Countries including Germany, Italy,
of less than 20 percent. and Greece are not far behind. In the United
States, the 65-plus population is expected to
Trends Influencing double to nearly 72 million by 2030.
Environment. Global greenhouse gas
Health emissions are projected to increase by 50
percent between 2005 and 2025, mostly from
Many trends and factors are influencing energy-related carbon dioxide emissions.
health globally. Urban air pollution will likely become the top
Population Growth/Urbanization. Global environmental cause of death worldwide by
population is expected to increase from 2050; by then, natural-land biodiversity is
7 billion today to over 9 billion in 2050. In expected to decrease by 10 percent.
16 Chapter 2: Moving in the Wrong Direction? Global Health Trends
Intersections-2013.indb 16 10/21/13 5:02 PMClimate Change. Climate change–
triggered sea level rise and extreme weather Projects That Work for Health
events are leading to new patterns of migra-
tion and growth and could have a significant Heartlands, Cornwall, England
impact on economic development, food pro-
Heartlands is a £35 million ($55 million) redeveloped mixed-
duction, air quality, water supply and quality,
use residential arts community located in the village of Pool in
sanitation systems, and housing. Buildings Cornwall. Focused on healthy living through redevelopment,
will need greater resiliency in the face of ris- investment, and sustainable design, the 18.5-acre site includes
ing temperatures, wind and water forces, and new artist studios, apartments, a community hall, conference
power failures. facilities, a café/restaurant/bar, and retail shops.
Lifestyle. Diet and exercise are two In 2007, the local council won a lottery to develop a low-carbon
major determinants of health. Improving urban community around a defunct historic mine. An integrated
diets through access to affordable healthy design team led by U.K.-based Buro Happold Ltd engineers with
food and feeding a growing population will Stride Treglown architects restored the granite mine buildings
and turned them into a visitor attraction about the history of
require expansion of agricultural production,
Cornish tin mining. Completed in 2011, the award-winning project
which will increase competition for land. has become a catalyst for economic development, producing over
Inactivity, a major factor in obesity, stems 75 local jobs and attracting more than 240,000 visitors within the
from excessive time spent in cars and in first year.
front of computers, televisions, and digital The community now enjoys active public spaces—a village
media. In Europe, for example, where esti- green, market squares, children’s play areas, and events
mates show that physical inactivity causes arenas—as well as footpaths and bike trails that lead through
1 million deaths annually, only a third of the gardens and green spaces to the countryside.
adult and youth populations are active 30
minutes per day.
Heartlands has trans-
formed a neglected
section of Cornwall,
England, into a tourist
destination, with flex
space for artists and
mixed-income residen-
ces. (David Clapp)
Intersections: Health and the Built Environment 17
Intersections-2013.indb 17 10/21/13 5:02 PMNoncommunicable, Chronic Diseases Are Leading Causes of Death Globally
Data on the Top Ten Global Causes of Death and Other Health Statistics for Selected Countries and Regions
KEY:
240 Global
Deaths per 100,000 people
200 Life expectancy Per capita spending Percentage of GDP
on health spent on health
160
120 102.0 70 $952 10.1%
85.3
80
40 42.1 40.8
22.2 21.3 21.0 19.3 18.6 17.4
0
Ischemic Stroke Chronic Lower Lung HIV/AIDS Diarrheal Road Diabetes Tuberculosis
heart obstructive respiratory cancer diseases injury
disease pulmonary infections
disease
(COPD)
240 240
200 Canada 200 United Kingdom
169.2 178.7
160 81 | $5,630 | 11.2% 160 81 | $3,609 | 9.3%
120 120
96.4
80 80 65.5
57.4 58.0 53.0 59.6
40 39.2 40
25.3 26.6
2.0 8.9 4.3 6.0 11.0
0 1.6 0.5 0 0.5 0.7
Ischemic Stroke COPD Lower Lung HIV/AIDS Diarrheal Road Diabetes Tuberculosis Ischemic Stroke COPD Lower Lung HIV/AIDS Diarrheal Road Diabetes Tuberculosis
heart respiratory cancer diseases injury heart respiratory cancer diseases injury
disease infections disease infections
240 240
200 183.7
United States 200 Spain
160 79 | $8,608 | 17.9% 160 140.6
82 | $3,027 | 9.4%
120 120
96.4
80 80
56.2 50.4 53.3 41.9 43.1
40 27.9 28.1 40 28.4 25.1
3.9 3.1 14.4 2.4 8.9
0 0.4 0 1.5 1.3
Ischemic Stroke COPD Lower Lung HIV/AIDS Diarrheal Road Diabetes Tuberculosis Ischemic Stroke COPD Lower Lung HIV/AIDS Diarrheal Road Diabetes Tuberculosis
heart respiratory cancer diseases injury heart respiratory cancer diseases injury
disease infections disease infections
240 240
200 Mexico 200 France
160 77 | $620 | 6.2% 160 82 | $4,952 | 11.6%
120 120 121.0
80 69.5 80 74.4
47.7 47.4
40 33.2 21.5 40 24.2 31.7
19.2 17.7 8.8 19.6
7.3 4.3 4.1 3.0 1.5 4.2 1.8
0 0
Ischemic Stroke COPD Lower Lung HIV/AIDS Diarrheal Road Diabetes Tuberculosis Ischemic Stroke COPD Lower Lung HIV/AIDS Diarrheal Road Diabetes Tuberculosis
heart respiratory cancer diseases injury heart respiratory cancer diseases injury
disease infections disease infections
18 Chapter 2: Moving in the Wrong Direction? Global Health Trends
Intersections-2013.indb 18 10/21/13 5:03 PM240 237.9 240
200 Germany 200
483.1 304.6
Russia
160 81 | $4,875 | 11.1% 160 69 | $807 | 6.2%
120 120
92.7
80 80
54.4
40
42.0 31.0 40 39.3 34.8
25.3 28.2 22.4 23.6
0.8 4.0 6.6 0.7 3.7 7.0 13.9
0 0
Ischemic Stroke COPD Lower Lung HIV/AIDS Diarrheal Road Diabetes Tuberculosis Ischemic Stroke COPD Lower Lung HIV/AIDS Diarrheal Road Diabetes Tuberculosis
heart respiratory cancer diseases injury heart respiratory cancer diseases injury
disease infections disease infections
240 240
200 China 200 Japan
160 73 | $278 | 5.2% 160 143.4 83 | $3,958 | 9.3%
128.7
120 120 110.9 112.8
80 70.7 69.6 80
58.6
38.3
40
21.1 40 28.3
14.5 2.7 11.9 3.3 2.6 8.0 7.9 4.4
0 0.3 0 0.1
Ischemic Stroke COPD Lower Lung HIV/AIDS Diarrheal Road Diabetes Tuberculosis Ischemic Stroke COPD Lower Lung HIV/AIDS Diarrheal Road Diabetes Tuberculosis
heart respiratory cancer diseases injury heart respiratory cancer diseases injury
disease infections disease infections
240 240
200 India 200 Australia
160 65 | $59 | 3.9% 160 145.6 82 | $5,939 | 9.0%
120 120
92.2
80 74.3 80 65.6
49.5 45.4 48.5 38.5
40 34.6 40 32.7
14.4 22.4 18.3 18.7 18.6
6.7 0.8 0.7 9.4 0.3
0 0
Ischemic Stroke COPD Lower Lung HIV/AIDS Diarrheal Road Diabetes Tuberculosis Ischemic Stroke COPD Lower Lung HIV/AIDS Diarrheal Road Diabetes Tuberculosis
heart respiratory cancer diseases injury heart respiratory cancer diseases injury
disease infections disease infections
240 240
200 Middle East and North Africa 200 Sub-Saharan Africa
160 73 | $370 | 4.8% 160 55 | $95 | 6.4%
120 120 116.2
95.1 89.5
80 80 63.8
59.1
40 28.5 40 38.3 26.9 34.5
18.0 17.1 25.3 14.4
9.8 6.5 2.2 8.2 3.0 8.1 2.3
0 0
Ischemic Stroke COPD Lower Lung HIV/AIDS Diarrheal Road Diabetes Tuberculosis Ischemic Stroke COPD Lower Lung HIV/AIDS Diarrheal Road Diabetes Tuberculosis
heart respiratory cancer diseases injury heart respiratory cancer diseases injury
disease infections disease infections
Sources: Data for deaths per 100,000 people are from the Institute for Health Metrics and Evaluation, University of Washington, “Global Burden of Disease,” 2010. Data for life expectancy,
per capita spending on health, and percentage of GDP spent on health are from World Bank Group, “World Development Indicators,” 2013.
Intersections: Health and the Built Environment 19
Intersections-2013.indb 19 10/21/13 5:03 PMKey Global Health Statistics
Obesity
Percentage of adults who are obese
(body mass index >–30kg/m2)
Age standardized, 2008
30
Data not available or not applicable
Source: World Health Organization, 2011.
Diabetes
Percentage of adults with diabetes
Age standardized, 2012
1.7–8.8
8.9–15.9
16.0–23.1
23.2–30.2
30.3–37.3
Data not available or not applicable
Source: International Diabetes Federation, IDF Diabetes Atlas, 5th edition (Brussels, Belgium: International Diabetes Federation, 2011).
20 Chapter 2: Moving in the Wrong Direction? Global Health Trends
Intersections-2013.indb 20 10/21/13 5:03 PMDeaths from Road Injury
Road traffic deaths per 100,000 people
2010
_
> 10
10.1–20
20.1–30
30.1–40
40.1–70
Data not available or not applicable
Source: World Health Organization, 2013.
Drinking Water
Percentage of population with access
to improved drinking water sources
2011
90
Data not available or not applicable
Source: World Health Organization, 2011.
Intersections: Health and the Built Environment 21
Intersections-2013.indb 21 10/21/13 5:03 PMWater/Sanitary Waste. Global freshwa-
ter demand is projected to increase by 55
percent between 2000 and 2050 as consump-
tion by manufacturing industries, thermal
power plants, and domestic use increases.
Competing demands will put water use by
farmers at risk. More than 240 million people
globally will lack access to clean water by
2050, with 1.4 billion people needing basic
sanitary waste systems.
Road Accidents. Road traffic injuries were
the eighth leading cause of death in 2010 and
are projected to become the fifth leading
cause of death by 2030, with low- and middle-
income countries bearing a greater burden.
Flooding in Hoboken, New Jersey, in the aftermath of Hurricane Sandy affected
water supplies and other infrastructure.
Though these countries account for approxi-
mately half of the world’s vehicles, they make
up over 90 percent of road fatalities.
Road injuries are the eighth leading cause of death globally. Investments in transportation should improve safety
for drivers, pedestrians, and other users of road and transit networks.
22 Chapter 2: Moving in the Wrong Direction? Global Health Trends
Intersections-2013.indb 22 10/21/13 5:03 PMA Path Forward Innovations in Health
The built environment is part of the problem,
but it can also be part of the solution. Augustenborg EcoDistrict, Malmö, Sweden
To meet current health challenges, coun-
The Augustenborg EcoDistrict is an urban community of 3,000 resi-
tries will need the following:
dents that was redeveloped in the late 1990s with green infrastruc-
●● Careful land planning and urban design;
ture, transportation options, and energy-saving measures. Together,
●● Infrastructure investments and expan- these investments have enhanced both the environmental sustainabil-
sions that provide safe, healthy, sustain- ity and health of residents.
able places for people; Investments in Augustenborg included open space, increased
●● Greener buildings to provide healthier waste recycling, and improved stormwater retention. New trans-
interiors and reduce the use of natural portation options—including pedestrian and bike infrastructure, two
resources, such as energy and water; electric trains, and a carpool system with electric vehicles and cars
●● Safer streets and highways, and public
fueled by ethanol and biogas—added opportunities for active mobility
and reduced energy use.
transportation systems with infrastruc-
The project has helped boost local pride and civic engagement
ture for walking, biking, and other active and launch new local businesses, generating jobs. EcoDistricts like
transportation modes; Augustenborg show how communities can make intentional decisions
●● Healthier diets supported by local agricul- to redevelop in healthier, more sustainable ways.
ture and better food supply
and distribution systems;
and
●● Cleaner energy sources to
combat increasing air pollu-
tion, and adequate supplies
of clean water, especially in
emerging countries.
The open stormwater management
system in the Augustenborg district
of Malmö, Sweden, helps alleviate the
city’s flooding. (Scandinavian Green Roof
Institute)
Intersections: Health and the Built Environment 23
Intersections-2013.indb 23 10/21/13 5:03 PM3 Better Health through
Chapter
Community Design
The High Line park on Manhattan’s west side, which
opened in 2009, was built on a historic freight rail line
elevated above the streets. (Iwan Baan)
Intersections-2013.indb 24 10/21/13 5:03 PMD esigning a healthy community—with new development, redevelopment, or
incremental infill—begins with an understanding of how community design
contributes to health.
The Robert Wood Johnson Foundation
notes that physical features, social relation- Healthy places are communities that
ships, and available services and opportuni- are developed, designed, and built to
ties within neighborhoods influence health
in important ways, including by shaping promote good health.
choices and behaviors. Community wellness —U.S. Centers for Disease Control and Prevention
and safety are influenced by neighborhood
factors, such as access to transportation, the
condition of buildings, the presence and qual-
ity of sidewalks and places to play or exercise, Projects That Work for Health
and the density of convenience stores, liquor
stores, and fast-food restaurants relative to Mueller, Austin, Texas
grocery stores that sell fresh foods. Elements such as sidewalks, parks, open space, bike routes, and
Comprehensive community planning alleys, along with diverse uses and destinations, support more
presents an opportunity for planners, de- physical and social activity, according to preliminary results from a
velopers, and residents to address health study of the health impacts of walkable communities. The study was
through zoning ordinances, design guidelines, conducted at Mueller, a community with a plan that received Silver
and capital improvements. Healthy com- certification under the U.S. Green Building Council’s Leadership in
munity changes to comprehensive plans can Energy and Environmental Design for Neighborhood Development
be addressed through amendments, revised (LEED-ND) program.
With an estimated 13,000 residents and 13,000 employees at
codes or ordinances, overlay health plans,
completion, Mueller is being redeveloped by Catellus Development
and stand-alone health-promoting policies. Corporation in a joint project with the city of Austin on the site of the
former Robert Mueller Municipal Airport.
The Texas A&M University study sponsored by
the American Institute of Architects asked resi-
dents to compare their activity levels at Mueller
with their previous activity levels. Nearly three out
of four residents reported more physical activity,
including an average of 48 additional minutes per
week of walking and 90 minutes fewer per week
of traveling in a car. Residents walked more on
neighborhood sidewalks, in parks and on trails,
and along greenways than they did in their previ-
ous neighborhood.
The Mueller development in Austin, Texas, includes
a variety of trails, parks, pools, and sports courts to
encourage residents to be physically active. (Thomas
McConnell Photography)
Intersections: Health and the Built Environment 25
Intersections-2013.indb 25 10/21/13 5:03 PMYou can also read