HEART+MIND FIRSTVIEW POST-ELECTION STUDY NOVEMBER 6, 2020 - HEART+MIND STRATEGIES
←
→
Page content transcription
If your browser does not render page correctly, please read the page content below

Heart+Mind FirstView
        Post-Election Study
        November 6, 2020

Pg. 1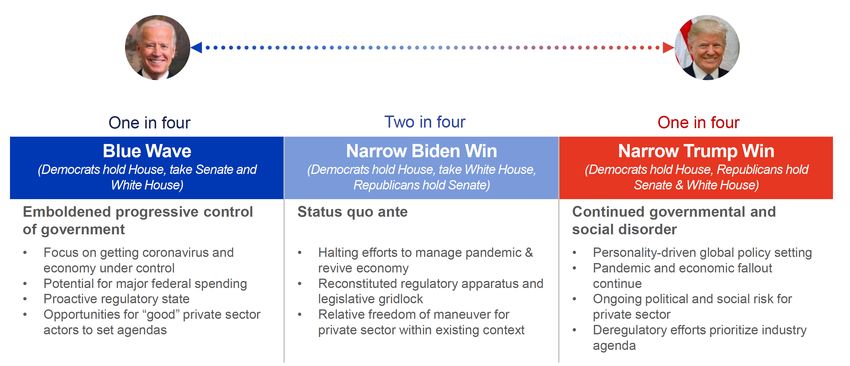
State of Play

Pg. 2
A finished count is unlikely to bring certainty

        State    Laws on Recounts
        MI       Can be requested for non-specific fraud
        WI       Can be requested for any reason
        NV       Can be requested within 1% margin
        AZ       Automatic for a 0.1% margin. Candidate CANNOT request
        GA       Can be requested with 0.5% margin - CONFIRMED
        NC       Can be requested with 0.5% margin
        PA       Automatic for 0.5% margin

Pg. 3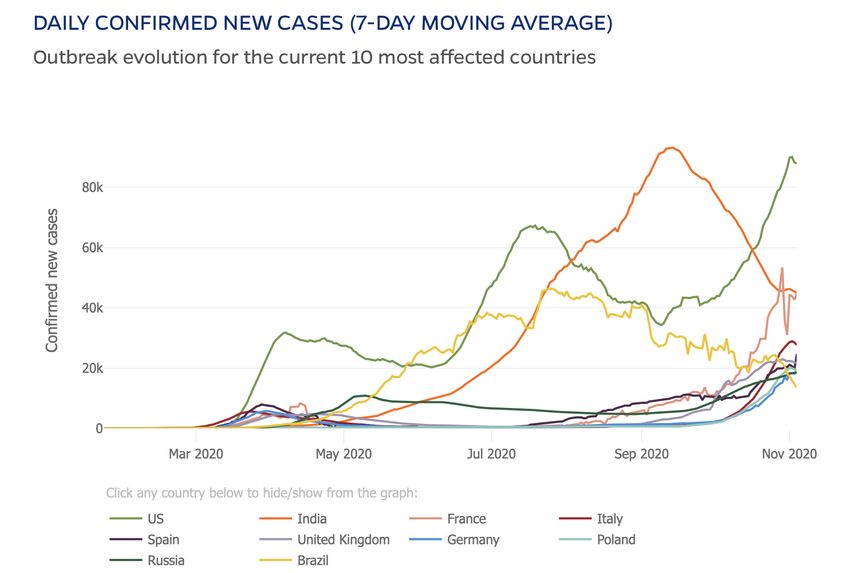
Polling

Pg. 4
The Polls Were Wrong!

Pg. 5
How “wrong” were they, now that it’s Friday, Nov 6?

Pg. 6

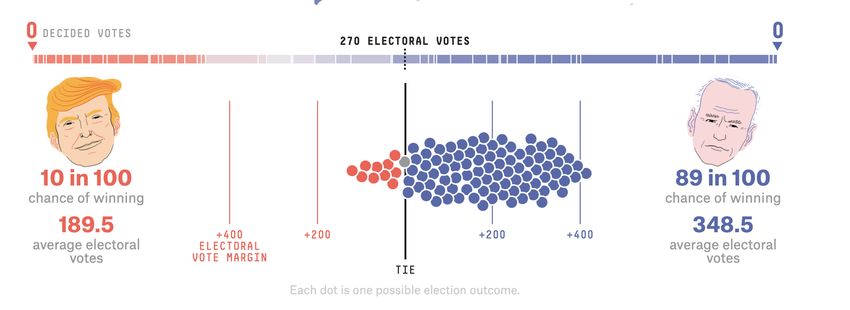
Potential Outcomes – IPSOS Model

Pg. 7    Source: IPSOS Aggregate Model
Campaign Polling ABC Science
        (Almost Being Certain)

        •   Most got Biden national popular vote right and had Trump lower. The undecided broke to
            Trump.

        •   RCP averages within MOE, showed Biden ahead in PA, MI, WI, AZ, NV. FL no.

        •   True, some high-profile outliers such as Wa/Po ABC News showing Biden +17 in WI.

        •   Mistake not to release ballot by early vote and in-person. 158m voted. 70% Democrats
            voted early; 50% GOP and INDP.

        •   Problems: Too many phone only polls. Under sampling non-college grads. Overreliance
            on the “magic” of weighting. Not factoring in social bias.

        •   Media polls “mark it with chalk and cut it with an axe” and are used to fit narratives (voters,
            pundits, and media themselves).

        •   Market research is different than just a horse race. Understanding the human and the why,
            the motivations of choice is most important.
Pg. 8
Shifting Coalitions Pg. 9
Voter support is split between the candidates, with most
voting according to party lines. Top Trump Voters
92% GOP
84% Conservative
59% Silent
58% Rural
56% West North Central
Presidential Candidate Voted For As of Nov 6th 7:00am 56% East South Central
55% Stay-at-home
Biden voters: 50.5% 54% White
53% Married
Trump voters: 47.7% 53% Retired
52% 55-64 yrs old
52% 65+ yrs old
51% Boomer
51% Have children
50% 50%
48% 48% 48%
46% Top Biden Voters
92% Democrat
83% Liberal
81% Black
71% Asian
73% Student
63% $200k+
2020 2016 2012 2020 2016 2012 62% 18-24 yrs old
Trump Trump Romney Biden Clinton Obama 3% 4%
1% 62% Single
Pence Pence Ryan Harris Kaine Biden
61% New England
2020 2016 2012
Republican candidates Democratic Candidates Independent or Third Party 59% Expanded Gen Z
Candidates 58% Younger Millennial
58% Hispanic
57% No children
57% Pacific
57% Urban
57% Not working
BASE: All Respondents 2012 (n=1,007); 2016 (n=1,003); Presidential Election 2020 (n=2,005) 56% Moderate
Pg. 10 Q307. Now please think about how you actually voted … In the election for president of the United States, for whom did you vote:As was voting among religious affiliation.
Presidential Candidate Voted For As of Nov 6th 7:00am
Religion – Net Trump Vote (Trump minus Biden) Compared to
Net Trump Vote in 2016 (Trump minus Clinton)
Biden voters: 73,738,210
Trump voters: 69,655,617
Non-
Christian
-39% Christian
11%
Catholic
9%
-100 -80 -60 -40 -20 0 Catholic 20 40 60 80 100
7%
Non- Christian
Christian 14%
-40%
Pro-Trump 2016 Pro-Clinton 2016
Pro-Trump 2020 Pro-Biden 2020
BASE: All Respondents 2020 (n=2,005)
Pg. 11 Q307. Now please think about how you actually voted … In the election for president of the United States, for whom did you vote:Trump lost a bit of ground among middle- and
high-income voters.
Presidential Candidate Voted For As of Nov 6th 7:00am
Income – Net Trump Vote (Trump minus Biden) Compared to
Net Trump Vote in 2016 (Trump minus Clinton)
Biden voters: 73,738,210
Trump voters: 69,655,617
$50-$100K
-4%
Under $50K
-8%
$100K+
2%
-100 -80 -60 -40 -20 0 20 40 60 80 100
$50-$100K
7%
Under $50K
-11%
$100K+
8%
Pro-Trump 2016 Pro-Clinton 2016
Pro-Trump 2020 Pro-Biden 2020
BASE: All Respondents 2020 (n=2,005)
Pg. 12 Q307. Now please think about how you actually voted … In the election for president of the United States, for whom did you vote:Democratic and Republican women became
even further polarized.
Presidential Candidate Voted For As of Nov 6th 7:00am
Gender and Political Party – Net Trump Vote (Trump minus
Biden) Compared to Net Trump Vote in 2016 (Trump minus
Biden voters: 73,738,210
Clinton) Trump voters: 69,655,617
Independent
Men
-5%
Democratic Female Republican
Men -8% Men
-82% 83%
Democratic Male Independent Republican
Women -1% Women Women
-90% 7% 88%
-100 -80 -60 -40 -20 0 20 40 60 80 100
Republican
Men
88%
Democratic Independent Male Republican
Women Men 12% Women
-87% -10% 79%
Democratic Independent
Men Women
-83% -14%
Female
Pro-Trump 2016 Pro-Clinton 2016 -11%
2016 Trump 2020 Trump
Pro-Trump 2020 Pro-Biden 2020
Independents 34% 41%
BASE: All Respondents 2020 (n=2,005)
Pg. 13 Q307. Now please think about how you actually voted … In the election for president of the United States, for whom did you vote:Suburban White women were noticeable more
neutral in their voting this election.
Presidential Candidate Voted For As of Nov 6th 7:00am
Race/Ethnicity, Gender, and Urbanicity – Net Trump Vote
(Trump minus Biden) Compared to Net Trump Vote in 2016
Biden voters: 73,738,210
(Trump minus Clinton) Trump voters: 69,655,617
Female
-8%
Urban White Suburban Rural White
Women White Women Women
-17% 0% 37%
-100 -80 -60 -40 -20 0 20 40 60 80 100
Urban White Suburban Rural White
Women White Women Women
-10% 14% 34%
Female
-11%
Pro-Trump 2016 Pro-Clinton 2016
Pro-Trump 2020 Pro-Biden 2020
BASE: All Respondents 2020 (n=2,005)
Pg. 14 Q307. Now please think about how you actually voted … In the election for president of the United States, for whom did you vote:Voting among education levels was largely
consistent.
Presidential Candidate Voted For As of Nov 6th 7:00am
Education – Net Trump Vote (Trump minus Biden) Compared to
Net Trump Vote in 2016 (Trump minus Clinton)
Biden voters: 73,738,210
Trump voters: 69,655,617
2016 2020
Trump Trump
White
53% 49%
College Post grad
-7% Some
College
3%
White No
65% 57% HS or less
College Bachelor
-11%
-3%
-100 -80 -60 -40 -20 0 20 40 60 80 100
Bachelor
-4%
Some
Post-grad College
-11% 6%
HS or less
-2%
Pro-Trump 2016 Pro-Clinton 2016
Pro-Trump 2020 Pro-Biden 2020
BASE: All Respondents 2020 (n=2,005)
Pg. 15 Q307. Now please think about how you actually voted … In the election for president of the United States, for whom did you vote:Trump gained ground with Hispanic voters whereas
Biden gained ground among Asian voters.
Presidential Candidate Voted For As of Nov 6th 7:00am
Race/Ethnicity – Net Trump Vote (Trump minus Biden)
Compared to Net Trump Vote in 2016 (Trump minus Clinton)
Biden voters: 73,738,210
Trump voters: 69,655,617
African- Asian Hispanic White
American -42% -22% 10%
-66%
-100 -80 -60 -40 -20 0 20 40 60 80 100
African-
American Hispanic White
Asian 23%
-90% -37% -27%
Key to shifting map
Pro-Trump 2016 Pro-Clinton 2016
Swing states become,
Pro-Trump 2020 Pro-Biden 2020
GA, PA, MI, AZ
BASE: All Respondents 2020 (n=2,005)
Pg. 16 Q307. Now please think about how you actually voted … In the election for president of the United States, for whom did you vote:Those from older age groups were more in favor
of Biden in 2020.
Presidential Candidate Voted For As of Nov 6th 7:00am
Age – Net Trump Vote (Trump minus Biden) Compared to Net
Trump Vote in 2016 (Trump minus Clinton)
Biden voters: 73,738,210
Trump voters: 69,655,617
Age 65+
Age 35-44 6%
-9%
Age 18-24 Age 25-34 Age 45-54
-32% -10% -4%
Age 55-64
6%
Age 35-44
-100 -80 -60 -40 -20 -2% 0 20 40 60 80 100
Age 18-24 Age 25-34 Age 45-54 Age 65+ Age 55-64
-34% -21% 5% 19% 26%
Pro-Trump 2016 Pro-Clinton 2016
Pro-Trump 2020 Pro-Biden 2020
BASE: All Respondents 2020 (n=2,005)
Pg. 17 Q307. Now please think about how you actually voted … In the election for president of the United States, for whom did you vote:18-24 yr. old Cohort Holds Steady on Trump Since 2016
While Biden leads Trump 2:1 in 2020, lost 3 points to Independents/3rd Parties
Presidential Candidate Voted For
Total Voters vs. 18-24 yr. old
18-24 yr. old Cohort:
65% • Age cohort most likely to say worse off than 4
62% years ago (41% vs. 34% total)
• High net negative toward the “person”
48% 50% 48%
Trump (-41) and Pence (-38)
46% • Highest net positive for Biden (+27) and
Harris (+16)
• Lowest Trump job approval (26% approve
31%
30% vs. 44% total)
• Same view on direction of country as total
voters
2020 2016 2020 2016 2020 2016 2020 2016 8% • Least likely to vote "for" a candidate/most
Trump Trump Trump Trump Biden Clinton Biden Clinton 3% 4%
3%
likely to vote against a candidate
Pence Pence Pence Pence Harris Kaine Harris Kaine
• Much more likely to vote for issues and
TOTAL VOTERS 18-24 yrs old TOTAL VOTERS 18-24 yrs old TOTAL
2016
VOTERS 18-24 yrs old accept a candidate’s flaws
Republican candidates Democratic Candidates Independent orThird Party
Republican Candidates Democratic Candidates Candidates
Ind/Third Party Candidates
BASE: All Respondents 2016 (n=1,003); 2020 Total (n=2,005); 2020 18-24 yr old (n=178)
Pg. 18 Q307. Now please think about how you actually voted … In the election for president of the United States, for whom did you vote:Intensity Muted on Issue Importance for 18-24 yr. relative to Total Voters,
except Racial Issues and Gun Control
Many other issues hold equal weight vs. select standouts
Most Important Issues for Voters in 2020
(6 or 7 on 7-point scale)
18-24 18-24
Total Voters 18-24 yr old Higher Imp
Diff vs. Total Highest ONE Most
in 2016
Extreme Imp Imp Issue
Restoring honesty and trust to government 61% -18 #2
Ensuring long-term Medicare and social security 53% -25
Growing the economy 54% -23
*Govt's response to the COVID19 pandemic 64% -11 #2 #1 n/a
Keeping U.S. secure from terrorist threats 63% -11 #3
Creating more jobs 64% -9
Ensuring accessible and affordable healthcare 61% -11
Getting the right judges onto the Supreme Court 60% -9 n/a
Reducing taxes 54% -9
Reducing the federal deficit and debt 47% -14
Protecting religious freedom 58% -3 n/a
Protecting the environment 58% -2 #3
Social or moral issues 54% -6
*The state of Kindergarten-12th grade education 57% -1 n/a
Reducing government spending 48% -10
*Racial issues 61% +4 #1 #3 n/a
Immigration reform 47% -9
Gun control 56% +1 n/a
Minimum wage 52% -2 n/a
* New item added in 2020
substantial difference
BASE: All Respondents 2020 Total (n=2,005); 2020 18-24 yr old (n=178) 18-24 > than total voters
Q340. Looking forward, there are many issues that the President and Congress may consider now that the election is over. Recognizing that different issues matter to different voters, for
each of the following, please indicate the importance of the issue for you personally using a scale of 1 to 7, where 1 means “not at all important” and 7 means “extremely important.”
Pg. 19 Q325. Which ONE of the following issues was most important to you in determining your vote this election? Please select only one.Issue Agenda Pg. 20
National Mood Worsened During 2020

                                      Mood of the Country
                                          Right Direction                 Wrong Track
                                                                                                       84%

                                                                                                                                           69%               69%
                                                  63%                                                                                                                                               62%
                                                                                                                          54%                                                       55%
                                51%                                                                                                                                          51%
                                                                     48%            47%

                                                                                                                                                                             49%
                                43%                                                                                       45%                                                       45%
                                                                                     41%
                                                                                                                                                                                                    38%
                                                                     32%
                                                                                                                                                             31%
                                                  27%                                                                                      26%

                                                                                                       14%

                                1992              1996             2000              2004              2008              2012             2014              2016             2018   2020*          2020**

                                                                                                                                                                                    *Super Tuesday 2020
                                                                                                                                                                                    **Presidential Election 2020

         BASE: All Respondents 2018 (n=1,058); Super Tuesday 2020 (n=1,002); Presidential Election 2020 (n=2,005)
Pg. 21   Q315. Generally speaking, would you say that things in the COUNTRY are going in the right direction, or have they pretty seriously gotten off on the wrong track?
COVID Cases Worsening
US Trend
Pg. 22Personal Economic Situation Worsened
Personal Economic Situation Better
or Worse than 4 Years Ago*
12%
Much better 17% 20%
Better 29% 31%
Somewhat
38% 43% 18% 31%
better 21%
23%
Same Same
Somewhat 36%
46% 42% worse
Worse 38% 32%
Much worse
22%
13% 16%
25% 27% 24% 25% 34%
10% 10% 12%
2014** 2016** 2018 2020*** 2020****
***Super Tuesday 2020
**CNN Exit Data ****Presidential Election 2020
BASE: All Respondents 2018 (n=1,058); Super Tuesday 2020 (n=1,002); Presidential Election 2020 (n=2,005). *Note: Asked as “2 years ago” in 2018
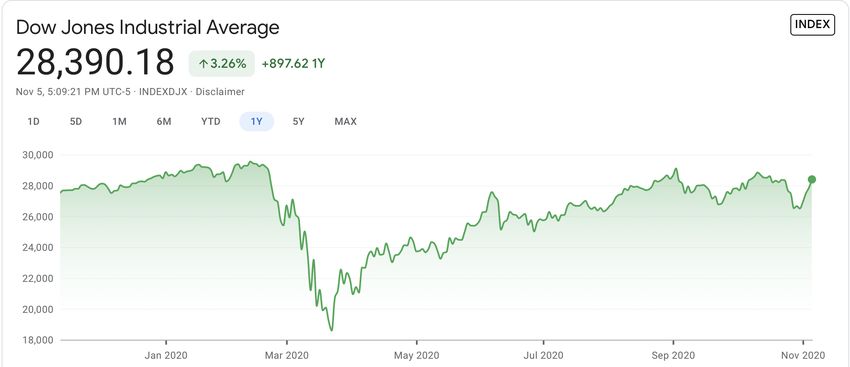
Pg. 23 Q305. Thinking of your personal economic situation, are you better or worse off than you were four years ago?DOW Pre- and Post-election Pg. 24
Trust in Washington Remains Low.

             Trust Elected Officials in Washington to Do What’s Right

                                                                2008            2012           2014           2016            2018          2020*          2020**

             (10) Complete Trust                                 1%              1%             1%             3%              7%             5%             8%

             (8-9) High Trust                                    6%              6%             4%             9%             11%            11%            12%

             (6-7) Low Trust                                    20%             18%            13%            19%             17%            19%            23%

             (1-5) No Trust                                     73%             76%            82%            69%             64%            66%            57%

                                                                                                                                                 *Super Tuesday 2020
                                                                                                                                                 **Presidential Election 2020

         BASE: All Respondents 2008 (n=1,049); 2012 (n=511 [Online Only]); 2014 (n=1,023); 2016 (n=1,003); 2018 (n=1,058); Super Tuesday 2020 (n=1,002); Presidential Election 2020 (n=2,005)
Pg. 25   Q390. Please indicate the extent to which you trust elected officials in Washington to do what’s right using a scale of 1 to 10, where 1 means you have “no trust in Washington” and 10 means you have “total trust in Washington.”
Health, Economy, Trust Drove the Vote; Top Agenda
Vote Determinant
Most Important Issues for Voters
(6 or 7 on 7-point scale)
Issue Agenda TOTAL
Biden Trump
Biden Voters Trump Voters Voters Voters
Restoring honesty and trust to government 82%
77% 10% 12% 8%
Ensuring long-term Medicare and social security 82%
74% 9% 9% 9%
Growing the economy 70%
85% 16% 6% 28%
*Govt's response to the COVID19 pandemic 87%
64% 19% 31% 6%
Keeping U.S. secure from terrorist threats 66%
83% 7% 2% 12%
Cre ating more jobs 70%
77% 3% 3% 4%
Ensuring accessible and affordable healthcare 84%
61% 6% 9% 3%
Getting the right judges onto the Supreme Court 69%
71% 2% 1% 3%
Reducing taxes 57%
71% 3% 1% 4%
Reducing the federal deficit and debt 55%
67% 2% 1% 2%
Protecting religious freedom 53%
69% 3% 1% 5%
Protecting the environment 78%
42% 4% 6% 1%
Social or moral issues 67%
54% 3% 3% 3%
*The state of Kindergarten-12th grade education 64%
53% 2% 1% 2%
Reducing government spending 51%
67% 2% 1% 2%
*Racial issues 74%
40% 5% 8% 1%
Immigration reform 52%
61% 2% 1% 3%
Gun control 70%
40% 1% 1% 1%
Min imum wa ge 68%
41% 2% 1% 2%
* New item added in 2020
substantial difference
BASE: All Respondents 2018 (n=1,058); Presidential Election 2020 (n=2,005); Biden Voters (n=1,015); Trump Voters (n=925)
Q340. Looking forward, there are many issues that the President and Congress may consider now that the election is over. Recognizing that different issues matter to different voters, for each of the following, please indicate the importance of the
issue for you personally using a scale of 1 to 7, where 1 means “not at all important” and 7 means “extremely important.”
Pg. 26 Q325. Which ONE of the following issues was most important to you in determining your vote this election? Please select only one.Restoring honesty and trust to government
tops issues among voters as it did in 2018.
Most Important Issues for Voters
(6 or 7 on 7-point scale) Vote Determinant
2020
Issue Agenda 2020 2018 Change TOTAL GOP DEM
Restoring honesty and trust to government 79% 82% -3 10% 10% 11%
Ensuring long-term Medicare and social security 78% 82% -4 9% 10% 9%
Growing the economy 77% 76% +1 16% 28% 6%
*Govt's response to the COVID19 pandemic 75% N/A - 19% 7% 30%
Keeping U.S. secure from terrorist threats 74% 76% -2 7% 11% 2%
Cre ating more jobs 73% 72% +1 3% 3% 3%
Ensuring accessible and affordable healthcare 72% 77% -5 6% 3% 9%
Getting the right judges onto the Supreme Court 69% 73% -4 2% 3% 1%
Reducing taxes 63% 67% -4 3% 3% 1%
Reducing the federal deficit and debt 61% 71% -10 2% 3% 1%
Protecting religious freedom 61% 63% -2 3% 5% 1%
Protecting the environment 60% 63% -3 4% 1% 6%
Social or moral issues 60% 59% +1 3% 3% 3%
*The state of Kindergarten-12th grade education 58% N/A - 2% 2% 1%
Reducing government spending 58% 70% -12 2% 2% 2%
*Racial issues 57% N/A - 5% 1% 8%
Immigration reform 56% 64% -8 2% 3% 1%
Gun control 55% 57% -2 1% 1% 1%
Min imum wa ge 54% 57% -3 2% 1% 2%
substantial difference
BASE: All Respondents 2018 (n=1,058); Presidential Election 2020 (n=2,005); GOP (n=810); DEM (n=893)
Q340. Looking forward, there are many issues that the President and Congress may consider now that the election is over. Recognizing that different issues matter to different voters, for each of the following, please indicate the importance of the
issue for you personally using a scale of 1 to 7, where 1 means “not at all important” and 7 means “extremely important.”
Pg. 27 Q325. Which ONE of the following issues was most important to you in determining your vote this election? Please select only one. * New item added in 2020Biden and the democratic party’s policies draw positive
feelings – on the surface. Green and Socialists not so.
Feelings About Each Candidate or Party’s Policies and Programs
Net Positive
(Pos.-Neg.) -4% 6% -1% 3% -10% -15% -10% -17%
25% 22%
29% 32%
Positive (NET)
46% 49% 46% 47%
Neutral 42% 18%
39% 33%
5% 8%
7% 10%
Negative (NET)
50% 47% 50%
44% 43%
35% 37% 38%
Trump Biden Republicans Democrats Libertarians Green Party Progressives Democratic
Socialists
BASE: All Respondents (n=2,005)
Pg. 28 Q317. Now, please indicate how you feel about the policies and programs that each of the following individuals or groups support.Nearly half of voters see free-market economy as
the way to go.
Key Issue Positions
21% We should have a
guaranteed job with benefits
for every American making
millions of Americans
employees of the federal 46% We should focus on
government. regulatory reform and
eliminating crony capitalism.
In that environment, the free-
market is the best way to
32% We should establish a grow our economy and create
Federal Jobs Corps that focuses Jobs good jobs for Americans.
on employment through public
works projects, expanded
collective bargaining, and racial
equality.
Progressive position
Liberal/Biden position
Conservative position
BASE: All Respondents (n=2,005)
Pg. 29 Q365a. You will now see a series of positions on key issues facing America today. Select the one that BEST describes how you feel.Only 1 in 5 voters say that universal government
healthcare is the way to go.
Key Issue Positions
21% We need universal
single-payer government
healthcare for all Americans.
40% We need to replace
the Affordable Care Act with a
system that prioritizes
transparency, freedom of
choice and cost-efficient care.
Affordable
38% We need to protect the Care Act
Affordable Care Act and build on it
to make healthcare more
affordable and less complex.
Progressive position
Liberal/Biden position
Conservative position
BASE: All Respondents (n=2,005)
Pg. 30 Q365b. You will now see a series of positions on key issues facing America today. Select the one that BEST describes how you feel.3 in 7 voters agree that the recent tax cuts
should be extended past 2022.
Key Issue Positions
39% We should raise the
top marginal tax rate to 70% 42% The recent changes
and institute a wealth tax on to the tax code were smart
Americans with high net and we should extend those
worths. provisions that will otherwise
expire in 2022.
Taxes
19% We should undo the
recent tax cuts, raising taxes on
individuals, reinstating the
Alternative Minimum Tax and Progressive position
bringing our corporate tax rate to Liberal/Biden position
the highest levels in the world. Conservative position
BASE: All Respondents (n=2,005)
Pg. 31 Q365c. You will now see a series of positions on key issues facing America today. Select the one that BEST describes how you feel.Half of voters agree that the chance to succeed on
one’s own merit is key to racial equality.
Key Issue Positions
24% American society
elevates white culture above
all others. It is not enough to
be “not-racist”. Individuals and
government policies need to
52% Racial equality will
come when we have racial
reflect specifically “anti-racist”
blind equality of opportunity,
attitudes and goals.
giving every individual the
chance to grow, achieve and
Societal succeed on their merits, skills
and drive.
and Racial
24% We need specific Issues
government policies that provide
additional support, resources and
opportunities to racial minorities.
Progressive position
Liberal/Biden position
Conservative position
BASE: All Respondents (n=2,005)
Pg. 32 Q365d. You will now see a series of positions on key issues facing America today. Select the one that BEST describes how you feel.Key Takeaways Pg. 33
Takeaways
         Uncertainty continues.                                      Latino and Youth turnout once again did not
         Expect continued electoral uncertainty. Consumer stress     materialize.
         from the pandemic and election is running extremely high.   For all the protesting, and when it counted, where were
                                                                     these groups?
         Choice and convenience.
         These consumer needs take hold in how we vote. Mail         Stop thinking of groups as monolithic.
         voting is here to stay.                                     Millennials, Women, Latino, Blacks, Republican, Democrat,
                                                                     City vs Rural, etc.
         Big realignments are dead.
         No national realignment. But we do see micro-coalitions     FUDD Works.
         forming. Example: Rural, multicultural, less educated,      Fear, Uncertainty, Doubt, Division. Will our stress and
         socially conservative motivated by what they are against.   anxiety need the message of calm and confidence?

         Tribalism continues.                                        The Senate Club.
         Divisions amplified beyond party. Especially by gender,     Don’t underestimate the Joe and Mitch relationship as a
         education, ethnicity, and locale.                           way to perhaps get things done in a balanced legislative
                                                                     agenda.
         People over Platform.
         Don’t assume how humans will behave. Don’t take your        Trust remains the golden ring.
         voters or customers for granted.                            Brands and institutions are under assault. Expect a
                                                                     renewed effort on reputation management practices and
                                                                     social cause marketing.

Pg. 34
You can also read