HIGHER EDUCATION SCHOOL FINANCE INEQUITY AND INADEQUACY IN VIRGINIA - JAMES MURPHY, MICHAEL DANNENBERG, & KATLYN RIGGINS
←
→
Page content transcription
If your browser does not render page correctly, please read the page content below

HIGHER EDUCATION SCHOOL FINANCE
        INEQUITY AND INADEQUACY
                       IN VIRGINIA

     JAMES MURPHY, MICHAEL DANNENBERG, & KATLYN RIGGINS
EXECUTIVE SUMMARY
          SUMMARY

A
      Democratically controlled legislature and Democratic
                      governor have increased total funding for Virginia’s
                      public universities markedly over the past three years,
                      but the Commonwealth still has an irrational,
                      inequitable, and unjust public higher education
                      finance system in need of reform. Even with a
                      significant increase in state investment for the most
                      recent fiscal year, public support for Virginia higher
education has not kept up with rising costs and an expanded pool of
students, leading to not just higher tuition and fees for students and
families, but some of the highest tuition and fee levels in the country and
ever rising student loan debt, particularly for working-class, low-income,
and racial minority students.

The findings summarized below and detailed in this paper track those of
our prior brief, Scratching the Surface, which describe a system of higher
education in Virginia that is segregated on a de facto basis by class and
race. It is incumbent for Virginia state leaders to not just increase higher
education funding overall, but to do so in a way that furthers equitable state
finance of and access to quality public colleges and universities. As federal
officials, especially those from Virginia, and advocates in the
Commonwealth and beyond likewise consider major new investments in
higher education as per President Biden’s latest budget proposal, it is
incumbent on them to do the same – further equitable state finance of and
access to quality public colleges and universities.

                                                                                 1
Hidden Distribution Decisions & High Levels of Higher Ed School
Finance Inequity

   •   Virginia does not have a transparent, consistent funding formula for
       state support to public institutions of higher education linked to
       institution need, access, affordability, or success.

   •   The Commonwealth provides 68% more in state funding to public
       four-year colleges than it does to two-year community colleges per
       full-time equivalent student.

   •   Wealthy, public four-year colleges like William & Mary receive more
       state funding per student annually than Old Dominion and George
       Mason, which serve a much more racially and socioeconomically
       diverse student body.

Scarce Public Dollars Directed to the Wealthy & Dubious Private
Schools

   •   Virginia spends close to $70 million per year on the Virginia Tuition
       Assistance Grant (VTAG) program for those attending private four-
       year colleges. VTAG funds are disconnected from family financial
       need and support private institutions where not even half of
       undergraduates earn a degree.

   •   More students from upper-income families earning over $100,000 a
       year benefit from VTAG than students from hard-pressed middle-
       income families with incomes between $50,000 and $100,000. In
       fact, through VTAG each year, approximately $10 million in Virginia
       college financial aid goes to families with zero demonstrated
       financial need.

   •   Liberty University, which is arguably one of the worst non-
       profit private colleges in the country for poor and minority
       students in terms of affordability and completion, is the
       largest recipient of

                                                                               2
VTAG funding by a factor of four. Liberty University alone received
       almost $17 million in VTAG funds in 2019 (25% of the total VTAG
       funds Virginia dispensed to undergraduates) despite having a Black
       student graduation rate of just 17%.

Exceptionally Low Investment in Public Higher Education

  •   Not only is Virginia not leveling up higher education school finance
      equity, until the recent Democratic takeover of the state legislature, it
      had been slowly divesting from public higher education. In 2001,
      Virginia students paid just 23% of the cost of public higher education
      and the state paid 77%. In 2019, students covered 52% and the state
      just 48%.

  •   Even after increased total investment during the tenures of
      Governors McAuliffe and Northam, as of 2020 Virginia still ranked
      44th in the nation in state funding for two-year colleges per full-time
      equivalent student.

  •   Virginia’s public four-year comprehensive and research institutions
      have the 3rd and 7th highest tuition and fee levels in the nation,
      respectively.

  •   On an inflation adjusted basis, Virginia’s per pupil contribution to
      public higher education has been relatively flat for the last decade
      and remains smaller than it was in 2009 for four-year institutions.

Elevated & Rising Student Debt Levels

 •    Some 57% of Virginia postsecondary education graduates from public
      four-year colleges leave with student loan debt and a quarter owe
      more than $50,000.

                                                                                  3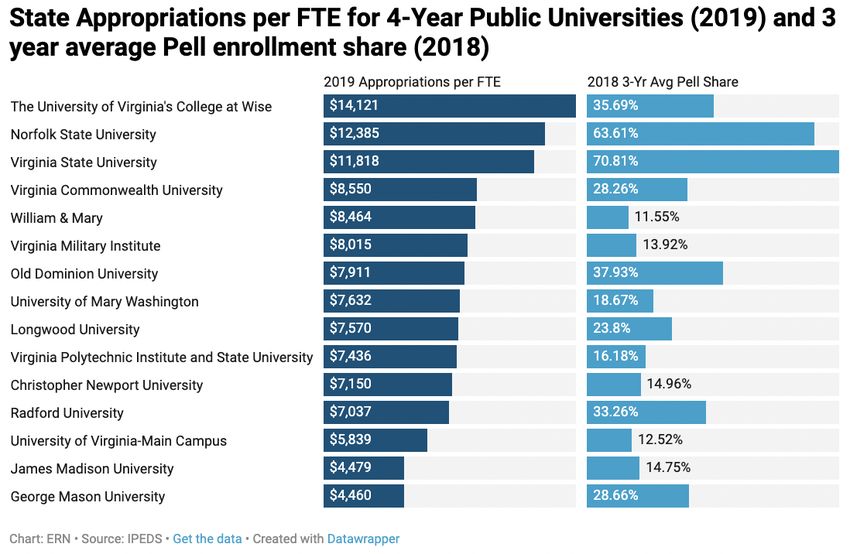
•   At Virginia’s two public HBCUs, approximately 90% of graduates leave
                   with student loan debt. Half of them owe more than $40,000. In
                   contrast at the state’s two wealthiest and most selective public
                   universities, each of which receive sizable financial support from the
                   Commonwealth of Virginia, barely a third of students graduate with
                   debt and median debt is $15,000 less than at the HBCUs.

               •   In 1992, just 29% of Virginia residents took out loans to attend a public
                   college, but in 2018, 51% did. The amount individuals borrowed almost
                   doubled in inflation-adjusted dollars. The portion of community
                   college students who take out loans increased more than five times.

Our first report examined student demographics and enrollment trends at Virginia public
and private colleges individually, compared to each other, and compared to national
levels and peer institutions in other states.

This paper is the second in a series making up a full report on Virginia’s small ‘c’
conservative commitment to diversity and socioeconomic mobility through higher
education. Here, we focus on college affordability and financial aid.

                                                                                               4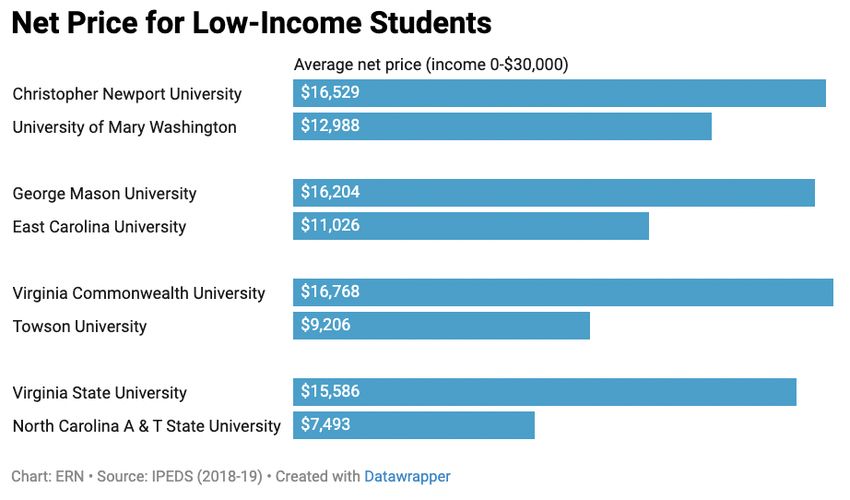
INTRODUCTION
       SUMMARY

F
                  ew states loom as large in the history of public education
                  as Virginia. More than two centuries ago, Thomas
                  Jefferson’s “Bill for the More General Diffusion of
                  Knowledge” argued that because an educated citizenry
                  was essential to successful democracy it should be
                  “educated at the common expense of all” without regard
                  to “wealth, birth or other accidental condition or
circumstance.” Even though today we would reject Jefferson’s
                1

understanding of who constituted the citizenry, his is still a commendable,
high ideal that went on to guide the creation of the University of Virginia
and shaped the American understanding of higher education as not just a
finishing school for the elite, but as an engine of democracy, freedom, and
socioeconomic mobility.

Over the past twenty-five years that engine has stalled in Virginia.

The Commonwealth has slowly privatized higher education by failing to
maintain funding for its public institutions. The funding it does provide for
higher education is not supplied in a systematic and transparent manner
emphasizing equity or accountability. And it runs a regressive financial aid
program that sends millions of dollars to private colleges and universities that
too often fail to deliver an adequate return on the taxpayers’ investment.

All this adds up to high tuition, increased student loan debt, and declining
college affordability for low-income, working class, and hard-pressed
middle class Virginia residents.

A meaningful commitment to socioeconomic opportunity and diversity in
higher education entails a commitment to college affordability as well
intentional recruitment and fair admission policies. It does little good to
increase recruitment of underrepresented minorities or low-income
students if an institution is not affordable. Conversely, enrolling high

                                                                                   5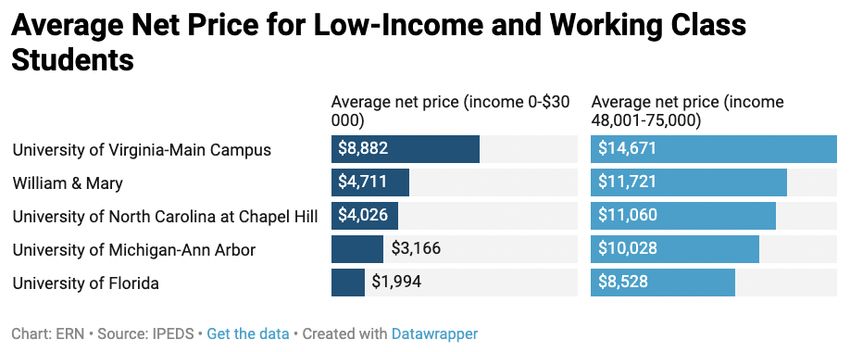
numbers of underrepresented students only to have them drop out or
graduate with crippling student loan debt deeply impairs the power of
higher education to elevate one's economic standing. The data indicate
Virginia needs to address multiple college affordability issues.

Virginia Funds Higher Education Inequitably

The large differences in net price (i.e. out-of-pocket price after all grant aid
is conferred) and student debt among Virginia’s public universities point to
a more fundamental issue in the Commonwealth’s higher education
system. There are large inequities in how the state funds higher education.
In fact, Virginia does not even have a public higher education funding
formula that can be said to drive equity and infuse a degree of
accountability.

Aggregate state appropriations for community colleges have returned to
2009 levels in Virginia, but there remains a large gap in state funding per
pupil between two- and four-year public colleges. Virginia four-year
colleges receive 68% more per full-time equivalent (FTE) student than two-
year institutions, even though community colleges have less institutional
wealth and serve students with much greater need (see figure 1).

                             Figure 1

                                                                                   6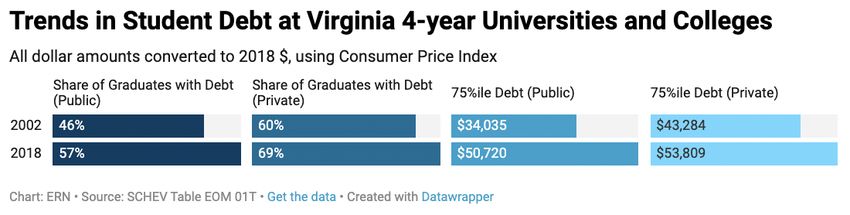
William & Mary University, with its nearly $1 billion endowment, and the
          Virginia Military Institute (VMI), with a $540 million endowment, receive
          more than twice as much per FTE student than many community colleges
          in the state.2 Two-year institutions in the Commonwealth, almost without
          exception, serve low-income students and Black students at a much higher
          rate than either William & Mary or VMI (see figure 2).3

                              State Appropriation           Pell             Black
   Institution Name            per FTE Student           Enrollment        Enrollment
                                     (2019)                (2018)            (2018)

     William & Mary                  $ 8,464                11.6%              7.2%

Virginia Military Institute          $ 8,015                13.9%              6.2%

     Lord Fairfax
                                     $ 3,988                20.6%              4.0%
  Community College
   Piedmont Virginia
                                     $ 4,505                22.0%              12.5%
  Community College
 Tidewater Community
                                     $ 3,677                39.0%              31.0%
       College
                        Source: Analysis of IPEDS Data 2016-18.
                                       Figure 2

          Among four-year universities, state appropriations are unevenly distributed
          and appear to follow no clear logic. While it is good to see institutions with
          larger Pell Grant recipient shares receiving more funding than those that
          enroll a smaller portion of low-income students in most cases, it is still
          notable that the Commonwealth’s two HBCUs enroll the largest shares of
          Pell Grant students but do not receive the largest appropriation per full-
          time equivalent student (see figure 3).

            •   George Mason enrolls Pell Grant students at more than twice the rate
                that the University of Virginia and is much more racially and ethnically

                                                                                           7
diverse, but it gets the smallest per FTE pupil state appropriation in
the Commonwealth among four-year colleges.
• Virginia Military Institute gets the sixth largest state per pupil
appropriation and William & Mary gets the fifth largest, even though
both institutions have huge endowments and rank among the
worst 11 public universities in the country in terms of Pell Grant student
enrollment rate.
Figure 3
A more rational and equity-minded approach to funding higher education in
the Commonwealth would direct appropriations to the institutions that
enroll greater shares of low-income and working-class students as well as
under-represented minorities. It would reward institutions that improve
outcomes for these and all students as reflected in graduation rates overall
and among disaggregated subgroups. It would reward reduction of
enrollment and completion gaps between wealthy students and white
students as compared to those who are not. It would take into
consideration institutional wealth and success.
And it would support improved academic preparation at the secondary
school level so that students are better able to complete their
postsecondary education studies in a timely fashion.
8Virginia has no such approach, although some equity measures are
proposed in SCHEV’s Virginia Plan for Higher Education.4 Currently,
Virginia’s distribution of state higher education funding prioritizes faculty-
student ratios, instruction and support services, and faculty salaries.5 It sets
a goal that “the percentage of the cost of education for Virginia students
enrolled at an institution to be funded from state general funds is the same
for each institution.” But Virginia does not actually do that (see figures 2, 3).
Moreover, equal funding is bad funding when it comes to higher education.
Virginia’s two- and four-year colleges need equitable funding; that is higher
funding for those with higher needs, and a formula that guarantees it.
Virginia Misdirects Financial Aid to the Wealthy &
Dubious Private Schools
Inefficiency and inequity also bedevil one of Virginia’s largest student grant
aid programs. One way states blunt the impact of declining overall state
investment in higher education and rising tuition and fees on hard-pressed
families is to increase state grant aid to needy students. Virginia has many
aid programs, but the largest are two need-based programs for public
institutions and one disconnected from need for private colleges.
1) The Virginia Commonwealth Award and the Virginia Guaranteed
Assistance Program (VGAP) are side-by-side, need-based grant
programs for residents enrolled in an undergraduate program at in-
state, public two- or four-year institutions. VGAP recipients must have
at least a 2.5 GPA in high school, enroll full-time in college, and
maintain a 2.0 GPA. The average Virginia Commonwealth/VGAP
Award was $2,752 in 2018. In 2020, the total funding for both
programs was $249 million.6
2) The Virginia Tuition Assistance Grant Program (VTAG) is a non-need
and non-academic merit based grant for undergraduate and graduate
students who are Virginia residents attending private, non-profit four-
year institutions in Virginia (96% of the funds go to undergraduates).7
The average VTAG award was $3,066 in 2018. In 2020, the total
funding for VTAG was $71 million.8
3) Because VTAG is not based on need and simply distributed to
students who complete the application (meaning it is not even a so-
9called “merit” program), millions of taxpayer dollars each year go to
students who do not need financial assistance, particularly since
highly-resourced students are more likely to be advised to fill out the
application.9 More students from families earning over $100,000 a
year end up with a larger share of VTAG financial aid than students
from working-class and middle-income families with income between
$50,000 and $100,000 in 2018 (see figure 4).
Figure 4
Almost 16% of the students who received VTAG funding in 2018 (3,269
students in total) qualified for no financial aid or did not even bother
applying for federal financial aid (see figure 5). Each year, approximately
$10 million in Virginia state college aid goes to families with zero
demonstrated financial need and zero indication of heightened
academic merit.
Figure 5
10Moreover, VTAG funding is provided to a number of private colleges with
poor student outcomes. Nine private colleges (37.5% of all such Virginia
institutions) that get VTAG funds have graduation rates below 50% (see
figure 6).10 Liberty University is the largest recipient of VTAG funding by
a factor of four, even though it has a 47% overall graduation rate and a
Black graduation rate of just 17%.11
Figure 6
11Over 100,000 Virginia residents attending the Commonwealth’s public
colleges received Pell Grants in 2018. Their average income was $27,805.
Their average Pell award was just $4,309, leaving a large gap to cover the
cost of attendance for many low-income students.12 Virginia would do far
more good if it used the $70 million per year it spends on the VTAG on
additional aid for students who receive Pell Grants.13
Virginia Has Increasingly Privatized Its Public Higher Education System
Redirecting VTAG aid to students with financial need is necessary, in part,
because over the past two decades Virginia has followed a path of
privatization when it comes to public college finance. As in many states,
per-student higher education appropriations in Virginia have declined since
their peak in 2001. Since 2012, the Commonwealth’s appropriations per
FTE student at two- and four-year institutions combined have increased,
but a wider lens reveals that they have dropped 24% in constant dollars
since the start of the century. That decline is three times larger than the
national average, which was 8% lower as compared to the level in 2001.14
In 2020, Virginia ranked 44th in state funding for two-year community
colleges per FTE student and 36th in funding for higher education overall,
despite being among the wealthiest states in the nation (see figures 7 &
8).15
Figure 7
12Figure 8
A 2012 report by the Joint Legislative Audit and Review Commission,
commissioned by Virginia’s General Assembly, sounded the alarm about
the price of college being passed on to students and families. The
legislature responded by increasing appropriations to higher education.16
Despite this effort though, between 2009 and 2019, Virginia per-student
appropriations for four-year institutions actually declined by 15% in constant
dollars (see figure 9).17
13Figure 9
When public colleges are underfunded by states, they typically backfill a
substantial portion of missing resources with heightened tuition and fees
charged to families. In 2001, Virginia students paid just 23% of the cost of
public higher education and the state paid 77%. In 2019, students covered
52% and the state just 48%.18 Virginia’s comprehensive public four-year
colleges and research universities have the 3rd and 7th highest tuition
and fee levels in the nation (see figure 10).
14Virginia’s Rank Among All States In-State Undergraduate Tuition and
Fees at Public Institutions
Institution Estimated
1989-90 1993-94 2000-01 2009-10 2018-19 2019-20
Category 2020-21
Comprehensive 3rd 3rd 6th 10th 3rd 3rd 3rd
Institutions
Doctoral/ 5th 8th 19th 16th 7th 7th 7th
Research
Institutions
Source: SCHEV 2020-21 Tuition and Fees Report
Figure 10
The University of Virginia (UVa) has the fifth highest in-state tuition and
fee level in the nation for public flagships (see figure 11), despite its $9.6
billion endowment (18th highest in the nation).19 On top of that endowment,
UVa built a cash reserve of $2.2 billion between 2007 and 2016—one
former board member called it “a slush fund”—even as it raised tuition and
fees. UVa deemed this reserve a Strategic Investment Fund, intended to
propel improvements at the university, but it was not until 2020 that it
finally provided $30 million for the university’s scholarship endowment.20
That sum represents less than 5% of the fund it has distributed across the
university since 2016.21 Dedicating more of the Strategic Investment Fund
to financial aid could make UVa one of the most affordable flagships in the
nation, but the university appears to have the opposite priority.
15Figure 11
16Published tuition and fees do not tell the whole college affordability story,
however. Federal and state grants along with institutional discounts mean
that at most colleges and universities many students do not pay sticker
price. Sticker prices matter since they can discourage students from even
applying because they think that college is too expensive. But more
significant than sticker price is the actual cost of attendance, or net price.
Net price is the out-of-pocket price students pay for tuition, fees, books,
food, and housing expenses after all grant aid and scholarships are
subtracted from the published cost of attendance.22
Over 1,200 first-time, full-time students from households with incomes
below $30,000 per year attend Christopher Newport, Virginia
Commonwealth, George Mason, and Virginia State University. The average
net price for these exceptionally low-income but promising students is over
$15,000 a year, or more than half of their annual household income. Each
of these colleges charges low-income students substantially more than
peer institutions (see figure 12).23
Figure 12
17Christopher Newport University (CNU) deserves special attention, if only for
its connection to political clout. It’s a public college located in U.S. House of
Representatives Chairman Bobby Scott’s Congressional District and its
President is former U.S. Senator Paul Trible (R-VA). CNU has the second
highest average net price of any public, four-year institution of higher
education in the nation (see figure 13).24 It has steadily increased its net
price over the last decade; adjusted for inflation, CNU’s net price has
increased 37% (60% in unadjusted dollars). Today over a quarter of CNU
students that graduate do so with over $60,000 in student loan debt.
Perhaps not coincidentally, from 2011 to 2018 its enrollment rate of students
with Pell Grants shrank from 17% of undergraduates to 14%. The state
average Pell Grant student enrollment rate at four-year public institutions
grew slightly from 25.6% to 25.8% during this time.25
Figure 13
18UVa’s net price for students from households making less than $30,000 is
lower than Christopher Newport and many of its in-state peers’, but low-
income students pay even less at William & Mary and at other flagships
with a national reputation (see figure 14).
Figure 14
One should not rush to applaud William & Mary, however, on affordability
for low-income students. Like UVa and Christopher Newport, it admits far
too few low-income students. At Virginia Commonwealth University, 13% of
freshmen come from households making less than $30,000; at Virginia
State, 28%. But at UVa, William & Mary, and Christopher Newport less than
4% of freshmen come from poor households. In fact, these three
universities rank among the 11 worst public colleges in America when it
comes to enrolling students with Pell Grants as noted in our first Virginia
higher education brief. And no public official seems to hold these
institutions accountable for that performance.
More College Students in Virginia Have to Borrow to Pay for College,
and They Are Borrowing More Than Ever
Since 1992, the share of Virginia residents who need to take out loans to
attend a public Virginia four-year college has grown from 29% to 51%. The
amount borrowed on average increased from $3,134 in 1992 ($5,589 in
2018 dollars) to $10,495 in 2018 (see figure 15). At private, Virginia four-year
colleges, the share of students taking out loans grew from 40% to 70%,
with a larger increase as well in the amount of borrowing in one year, from
19$3,860 in 1992 ($6,884 in 2018 dollars) to $11,264 in 2018. While the share
of Virginia residents who borrow to attend a community
college has been significantly smaller than at four-year public institutions,
that proportion has increased more than five times, from 2.5% to 12.6%
between 1992 and 2018. Make no mistake, Virginia’s student loan crisis is
in large part a function of state disinvestment in higher education.
Source: SCHEV Table FA33T: Trends in the Percentage of Students Enrolled in the Fall who Borrowed
Figure 15
From 2002 to 2018, the share of students graduating from Virginia’s public
universities with debt increased by 24% and the amount of debt they had
increased by 18% (see figure 16). Worse yet, the debt of big student loan
borrowers (i.e., the highest quartile that owe over $50,000) grew by 49%
during that same time period. The dollar amounts and shares are higher yet
at four-year private universities.26 And it is important to note that these
numbers are only for college graduates, who at least enjoy the financial
benefits of a degree, unlike the thousands of students leaving college with
debt and no degree.
Figure 16
20There are vast differences in the proportion of students who graduate from
Virginia’s public universities with debt and in how much debt they possess
(see figure 17). At Christopher Newport and James Madison University, a
quarter of graduates leave owing more than $60,000 in student loan debt.
At Longwood University, a quarter of graduates owe more than $70,000 in
student loan debt. Students of color who graduated from four-year colleges
in Virginia are more likely to have debt than white graduates are (64% to
54%, respectively), and their median debt levels are about $1,500 higher.27
Figure 17
A notably smaller share of students graduate with debt from Virginia’s two
most selective and wealthiest public universities, and their debt loads are
smaller on average, particularly at UVa. But again before we commend
William & Mary or UVa for their seeming affordability, recall they enroll
smaller shares of Pell Grant recipients than almost every other public
college and university in the nation. They look relatively affordable
compared to other Virginia colleges in terms of median student loan debt,
21in part, because they accept relatively few students who need to borrow
money for college.
In stark contrast, almost every graduate from the state’s two public
Historically Black Colleges and Universities (HBCUs), Norfolk State and
Virginia State, leaves with debt, and a quarter of graduates owed more
than $54,000 in 2018 (see figure 17).28 The ubiquity and size of student loan
debt for Black students and at HBCUs is of particular concern. For reasons
ranging from societal discrimination in employment and earnings to the
racial wealth gap and occupational choice, national data indicates some
49% of Black student loan borrowers default on a student loan at least
once over a 12 year repayment period and some 23% of Black bachelor
degree holders default on student loan at least once during the same
period of time—a rate four times higher than their white peers (see figure
18).29 In short, student loan debt at public two- and four-year colleges is
worsening racial inequity.
Borrower Loan Default Rate within 12 Years after Entry (Students entered in 2003-04)
No
Attained Attained
Attained Degree, Dropped
Overall Bachelor’s Associate
Certificate Still Out
Degree Degree
Enrolled
White 21% 6% 17% 40% 23% 38%
Black/AA 49% 23% 33% 54% 46% 65%
Hispanic/ 36% 14% 21% 51% 30% 48%
Latinx
Overall 29% 9% 22% 46% 29% 46%
Source: Center for American Progress, 2017.
Figure 18
22CONCLUSION
SUMMARY
I
n our last brief on Virginia higher education, we highlighted
Virginia’s de facto segregated system by class and race. This
brief follows on that because affordability contributes to inequity
in access and outcomes. It is not enough simply to recruit a
diverse pool of applicants. Colleges and universities must be
affordable as well in order to make a meaningful commitment to
diversity.
Virginia has failed to answer the charge Thomas Jefferson called it to over
two centuries ago: to create an educated populace “without regard to
wealth, birth or other accidental condition or circumstance.” It was a noble
challenge then and one that Virginia can and should still fulfill, for its own
good and the good of families with students of all ages.
###
23ENDNOTES
SUMMARY
1
“79. A Bill for the More General Diffusion of Knowledge, 18 June 1779,” Founders Online, National
Archives.
2
For endowment data, see James Murphy, “Rich Schools, Poor Recruiters,” Education Reform Now
(February 2021). State funding figures based on analysis of IPEDS data for sources of revenue in 2018.
3
Average Pell share and Black student share calculated from an analysis of IPEDS enrollment data for
2016-18.
4
State Council of Higher Education for Virginia, Pathways to Opportunity: The Virginia Plan for Higher
Education (2020).
5
See Virginia code, Title 23.1.
6
The average award totals are for undergraduates attending two- or four-year public institutions in 2018-19,
the most recent year for which data are available from the State Council of Higher Education of Virginia
(SCHEV). See Table FA13: VA Student Financial Assistance Program Report for the average award to
students attending public institutions. SCHEV does not report separate average award amounts for the
Commonwealth and VGAP programs.
7
Share calculated from the sum of all undergraduate Tuition Assistance Grants in 2018-19 found in Table:
FA03: Tuition Assistance Grant (TAG), Award Totals, SCHEV.
8
The average award totals are for undergraduates attending two- or four-year public institutions in 2018-19,
the most recent year for which data are available from the State Council of Higher Education of Virginia
(SCHEV). See Table FA13: VA Student Financial Assistance Program Report for the average award to
students attending public institutions and Table: FA03: Tuition Assistance Grant (TAG), Award Totals for
awards to students at private institutions
9
Students with financial need, as defined by the federal government, are those whose expected family
contribution, determined by completing the FAFSA, is lower than a university’s cost of attendance.
10
A few institutions for which graduation rates were not available in IPEDS were left off the table.
11
Graduation rates based on an analysis of 2019 IPEDS enrollment data.
12
See SCHEV table FA09: Pell Grant Report: 2018-19.
13
Total derived from sum of all undergraduate Tuition Assistance Grants in 2018-19 found in SCHEV Table:
FA03: Tuition Assistance Grant (TAG), Award Totals.
14
State Higher Education Executive Officers Association, State Profile: Virginia, State Higher Education
Finance (SHEF) Report (2020).
15
SHEF Report (2020), see figure 3.2. Alaska does not have community colleges, so Virginia is ranked 44th
out of 49 states.
16
Joint Legislative Audit and Review Commission, Addressing the Cost of Public Higher Education in
Virginia (2012).
17
IPEDS data. All dollar amounts adjusted to $2019, using the Consumer Price Index.
18
See chart 7 in SCHEV’s Higher Education Funding: Baselines and Trends in Education and General
Support (2020) report.
19
https://www.cavalierdaily.com/article/2020/12/ucwva-the-university-has-the-money
20
Nick Anderson, Susan Svrluga, and Danielle Douglas-Gabriel, “Lawmakers want to know why U-Va.
stockpiled billions but still boosted tuition,” Washington Post, August 25, 2016.
2421
James Bacon, “UVA Builds Scholarship Endowment to Half-Billion Dollars,” Bacon’s Rebellion, December
13, 2020. As of 2019, the Strategic Initiative Fund had provided approximately $640 million in funding to
programs at UVA.
22
Net prices are calculated using only those students who apply for federal financial aid. Net price figures
therefore leave out some students. A number of these students--particularly at expensive private colleges
and universities, such as Washington and Lee University and the University of Richmond--will be wealthy
enough to simply pay the full or discounted sticker price and thus qualify for no grants and take out no
federal loans, which results in net prices that are actually significantly lower than the average price paid to
attend. According to the Department of Education’s College Scorecard, only 23% of students at
Washington and Lee receive federal loans, even though the published cost of attendance there is over
$70,000.
23
Data for 2018-19 taken from IPEDS. IPEDS reports net price and headcount by income for first-time, full-
time students only. There are almost certainly thousands more continuing students from this income
bracket enrolled at these four universities. Peer institutions were chosen based on region and similar
academic profiles as derived from College Results Online.
24
Based on an analysis of IPEDS data.
25
Based on an analysis of single year undergraduate headcounts in IPEDS.
26
Data from SCHEV Table EOM 01T: Debt Profile: Total Loans 5 Years and includes private and federal
Student loans and PLUS loans.
27
See SCHEV Table EOM 04: Debt Profile: Student Loans by Race 5 Years.
28
See SCHEV Table EOM 04: Debt Profile: Student Loans by Race 5 Years.
29
Ben Miller, “New Federal Data Show a Student Loan Crisis for African American Borrowers,” Center for
American Progress (2017).
25www.edreformnow.org
Michael Dannenberg is Vice President for Strategic Initiatives and Higher Education Policy at Education Reform Now.
James Murphy is Senior Policy Analyst at Education Reform Now. Katlyn Riggins is Policy Analyst at Education Reform
Now. Education Reform Now is a national think tank and non-profit advocacy organization
that focuses on education equity.You can also read