HISTORY, HABITAT USE AND MANAGEMENT OF BISON ON CATALINA ISLAND, CALIFORNIA
←
→
Page content transcription
If your browser does not render page correctly, please read the page content below
HISTORY, HABITAT USE AND MANAGEMENT OF BISON ON
                  CATALINA ISLAND, CALIFORNIA
  RICK A. SWEITZER1, JUANITA M. CONSTIBLE2, DIRK H. VAN VUREN3, PETER T. SCHUYLER4
                                                     4
                               AND FRANK R. STARKEY

              1
                Department of Biology, University of North Dakota, Grand Forks, ND 58202
                                       richard_sweitzer@und.nodak.edu
      2
        School of Renewable Natural Resources, Louisiana State University, Baton Rouge, LA 70803
           3
             Wildlife, Fish, and Conservation Biology, University of California, Davis, CA 95616
                       4
                         Catalina Island Conservancy, P.O. Box 2739, Avalon, CA 90704

Abstract—Millions of American bison (Bison bison) once roamed prairies and other habitats of North
America until widespread hunting in the 1800s decimated the species. Intensive conservation efforts in the
early 1900s averted extinction by protective management and reintroductions to parks and natural areas.
Related to their wide ecological tolerances, some bison populations now occur in areas not historically
occupied by the species, including Catalina Island. In the period between 1924 and 1935, 24 bison were
introduced to Catalina Island. By protective management and natural reproduction, the Catalina bison herd
grew until nearly 400 animals roamed the island by 1969, when a program of regular culls was
implemented to maintain a target population of 250–350 animals. The native fauna of Catalina Island did
not include large ungulates, which has led to concern regarding the ecological effects of bison on native
plants and animals. The Catalina Island Conservancy, a non-profit organization that owns and manages
88% of the island, has been actively working to protect and restore native flora and fauna including the
removal of nonnative species. Notwithstanding the Conservancy’s conservation mission, bison are
culturally and economically significant to island residents, therefore making management of bison on
Catalina Island controversial. Herein we review the history of bison on Catalina Island, provide detailed
information on patterns of historic and current habitat use, qualitatively evaluate the importance of bison
for tourism, and review multiple options for future management based on an island-wide model of carrying
capacity and a conservation agenda of restoring the native flora and fauna of the island.

Keywords: bison, carrying capacity, conservation, restoration, tourism

                  INTRODUCTION                         diversity of habitats ranging from boreal forests to
                                                       desert regions (Van Vuren 1987). Associated with
    The history of the American bison (Bison           their wide ecological tolerances, some bison
bison) in mainland North America is well known.        populations now occur in areas not previously
Prior to European settlement, the species was          occupied by the species, including Catalina Island,
widely distributed in large numbers across prairie     California.
grasslands and other habitats. Following                   Bison are not native to coastal regions of
indiscriminate slaughter in the 1800s only a few       California or the Channel Islands (Roe 1970).
hundred remained by 1900 (Shaw 1999).                  Additional historical detail will follow, but
Protective management and intensive conservation       between 1924 and 1935, 23 bison were introduced
efforts in the early 1900s averted extinction,         to Catalina Island to film a movie (Gingrich 1974),
however, when small populations of bison were          and the small bison herd increased until around 400
reestablished in numerous national, state, and         bison roamed across the island by the 1960s (Lott
provincial parks in the United States and Canada,      and Minta 1983a). Due to concerns of overgrazing
and on some private ranches (Berger and                by livestock, bison, and other nonnative herbivores
Cunningham 1994). Although bison are usually           (feral pigs [Sus scrofa] and feral goats [Capra
considered a prairie species, they occupied a          hircus]), a culling program was implemented in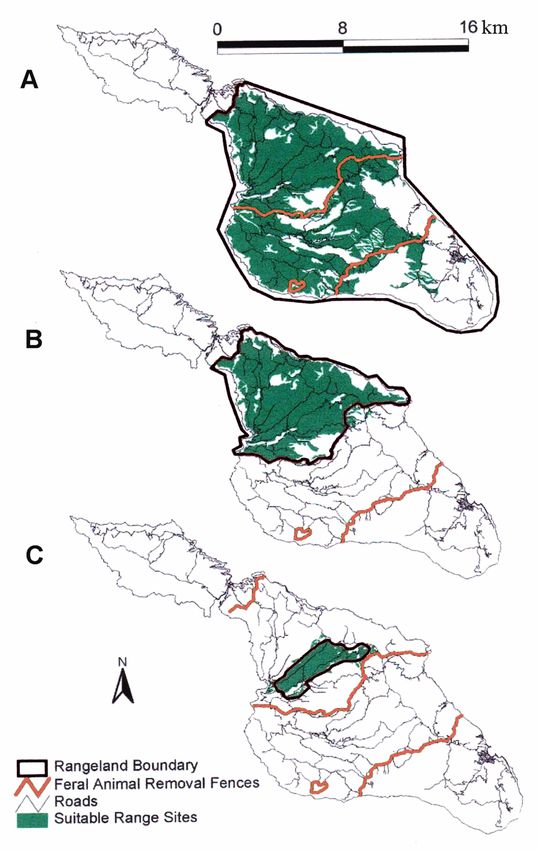
232            SWEITZER ET AL.

1969. Bison are periodically captured in corrals       management options that incorporate both
and shipped off the island to buyers in different      ecological and socio-economic consequences of
parts of the United States. Since 1970 the Catalina    maintaining a free-ranging bison herd on the
bison herd has been actively managed to maintain a     island.
smaller population and minimize their potential             To develop long-term and sustainable
negative effects on native plants and animals.         approaches to bison management, our objectives in
     The introduction of nonnative species to new      this study were to (1) provide a detailed account of
areas is an important conservation problem in          the history of bison on Catalina Island, (2)
general but it is especially problematic on islands    summarize and compare patterns of habitat use
(Savidge 1987, Coblentz 1990, Cree et al. 1995),       between the 1970s and present, and (3) review
which typically have higher proportions of             different management approaches for bison on
endemic species than mainlands and are more            Catalina Island that vary by emphases on economic
prone to invasion (Lodge 1993). Native organisms       and conservation considerations. We anticipate
on islands are particularly vulnerable to pressures    that a complete historical account of bison on
exerted by introduced species because they             Catalina Island will help clarify confusion
evolved in relative isolation under reduced            regarding the population while providing important
interspecific competition, grazing, and predation      context for future studies. We also present a brief
(Bowen and Van Vuren 1997). Related to                 background on tourism as a form of recreation on
increased recognition of ecological problems           Catalina Island, including a qualitative evaluation
caused by introduced species, the Santa Catalina       of the economic importance of bison for tourism.
Island Conservancy (hereafter Conservancy)             Finally, because detailed ecological research on the
implemented an active restoration program in the       Catalina bison population was conducted in the
1990s that included efforts to control weedy plants    1970s prior to establishment of fences aiding feral
and eradicate feral goats and pigs (Schuyler et al.    pig and feral goat removal, a comparison of
2002). Bison are one of two remaining widespread       historic and recent patterns of habitat use may
free-ranging nonnative ungulates on the island; the    reveal whether the fences restrict or focus bison
other is mule deer (Odocoileus hemionus), which        activities in some areas.
were introduced to the island in the 1930s and are
currently abundant. Because of their size,
nutritional needs, and gregarious nature, bison                         STUDY AREA
have the potential to substantially influence native
plant and animal communities on Catalina Island        Description
(Damhoureyeh and Hartnett 1997, Fritz et al.                Catalina Island is a 194-km2 island located 40
1999).                                                 km south of coastal Los Angeles, in Los Angeles
     The small town of Avalon on Catalina Island       County. Elevation on the island ranges from sea
was already a tourist destination in the early 1900s   level to 640 m with a topography dominated by a
when bison were introduced, and as the bison herd      northwest-southeast mountain range containing a
grew it was rapidly embraced culturally and as         series of lateral canyons (Schuyler et al. 2002). The
another draw for tourism. Currently over one           climate is Mediterranean with relatively mild
million visitors visit Catalina Island yearly,         temperatures throughout the year and a long-term
attracted by the diverse recreational opportunities,   mean annual precipitation of 290 mm mostly
multiple hotels and resorts, and wildlife viewing.     occurring between November and April
Many tourists and residents take advantage of          (Schoenherr et al. 1999, Santa Catalina Island
Jeep® or bus tours, bicycling routes, hiking trails,   Conservancy 2002). There are three major upland
and campgrounds to visit the island interior where     habitat types on the island: (1) coastal sage scrub,
it is advertised they will have the opportunity to     characterized by coastal sage (Artemisia
observe American bison. Thus, and although bison       californica) and prickly pear cactus (Opuntia
are not native to Catalina Island, the combined        littoralis); (2) grassland, dominated by exotic
cultural and economic significance of the species      annual grasses and forbs, such as wild oats (Avena
requires that the Conservancy consider herd            fatua) and storksbill (Erodium spp.), interspersed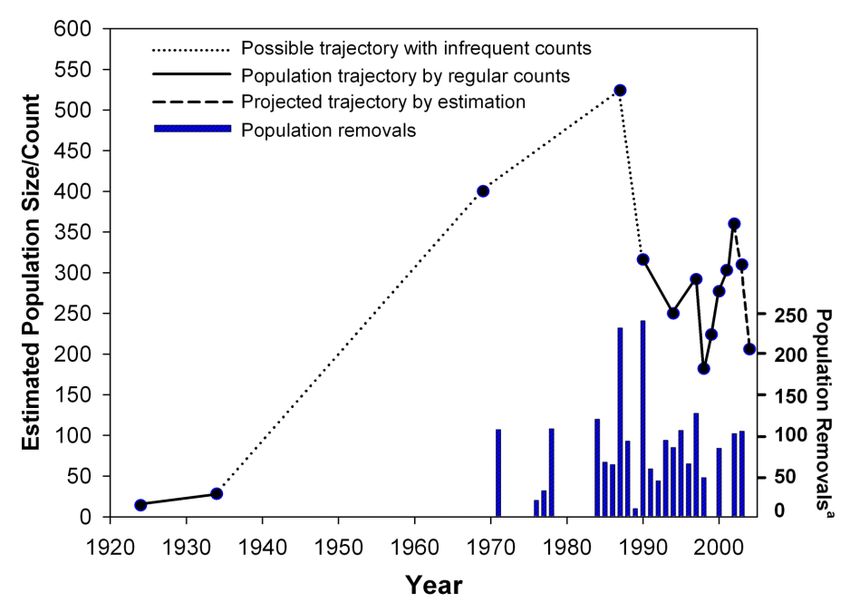
BISON ON CATALINA ISLAND                233

with native bunch grasses (Nasella spp.); and (3)       impacts and disturbances promulgated by bison,
island chaparral, represented by evergreen and          feral pigs and goats (Baber and Coblentz 1986).
drought-resistant shrubs and low trees such as          After 1970 culling was used to maintain lower
island scrub oak (Quercus pacifica) and lemonade        bison herd levels and several early control efforts
berry (Rhus integrifolia). Riparian plant               directed at feral pigs and feral goats were initiated
communities are limited to a few permanent or           in the 1980s and early 1990s (reviewed by
ephemeral streams in relatively deep lateral            Garcelon et al. 1993). In the mid-1950s, the
canyons and marshy wetland areas adjacent to            California Department of Fish and Game
artificial water impoundments (ponds) and one           implemented a hunting program designed to
natural lake. Representative riparian plant species     control the burgeoning mule deer population
include cottonwood (Populus trichocarpa), willow        (Melody and Garcelon 1999). This program has
(Salix spp.) various sedges and rushes, and mule fat    produced sporadic results and mule deer are
(Baccharis pilularis; Knapp 2002).                      considered a potential threat to many natural
                                                        resources on the island. In the mid 1970s the island
Ecological Resources                                    was considered to be recovering from overgrazing
     Los Angeles County has recognized 22               by domestic livestock. More recently the island can
Sensitive Ecological Areas on Catalina Island           be considered as recovering from the activities of
(Ecological Restoration Department Map of               feral goats and feral pigs, following an intensive
Catalina Island). Sensitive Ecological Areas (SEAs)     feral animal removal program that was initiated in
are diverse but may include habitat for rare or         the late 1990s and has resulted in the island-wide
endangered species, represent regionally restricted     eradication of feral goats by 2002 and nearly all
biotic communities/assemblages, encompass areas         feral pigs by late 2003 (Schuyler et al. 2002).
of important habitat for species or groups of species
for breeding, nesting, or migration, represent          Tourism
vestiges of undisturbed biotic communities, or are           The potential for Catalina Island as a
unique ecological areas of particular scientific        destination for tourism was recognized in the late
interest (Anonymous 2002). Distributed across the       1880s by George Shatto who purchased the island
island and within many of these 22 SEAs are six and     with the goal of developing it as a resort. Shortly
26 extant species of plants endemic to Catalina         thereafter the Banning Brothers purchased Catalina
Island and the Channel Islands, respectively            Island, formed the Santa Catalina Island Company,
(Thorne 1976, Nixon and Muller 1994, Junak et al.       and established the island as a tourist destination
1995), and five endemic subspecies of terrestrial       by developing hotels and campgrounds and
vertebrates (Collins and George 1990, Schoenherr        initiating a passenger steamer service to the island.
et al. 1999).                                           William Wrigley Jr. subsequently purchased the
                                                        island in 1919 with plans to further develop it as a
Introduced Herbivores                                   resort. Wrigley also held a strong conservation
    Although no large native grazing animals            ethic, and under his and subsequent family
historically occurred on Catalina Island, multiple      members’ guidance the Island Company initiated
species of domestic and feral ungulates were            various conservation practices from the 1920s to
established during the past two centuries. Horses       the 1970s. In 1972 the Wrigley and Offield
(Equus caballus), domestic cattle (Bos taurus), and     families formed the non-profit Santa Catalina
sheep (Ovis aries) were introduced to the island in     Island Conservancy, which now owns and oversees
the 1800s, and ranching operations involving these      conservation and restoration-oriented management
ungulates were active in the island interior by the     of 88% of Catalina Island. The mission of the
1860s. All sheep were removed in the early 1920s.       Conservancy is to serve as responsible stewards of
Bison were first introduced in 1924 and mule deer       the island through a balance of conservation,
and feral pigs were introduced in the early and mid     education, and recreation. Recreation includes
1930s, respectively. After domestic cattle              tourism, and in association with the Island
operations in the island interior ceased around         Company and other businesses the Conservancy
1960 there was growing concern over grazing             provides visitors the opportunity to tour the island
234 SWEITZER ET AL.
interior by bus, Jeep®, bicycle, or on foot. A small estimate body masses for animals of different age
airport near the middle of the island (Airport-In- and sex. Whenever possible, records from sales
The-Sky) is used by many to visit the island by receipts and shipping receipts were used to cross
private airplane. reference information from roundups and
The Island Company and Adventure Tours determine actual numbers of animals removed
offer several short bus tours around the Avalon from the island. Data on known bison mortalities
area. In addition, the Inland Motor Tour takes were compiled from Conservancy records, direct
many visitors into the interior of the island where observation, and reports from Conservancy
advertisements highlight the opportunity to view personnel and volunteers. Data from literature
bison. This 45 km tour leaves Avalon via the main references, Conservancy records, and periodic
road to the Isthmus and includes stops at the censuses were used to qualitatively track the size of
Airport-In-The-Sky and El Rancho Escondido, the bison population from the 1930s to present. In
both located in zone 2 (see below and Fig. 1). recent years, multiple censuses of the bison herd
Bison are often observed at several points along were often undertaken. Data on estimated
this main road but frequently congregate in and populations for years with multiple counts were
around a shallow basin-like area near the Airport- taken as the number of bison enumerated in the late
In-The-Sky. Bison are also regularly observed summer-fall period after adult cows had produced
along the main road near El Rancho Escondido, offspring. No census or count data were available
where sage scrub habitat was cleared and after August 2002 so we estimated the number of
converted into grasslands when livestock bison likely present in August 2003 by subtracting
operations were active in the island interior. the numbers of animals shipped from the island in
October 2002 and adding in an estimated number
of newborn calves based on average pregnancy
METHODS
rates for adult female bison on Catalina from serum
progesterone levels (Sweitzer et al. 2003).
History of Bison on Santa Catalina Island
Similarly, we estimated the projected number of
We used a variety of mostly unpublished
animals present in January 2004 by subtracting the
information to evaluate changes in bison
number of animals shipped off in November 2003
population numbers over time. Records from
from the estimated August 2003 number.
periodic roundups were reviewed to estimate the
number of bison shipped off the island and to
Habitat Use
Information on habitat use by bison on Catalina
Island was generated to understand how recently
established cross-island fences may be altering
bison movements and to identify areas where bison
concentrate their activities. Bison currently have
relatively unrestricted access to all areas of the
island east of the Isthmus, where prior studies
indicated they focus their foraging, wallowing and
loafing activities in grassland, coastal sage scrub,
island chaparral, and riparian habitats (Fig. 1; Lott
and Minta 1983a, Galland 1989). Riparian habitats
on the island include riparian corridors and marshy
wetland areas associated with artificial water
impoundments and Echo Lake (the only natural
lake on the island). Bison were restricted from
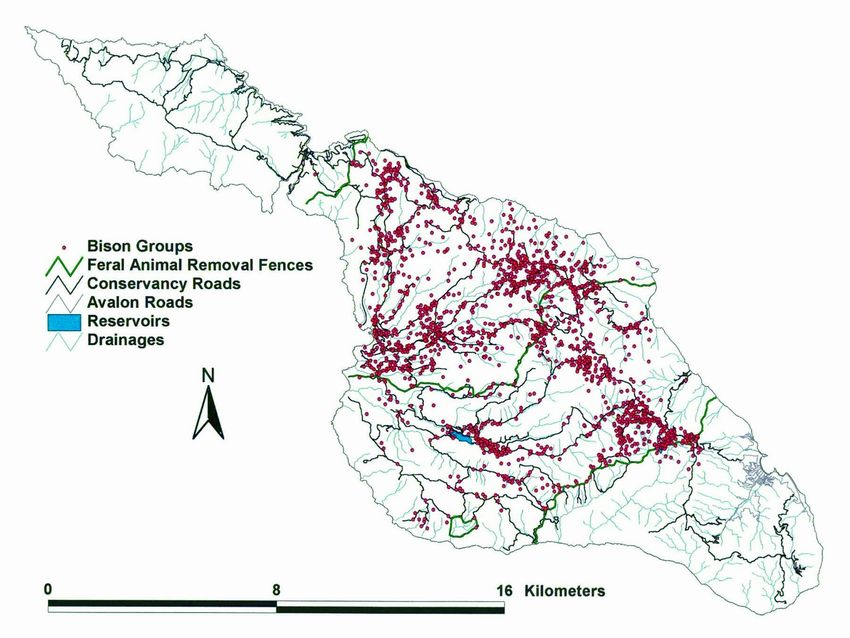
Figure 1. Feral animal removal zones on Catalina Island, CA as moving west of the Isthmus (zone 1) in the early
delineated by three cross-island fences. Zone 1 is bison free 1990s by a new cross-island fence immediately east
whereas zones 2, 3, and 4 are occupied by bison. Figure of the Isthmus (Fig. 1). Also, between December
modified from Schuyler et al. (2002). 1998 and July 1999 two more cross-island “feralBISON ON CATALINA ISLAND 235
animal removal (FAR) fences” were established in locations and estimated offset angles and distances
support of a major eradication effort for feral pigs to bison groups. Coordinates for observer locations
and feral goats (Schuyler et al. 2002). The FAR were obtained using a Garmin GPS III Plus
fences delimited four hunting zones from the (Olathe, Kansas, USA), whereas a laser range
northwestern area of the island west of the Isthmus finder, compass, and clinometer were used to
to the southeastern area of the island including measure offset distances and slopes to the
Avalon (Fig. 1). Although FAR fences include approximate centers of bison groups. ArcView was
three modified cattle guards designed to permit used to (1) assign bison groups to one of 17 habitat
bison to move among zones 2, 3, and 4, crossing classes (Appendix I), (2) measure the distance of
points are limited and FAR fences may have groups to the nearest semi-permanent water (horse
restricted bison movements and habitat use after troughs, Echo Lake, artificial reservoirs), and (3)
1999. calculate slope for each group observation. We
Data on general aspects of habitat use by bison used log-linear models (Sokal and Rohlf 1981) to
prior to 1999 were summarized from a review of assess seasonal shifts in bison use of habitat,
the published literature, whereas data on current distance from water, and slope.
habitat use were collected as part of a larger study Although bison group observations provided
from January 2001 to May 2003 on the population data on general patterns of habitat use, this method
ecology and ecological effects of bison on Catalina provided limited insight into habitat use relative to
Island (Sweitzer et al. 2003). During the period availability because of potential bias associated
from February 2001 to August 2002 we collected with visibility from roads, diurnal observations,
data on locations of bison groups noted during a and unequal sampling effort. To estimate habitat
variety of research activities, and performed selection by bison on the island we conducted
transect-based surveys for dung to evaluate habitat multiple bison dung belt transects (2 m × 100 m)
use. For all bison groups observed over the course across areas of the island with a recent history of
of five periodic ground-based censuses, regularly use by bison (i.e., zone 1 was not included; Fig. 1)
scheduled road surveys, and ad libitum and within three focal habitats: grasslands, scrub
observations, we recorded information on the oak-dominated island chaparral (SOIC), and
location, group size, and age and sex composition coastal sage scrub. Activity observations from the
of bison groups. We discriminated among four age bison group data indicated that bison rested and fed
and sex classes (calf, yearling, cow, bull) based on in the same proportions in each habitat type, so it
size, color, horn shapes, conformation and other was unlikely that fecal deposition rates differed
traits (Berger and Cunningham 1994) and sex was between habitats by activity (Litvaitis et al. 1994).
assessed for yearlings whenever possible but not Furthermore, dung piles represent nocturnal as
for calves. The five censuses occurred between well as diurnal habitat use (Norland et al. 1985).
April 2001 and August 2002 when we From group observations we determined that most
systematically searched island zones 2, 3, and 4 bison (95%) focused their activities in areas with
from the ground along a network of roads, 90% to
July 2002 when we noted the primary habitat the cell area, two transect start points within that
association for each group observed and estimated habitat type were chosen. All bison dung piles
their geographic locations by applying Cartesian along each dung transect were counted regardless
geometry to data on UTM coordinates for observer of age or state of decomposition.236 SWEITZER ET AL.
For those transects where habitats were a
mosaic of multiple plant communities, we noted
the major habitat type (>60% of the transect and
immediate area) and the minor habitat type (20–
40% of the transect and immediate area). We
measured slope and aspect with a clinometer at
three points on each transect (0-m, 50-m, and 100-
m) and visually ranked density of woody
vegetation on a scale of 1 (open) to 5 (extremely
dense). During final analyses we collapsed minor
habitats into two categories (grassland, shrubby/
wooded) and density of vegetation into three
categories (open, moderate, dense). Chi-squared
tests (Zar 1999) were used to identify habitats
utilized (1) significantly more often than expected
relative to availability (primary range), (2) in
proportion to availability (secondary range), and
(3) less than expected relative to availability
(marginal range). Generalized Linear Models
(Systat 8.0; SPSS Inc. 1998) were used to examine
effects of habitat, slope, aspect, distance from
water (obtained with ArcView GIS 3.2), and
density of vegetation on the amount of bison
activity as indexed by number of dung piles.
Bison Management
Notwithstanding their cultural and economic
significance, future management of bison on
Figure 2. Maps of Catalina Island identifying three potential
Catalina Island should be compatible with the goal
approaches to management of bison on carrying capacities.
of maintaining viable native plant and animal Option A is the “status quo” approach with bison continuing to
populations and the different ecological processes range over zones 2, 3, and 4. Option B would restrict bison to
that support those species over the long term. In the area defined as zone 2, including key portions of the Inland
association with research by Sweitzer et al. (2003) Motor Tour. Option C would restrict bison to a small portion of
we developed a range of management options for zone 2. Suitable range sites were areas with moderate to no
erosion on slopesBISON ON CATALINA ISLAND 237
designed to allow for altering the proportion of adults, 25% were seniors and 25% were children.
plant material that could be eaten and still preserve Notably, visitors take Inland Motor Tours and
sufficient leaf area for plant recovery. By varying Jeep® EcoTours for other reasons besides seeing
this “allowable use factor” we estimated the bison, and our purpose for summarizing these data
carrying capacity of bison in different areas of the was to provide a qualitative appreciation of bison-
island under a standard livestock grazing related tourism. For example, at least six other
management regime (most or all consumable plant concessionaires offer tours into the interior of
material considered available for bison use), Catalina Island but we did not have ready access to
moderate grazing regime (equal amounts of passenger ticket sales/prices, nor did we attempt to
consumable plant material available to bison and compile data on sales of bison-related gifts, cards,
native herbivores/consumers), and a light grazing etc., that are popular in the many shops in Avalon
regime (25% of consumable plant material and at the Airport-In-The-Sky.
available to bison and 75% reserved for native
herbivores/consumers; Sweitzer et al. 2003).
RESULTS
Importance of Bison for Tourism
Although it is difficult to assign economic Management History
value to the cultural significance of bison, it is After the initial introduction of 14 bison to
possible to appreciate their value for tourism using Catalina in 1924, a number of additional animals
passenger and ticket sale data for bus and Jeep® were transported to the island as replacements for
tours. We used Conservancy records to summarize illegally killed animals or to improve the genetics
data on the annual numbers of passengers on Inland of the herd. In fall 1934, ten years after the original
Motor Tours and Jeep® EcoTours for the period 14 animals were introduced, an additional nine
from 1999 to 2002. We calculated the estimated bison were brought to the island to augment the
annual income from these tours based on current herd (Table 1). Between 1934 and 1969 two bison
individual ticket prices (http://scico.com/html/ were known to have been illegally shot, and the
discovery_land_tours_fr.html, accessed November Island Company required the perpetrators to
2003). Ticket prices for the Inland Motor Tour vary replace the animals with bison purchased and
by age; tickets for adults and seniors are $47.25 and shipped from the mainland (Gingrich 1974). In
$42.50, respectively, whereas tickets for children 1969 and 1971 a combined total of 22 animals
are $23.75. To estimate monetary income from the were introduced from different mainland areas to
annual numbers of passengers on the Inland Motor improve herd genetics, and then 12 more mainland
Tour we calculated a weighted average ticket price bison were added to the herd in 1996 for similar
by assuming that 50% of annual passengers were purposes (Table 1).
Table 1. Summary of available data on numbers of bison added to the bison herd on Catalina Island (including animals from the
original introduction) during the period from 1924 to the present. Data were compiled from Santa Catalina Island Company records,
Conservancy records, and other documents or publications.
Male Yearling Yearling Adult Unknown
Year calves males females males sex/age Totals Source of bison
1924 - - - - 14 14 Unknown
1934 - - - - 9 9 Unknown
1934 - - - - 1 1 Unknown
1968 - - - - 1 1 Unknown
1969 15 - - - - 15 Gillette, Wyoming
1971 - 7 - - - 7 Moiesa, Montana
1996 - 2 4 - - 6 Palomar Mountain, California
1996 - 6 - - - 6 Loretta Leavitt
Totals 15 15 4 - 25 59238 SWEITZER ET AL.
Table 2. Summary of available data on minimum numbers of bison captured and shipped back to the California mainland from
Catalina Island from 1969 to November 2003. Data were compiled from Santa Catalina Island Company records, Conservancy
records, and various other documents.
Males Females Unk. sex
Year Calves Yearl Adult Unk Calves Yearl Adult Unk Calves Yearl Adult/unk Total
1969–73 - - - 97 - - - 10 - - - 107
1974 - - - - - - - - - - 20 20
1976 - - 27 - - - 5 - - - - 32
1977 - 70 - - - 32 6 - - - - 108
1978 - - "Minor shipment of young bulls" - - - - Unk
1979 - - "Substantial heifer sale" - - - - - Unk
1980 - - "Buffalo sales lower than anticipated" - - - Unk
1984 - - - - - - - 65 - 55 - 120
1985 - - 36 - - - - - 21 10 - 67
1986 - - 8 - - - 23 - 5 28 - 64
1987 - - 59 - - - 57 - - 116 - 232
1988 - - 49 - - - 44 - - - - 93
1989 - - 6 - - - 4 - - - - 10
1990 - - 15 - - - 68 - 26 132 - 241
1991 - - 7 - - - 13 - 0 39 - 59
1992 - - 20 - - - 5 - 0 19 - 44
1993 - 7 15 - - 56 16 - - - - 94
1994 - 29 17 - - 30 9 - - - - 85
1995 - 9 27 - - 2 25 - - - 43 106
1996 - 14 7 - - 18 26 - - - - 65
1997 3 58 18 - 4 24 30 - - - - 127
1998 - 14 4 - - 20 8 - - - 2 48
2000 - 9 29 - 3 9 34 - - - - 84
2002 13 1 25 - - 4 59 - - - - 102
2003 - - 30 - - 17 58 - - - - 105
Column 16 211 399 97 7 212 490 75 52 399 65 2,013
totals
We uncovered relatively limited information on In 1969 a culling program was developed to
the estimated size of the bison herd on Catalina reduce and stabilize the herd, which marked a shift
Island from shortly after their introduction until the from protective management to managing bison at
mid 1990s. Conservancy records and several lower herd levels to protect against overgrazing
references in the literature suggested that the bison (O’Malley 1994). Between 1969 and 1977
population had increased to 400 animals by 1969 approximately 267 bison were sold and shipped to
and then further grew to a probable all time high of the mainland (Table 2). Records on bison shipments
around 524 animals in 1987 (Fig. 3; Gingrich 1974, were sparse between 1978 and 1983, but several
Lott 1981, Lott and Minta 1983a). After the mid notes we did find suggested that significant
1990s and including this study, censuses or counts numbers of animals were removed. Records were
of the bison herd were more regular (Table 3). From more complete from 1984 to 2003 when a minimum
the mid 1990s to fall 2003 active management total of 1,745 bison were sold and shipped off the
efforts maintained the herd around 275–300 island (Table 2). Early on in the culling program
animals (Fig. 3). The fall 2003 reduction to an predominantly young bull bison were rounded up
estimated 206 animals marked the start of a program for removals, whereas in later years approximately
to manage the herd size at 150–200 animals. equal numbers of male and female bison wereBISON ON CATALINA ISLAND 239
removed (Table 2). Data on natural or management-
related bison mortalities were very limited except
for between 1994 and 2002 when managers
reported 49 bison died or were euthanized due to
poor health or injury.
Tourism
Between 1998 and 2002 an average of 102,824
tourists took the Inland Motor Tour to interior
Catalina Island, which generated an estimated
$4,133,541 annually over the period (Table 4).
Similarly, as part of Jeep® EcoTours from 1999 to
2002 an average of 1,138 individuals visited the
Figure 3. Estimated trend for the size of the bison population interior of Catalina Island each year for an estimated
(line), and minimum population removals of bison (columns) average of $89,882 in annual sales (Table 4). For the
on Catalina Island, CA. Records on the numbers of bison on the four years with data for both Inland Motor Tours
island from 1935 to the mid-1980s were limited. Methods used
and Jeep® EcoTours, there were an estimated
to estimate bison numbers after 1997 were primarily ground-
based counts using the island road network. Minimum 104,435 individual tourist excursions into the island
population removals were based on sales and shipping records interior, generating around $4,242,412 annually
(see Methods section). from these types of vehicle-based tours (Table 4).
Table 3. Summary of available census/count data for bison on Catalina Island from 1924 to August 2002. Data were compiled from
Santa Catalina Island Company records, Conservancy records, and various other documents. See Methods for additional details.
Yearl Adult Yearl Adult Unk sex Unk sex Unk sex/
Year Period/ month male male female female calves/yearl adults age Total
1924 December - - - - - - 14 14
1934 Summer - - - - - - 19 19
1934 Fall - - - - - - 28 28
1987 Summer - - - - - - 524 524
1990 February - - - - - - 316 316
1994 December - - - - - - 250 250
1997 August - - - - 89 203 0 292
1998 January - 24 - 84 38 - 50 196
1998 September - - - - - - 182 182
1998 September - - - - - - 118 118
1999 April - - - - - - 166 166
1999 November 15 50 18 109 19 - 13 224
1999 December 27 41 13 120 - - - 201
2000 April - 48 - 141 33 - 55 277
2001 April 3 50 13 128 38 3 44 279
2001 August 16 57 14 136 67 3 10 303
2001 November 7 57 3 123 64 10 36 300
2002 April 7 62 16 132 23 20 72 332
2002 August 14 95 14 157 62 12 6 360
2003a August - - - - - - - 310
2004b January - - - - - - - 206
a
Estimated by subtracting the numbers of animals shipped off in October 2002 and adding in the estimated number of newborn
calves in spring 2003 based on the estimated pregnancy rates of adult female bison from data on serum progesterone levels (Sweitzer
et al. 2003).
b Projected by subtracting the numbers of bison that were shipped off the island in November 2003.240 SWEITZER ET AL.
Table 4. Summary of recent data on tourist visits to the interior of Catalina Island on the Inland Motor Tour bus or by Jeep®
EcoTour. At least six other companies provide tourist access to inland areas of Catalina Island as part of other recreational activities.
Data are from Conservancy records.
Inland Motor Tours Jeep® EcoTours Combined tours
Year Total people Ticket sales ($)a Total people Ticket sales ($) Total people Ticket sales ($)
1998 100,935 4,057,587 - - - -
1999 113,053 4,544,731 1,102 87,058 114,155 4,631,789
2000 111,337 4,475,747 1,118 88,322 112,455 4,564,069
2001 90,588 3,641,638 914 72,206 91,502 3,713,844
2002 98,209 3,948,002 1,417 111,943 99,626 4,059,945
Averages 102,824 4,133,541 1,138 89,882 104,435 4,242,412
a
Estimated ticket sales were calculated based on advertised ticket prices in November 2003 (http://scico.com/html/
discovery_land_tours_fr.html). Sales estimates for Inland Motor Tours were calculated as a weighted average of ticket prices for
adults, seniors, and children (see Methods).
Current Habitat Use Haypress reservoir into zone 4, the activities of
Data on locations of 2,145 groups of bison bison were focused in the central portion of the
collected from January 2001 to August 2002 island (zones 2 and 3; Fig. 4). The majority of the
indicated an uneven distribution of bison activity bison groups (98%) were observed in zones 2 and
across the island (Fig. 4). Because bison were 3, with a heavy concentration of bison activity
restricted from ranging into zone 1 by the FAR around the centers of these areas (Fig. 4).
fence and seldom moved past the cattle guard near Approximately 87% of all bison groups were
Figure 4. Estimated or measured locations of bison groups on Catalina Island, CA noted as part of bison group observations and
five periodic bison censuses or counts from April 2001 to August 2002. See Methods section for details on census/counts.BISON ON CATALINA ISLAND 241
Table 5. Distribution of bison groups (%) in 17 different
physiographic/vegetation types on Catalina Island, California.
Area of Group
Zones 2 and observations
Habitat type 4 (%) (%)
Valley and foothill
18.3 43.6
grassland
Coastal sage scrub 38.5 24.9
Island chaparral 30.2 18.6
Bare ground 9.0 4.8
Non-native herbaceous 0.5 4.8
Developed 1.1 1.0
Non-native chaparral/
0.6 0.6
woodland
Southern riparian
0.5 0.6
woodland
Riparian herbaceous 0.06 0.3
Vernal ponds and
0.1 0.3
reservoirs
Mule fat scrub < 0.01 0.3
Island woodland 0.4 0.1
Coastal marsh < 0.01 0.1
Bare streambed 0.13 0
Figure 5. Seasonal variation in different aspects of habitat use
Maritime cactus scrub 0.01 0 by bison on Catalina Island, CA illustrated by: a) bison group
Coastal bluff scrub 0.26 0 observations in multiple different physiographic/vegetations
Southern beach and dune 0.27 0 classes, b) bison group observations on island terrains of
different slopes, and c) bison group observations at different
distances from water sources. Seasons were three month
periods with Nov.– Jan. and Feb.– Apr. encompassing the wet
recorded in grassland, coastal sage scrub, or island season, and May – Jul. and Aug.– Oct. encompassing the dry
chaparral habitat (Table 5). We did not observe period.
bison groups in bare streambeds, or in patches of
maritime cactus, coastal bluff scrub, or southern
beach and dune habitat. We detected no evidence Scheffé multiple contrast tests indicated that bison
for seasonal shifts in patterns of habitat use (Fig. 5; were more likely to use open areas dominated by
Log-ratio Chi-square = 8.8, df = 15, P = 0.89) or grassland or with a significant grassland
differing slopes (Fig. 5; Log-ratio Chi-square = component and avoided homogeneous areas of
5.9, df = 6, P = 0.43). Similarly, there was no dense woodland or shrub land.
detectable evidence for bison focusing their
activities near water sources (Fig. 5; Log-ratio Chi- Management Options
square = 2.2, df = 12, P = 1.0); bison were Assuming a 2003 status quo management
commonly observed relatively near and far from approach, we estimated that Catalina Island could
water throughout the year including during very support 378 bison under a standard grazing regime,
dry periods. 189 animals under a moderate bison grazing
Analyses of data from 213 dung transects pressure approach, and 95 animals with light bison
indicated that grassland habitats were strongly grazing pressure (Table 7). If bison were confined
preferred by bison, whereas SOIC and coastal sage to zone 2, we estimated carrying capacities of 241
scrub were used less than expected relative to bison under a standard grazing regime, 121 bison
availability (Fig. 6). General Linear Model analysis with the moderate grazing regime, and 60 bison
suggested bison activity in any given area was under a light-grazing regime (Table 7). If bison
related to the major and minor habitat types were restricted to a part of zone 2, we estimated a
present, slope, and vegetation density (Table 6). standard carrying capacity of 33, a moderate242 SWEITZER ET AL.
22 new animals from the mainland in 1969 and
1971 to genetically mix with the island herd and
maintain population health (Lott and Minta 1983a).
Twelve additional bison were brought to Catalina
Island from the mainland in 1996 for the same
reason. Notably, 30 of the 34 bison introduced
from mainland sources after 1934 were males,
reflecting the idea that new male bison might be
more effective for rapidly integrating new genes
into a polygynous breeding population than
females. It is not known how effective these efforts
at population management were for maintaining
genetic diversity in the Catalina bison herd because
no genetic research has been conducted.
Figure 6. mean (±SE) numbers of dung/piles/transect along
multiple belt transects in three habitat types on Catalina Island
Habitat Use
during May and June 2002. Numbers in parentheses above bars
represent the proportion of all group observations observed in There was little evidence for altered patterns of
each habitat type. Habitats were designated as primary or habitat use by bison on Catalina Island related to
marginal based on results of Chi-squared tests comparing use the establishment of FAR fences. Our recent data
to availability. were generally consistent with those of Galland
(1989) and Lott and Minta (1983a, b) from work in
carrying capacity of 17, and a light carrying the 1970s when bison on the island preferred
capacity of nine bison (Table 7). grasslands over scrublands, occasionally foraged
and loafed in scrub oak woodland habitats, and
avoided barren or cultivated areas. More
DISCUSSION specifically, Galland (1989) noted: (1) a strong
positive relationship between group size and
Management History vegetative community type [large groups of bison
In general, very little detailed information was (44 animals) were most often observed in grassland
available on the early history of bison on Catalina and coastal sage scrub habitats], (2) a positive
Island other than that they were to be used while relationship between group size and ponds/water
filming a movie. However, there has been some sources (most large groups of bison were observed
uncertainty regarding which movie bison were
shipped to Catalina Island to be included in Table 6. Results of general linear model analyses assessing
because there was no actual footage of bison in the factors influencing bison activity based on the distribution of
movie “The Vanishing American” that they were dung piles on Catalina Island. The overall model explained
purportedly used for. Nevertheless, the consensus 59% of the variation in bison activity (R2 = 0.59)
is that bison were to be filmed for “The Vanishing Parameter SS Df MS F-ratio
American” (Gingrich 1974). At the time that the Major habitata 14.1 2 7.0 29.4**
bison herd was becoming established on Catalina Minor habitat 2.6 1 2.6 10.7*
Island in the 1930s bison numbers were very low
Slope 3.2 1 3.2 13.5**
throughout their native range (Berger and
Aspect 1.9 8 0.2 1.0
Cunningham 1994). Considering that William
Distance from nearest
Wrigley Jr. held a strong conservation ethic and water
0.2 1 0.2 1.0
was likely aware of problems with diminished Density of vegetation 13.7 2 6.9 28.7**
populations of bison in their native range, it is Error 47.1 197 0.2
conceivable that ranch managers working for the a
Major habitats were defined as the habitat that comprised
Island Company considered the bison on Catalina
>60% of belt transect area whereas minor habitats comprised
Island very valuable for conserving the species. 20–40% of the belt transect area (see Methods).
This idea helps explain the rationale for importing *P < 0.05, **P < 0.001BISON ON CATALINA ISLAND 243
Table 7. Estimates of carrying capacity for bison on Catalina Island under three different management scenarios (see Sweitzer et al.
2003 for additional details).
Management option Standarda Moderateb Lightc
A. Bison in most of Zone 2, 3, and 4 excluding
378 189 95
Avalon (Status Quo)
B. Bison restricted to Zone 2 241 121 60
C. Bison restricted to a portion of Zone 2 along
33 17 9
major tour bus route
a
Assumes that 100% of consumable aboveground annual grass biomass is used by bison.
b
Assumes that 50% of consumable aboveground annual grass biomass is used by bison and 50% is used by native herbivores/
consumers.
c
Assumes that 25% of consumable aboveground annual grass biomass is used by bison and 75% is used by native herbivores/
consumers.
near ponds/water sources), and (3) a significant Island would preferentially graze on protected
negative relationships between group size and south-facing slopes in the spring where new grasses
slope and elevation (most large groups were would emerge earliest due to warm soil
observed on shallow slopes at relatively low temperatures (Berger and Cunningham 1994), but
elevations such as upland benches or valley then shift to riparian areas in the summer as forage
bottoms). Galland (1989) further reported that in upland habitats became depleted and dry and
bison most often occurred on northwest facing senescent (Knapp et al. 1999). Although we noted
slopes, congregated around a few artificial water anecdotal differences in areas frequented by bison
impoundments during rut periods, and that bison among seasons, these small-scale shifts in habitat
cows used thick scrub oak woodland habitats use were not quantitatively significant. Ultimately,
during the spring calving period (Galland 1989). the apparent lack of strong seasonal shifts in
Also of interest was Lott and Minta’s (1983a, b) patterns of habitat use by bison on Catalina Island
indirect suggestion that bison seldom ranged into resulted in relatively heavy and persistent use of a
the southeastern area of the island (zone 4), which small number of open grassland areas with
closely matched our recent observations that very relatively mild slopes including the broad bench
few bison used this part of the island (Fig. 4). Also, near El Rancho Escondido, the open grasslands east
although bison had ready access to the west end of of the Airport-in-the-Sky, and near where the main
the island in the 1970s, Lott (2002) and Lott and road enters zone 2 heading into the island interior.
Minta (1983a, b) reported that they seldom
ventured there because of steep topography, Tourism
limited forage and severe habitat degradation Bison have long been culturally important in
caused by feral goats. the United States, but notably so once their
In portions of their native range, bison imminent extinction was narrowly averted at the
preferentially select open grassland over breaks, end of the 19th century (Lott 2002). Bison numbers
draws, or wooded areas (Norland et al. 1985, in North America were very low but increasing in
Berger and Cunningham 1994, Knapp et al. 1999). 1924 when they were first introduced to Catalina
Data from group observations and dung transects Island. It is therefore not surprising that the
from this study suggested that bison on Catalina growing bison population after 1934 was rapidly
Island behave in a manner similar to their mainland embraced by island residents as a symbol of the
counterparts. However, the lack of seasonal island’s rugged interior, and that the bison herd
variation in patterns of habitat use was somewhat soon became a draw for tourism (Boydston 1998,
surprising. In portions of their native range bison Mecoy 2002). Our summary of recent data on bus
exhibit seasonal differences in habitat use in and Jeep® tours indicate that these two types of
response to a shifting mosaic of forage quality and tourism generate significant sales annually (Table
quantity (Berger and Cunningham 1994, Knapp et 4). Tourists clearly visit the interior of Catalina
al. 1999). We expected that bison on Catalina Island for reasons other than viewing bison, but it244 SWEITZER ET AL.
is likely that fewer would be interested in doing so A third management option is to restrict bison
if bison were not present or if they were present in to a relatively small portion of zone 2
sufficiently low numbers that they would seldom encompassing the Airport-In-The-Sky and El
be observed along tour routes. It is fortunate that Rancho Escondido. Although this area would
several preferred foraging and loafing areas for support between nine and 33 bison depending on
bison are near the Airport-In-The-Sky and El the three grazing regime assumptions, some bison
Rancho Escondido because tourists viewing the would continue to be visible in and around high use
island by bus, Jeep®, and airplane frequently have areas for tourists. A key advantage of restricting
the opportunity to observe them (Fig. 4). animals to this smaller area of the island is that it
would protect all five of the SEAs in zone 2 as well
Management Options as the other 14 SEAs in zones 3 and 4.
Currently bison have relatively unrestricted Disadvantages include the potential for a rapid
access to most of Catalina Island east of the buildup of thatch from nonnative plants, additional
Isthmus (Fig. 4), an area that encompasses 19 fencing to contain the bison within part of zone 2,
different areas considered ecologically sensitive and the need to establish one or several artificial
for Los Angeles County. Our carrying capacity sources of water for the bison.
model suggests that the area of Catalina Island Although the fourth management option of
excluding zone 1 may maximally support around completely removing bison from the island might
378 animals, but only under a standard livestock be appealing from a strict conservation perspective,
grazing regime in which essentially all preferred there are several reasons that this approach may not
aboveground plant biomass is reserved for use by be feasible in the near term. Results of detailed
bison. However because Catalina Island harbors research by Sweitzer et al. (2003) indicated that
multiple native organisms that also rely on plant when small areas of habitat in grasslands and scrub
materials for forage or habitat, we estimated oak woodlands were protected from bison, multiple
carrying capacities under lower levels of bison use species of nonnative grasses and forbs proliferated.
as 189 (moderate bison grazing) and 95 bison (light This was not surprising because data on the diets of
bison grazing). Relatively lower assumptions of bison on the island indicated that they consumed
forage availability and forage use by bison can be the most readily available plants; abundant
thought of as effectively reserving herbaceous nonnative grasses and forbs (Sweitzer et al. 2003).
forage for use by the suite of native species on the It is very likely that the rapid or complete removal
island. Further, lower grazing pressure by bison of bison would result in a buildup of dry plant
based on lower stocking rates would result in less biomass, which might increase the intensity of
impact to the 19 different SEAs in zones 2, 3 and 4. occasional wildfires and damage SOIC habitats and
From the perspective of tourism, the 2003 status endemic island ironwood tree groves. To reduce
quo management approach with lower stocking this threat, a fire management program, including
rates based on the lighter grazing regime periodic controlled burning, would need to be
assumptions would continue to provide viewing considered. Complete removal of the bison would
opportunities. eliminate bison viewing opportunities and
A second management option is to use the potentially reduce the numbers of tourists visiting
existing FAR fences to restrict bison to zone 2. the interior of the island via bus or Jeep® tours and
This would require modifications to two cattle airplanes. We did not attempt to estimate the
guards to render them impassable to bison. The potential loss in tourism-related income by
ecological advantage of restricting bison to zone 2 complete removal of the bison.
is that 67% of the island would be protected from From a global conservation and restoration
grazing and other activities of bison (Coppedge perspective the ecological integrity of native and
and Shaw 1997), and only five of the island’s endemic plant and animal communities on islands
SEAs would be exposed to bison. Restricting bison is especially important. The Channel Islands of
to zone 2 would continue to provide viewing California are estimated to support 26 endemic
opportunities around key areas for bus tours and plants, in addition to the six species of plants
private plane traffic. known to occur only on Catalina Island (Nixon andBISON ON CATALINA ISLAND 245
Muller 1994, Junak et al. 1995). From an ecological reassessments of the impacts of bison will be
perspective, even small numbers of a large-bodied conducted. Notably, the reduction in herd size will
non-native herbivore occupying an insular help protect the natural resources of Catalina Island
ecosystem is cause for concern, and recent research while not eliminating the opportunity for island
has linked changes in Catalina Island’s plant residents and tourists to view and enjoy this
communities to the activities of bison (Sweitzer et culturally significant large mammal that has been
al. 2003). Effective conservation often requires roaming the interior of Catalina Island since 1924.
balancing multiple conflicting interests, and public
acceptance of any change in bison management on
ACKNOWLEDGMENTS
the island will be difficult without serious
consideration of the cultural and economic Funding and logistical support for this study
importance of the species to the island residents. were provided by the Santa Catalina Island
Three of the four possible management options we Conservancy and the University of North Dakota.
reviewed provide for continued bison viewing H. Saldaña, D. Propst, B. Guay and L. Alther
opportunities in the island interior. helped with historical data. M. Kleinfelter and R.
Loggins provided aid with ArcView procedures.
Current Management We had assistance in the field from N. Kadrmas, P.
Based on research results provided by Sweitzer Isakson, J. Costa and D. McDonald. D. McDonald
et al. (2003) on the ecological effects of bison on was especially helpful during multiple aspects of
Catalina Island, the Conservancy held a series of the study and D. Knapp assisted with data on island
meetings in winter and spring 2003 to discuss vegetation. Multiple volunteers and volunteer
bison management and is now beginning to groups aided the research at various times and are
implement several management recommendations listed by name by Sweitzer et al. (2003). P. Novak-
from the study. A goal of maintaining a bison herd Echenique, V. Smothers, and S. Jewett of the
size of 150–200 animals primarily in zones 2 and 3 USDA Natural Resources Conservation Service
was approved by the Conservancy’s Board of provided information on the soils of Santa Catalina
Directors in April 2003. In November 2003, 105 Island and the San Diego area. C. Schwemm, B.
bison were shipped of the island as the first step to Weckerly, and an anonymous reviewed provided
reducing the herd size to 150. Additional animals constructive comments for improving the
will be shipped in 2004 to reach the target of 150 manuscript.
animals. Once the target has been reached, the herd
will be allowed to reproduce until the upper goal of
REFERENCES
200 is approached. In addition, the Conservancy is
beginning to assess the feasibility of contraception Anonymous. 2002. Significant ecological areas
to reduce herd growth, which would also reduce Technical Advisory Committee procedures and
the costs of management. A bison herd size of guidelines, County of Los Angeles Department
150–200 falls within the moderate grazing regime of Regional Planning. Available: http://
approach suggested by Sweitzer et al. (2003) and planning.co.la.ca.us/SEA_proc_guide.doc
presented here under the status quo management [accessed 24 Nov 2003].
option (Table 7). Baber, D.W. and B.E. Coblentz. 1986. Density,
To address some of the potential impacts home range, habitat use, and reproduction in
mentioned by Sweitzer et al. (2003) the feral pigs on Santa Catalina Island. Journal of
Conservancy is preparing a wildland fire Mammalogy 67:512–525.
management plan, will explore additional range Berger, J. and C. Cunningham. 1994. Bison:
management techniques to reduce negative grazing Mating and Conservation in Small Populations.
impacts, and will further explore the relationship Columbia University Press, New York, NY,
between bison grazing and nonnative annual 330 pp.
grasses and forbs. Regular censuses will be Bowen, L. and D. Van Vuren. 1997. Insular
conducted, more accurate herd health and endemic plants lack defenses against herbi-
management data will be collected, and periodic vores. Conservation Biology 11:1249–1254.246 SWEITZER ET AL.
Boydston, B. 20 Feb. 1998. Catalina Island: where Gingrich, R. 1974. The Buffalo of Catalina.
the buffalo roam. The Wall Street Journal; Unpublished document, Santa Catalina
Eastern edition: page 1. Conservancy, Avalon, CA.
Coblentz, B.E. 1990. Exotic organisms – a Junak, S., T. Ayers, R. Scott, D. Wilken and D.
dilemma for conservation biology. Young. 1995. A flora of Santa Cruz Island.
Conservation Biology 4:261–265. Santa Barbara Botanic Garden, Santa Barbara,
Collins, P.W. and S.B. George. 1990. Systematics CA, 397 pp.
and taxonomy of island and mainland Knapp, A.K., J.M. Blair, J.M. Briggs, S.L. Collins,
populations of western harvest mice D.C. Hartnett, L.C. Johnson and E.G. Towne.
(Reithrodontomys megalotis) in Southern 1999. The keystone role of bison in North
California. Contributions in Science 420:1–26. American tallgrass prairie. Bioscience 49:39–
Natural History Museum of Los Angeles 50.
County, Los Angeles, CA. Knapp, D. 2002. Santa Catalina Island vegetation
Coppedge, B.R. and J.H. Shaw. 1997. Effects of mapping project report. Unpublished report,
horning and rubbing behavior by bison (Bison prepared for Santa Catalina Island
bison) on woody vegetation in a tallgrass Conservancy, Avalon, CA.
prairie landscape. American Midland Litvaitis, J.A., K. Titus and E.M. Anderson. 1994.
Naturalist 138:189–196. Measuring vertebrate use of terrestrial habitats
Cree, A., C.H. Daugherty and J.M. Hay. 1995. and food. Pages 254–274. In: Bookhout, T.A.
Reproduction of a rare New Zealand reptile, the (ed.), Research and management techniques
tuatara, Sphenodon punctatus, on rat-free and for wildlife and habitats, Fifth Edition. The
rat-inhabited islands. Conservation Biology Wildlife Society, Bethseda, MD.
9:373–383. Lodge, D.M. 1993. Biological invasions: lessons
Cureton, H.H., J.W. Garlinghouse, L. Leifer and C. for ecology. Trends in Ecology and Evolution
Jensen. 1955. Conservation planning Santa 8:133–137.
Catalina Island April 25–27. Unpublished Lott, D.F. 1981. Sexual behavior and intersexual
report to D. Propst, Santa Catalina Island strategies in American bison. Zeitschrift für
Company, Avalon, CA. Tierpsychologie 56:97–114.
Damhoureyeh, S.A. and D.C. Hartnett. 1997. Lott, D.F. 2002. American bison: a natural history.
Effects of bison and cattle on growth, University of California Press, Berkeley and
reproduction, and abundances of five tallgrass Los Angeles, CA, 229 pp.
prairie forbs. American Journal of Botany Lott, D.F. and S.C. Minta. 1983a. Random
84:1719–1728. individual association and social group
Fritz, K.M., W.K. Dodds and J. Pontius. 1999. The instability in American Bison (Bison bison).
effects of bison crossings on the Zeitschrift für Tierpsychologie 61:153–172.
macroinvertebrate community in a tallgrass Lott, D.F. and S.C. Minta. 1983b. Home ranges of
prairie stream. American Midland Naturalist American bison cows on Santa Catalina Island,
141:253–265. California. Journal of Mammalogy 64:161–62.
Galland, J.C. 1989. Group size dynamics of herding Mecoy, L. 2002. Island of the brown bison. The
animals [Ph.D. dissertation]. University of Sacramento Bee, Sacramento, CA, 3 November
California, Davis, CA. 2002.
Garcelon, D.K., S.J. Escovar and S.F. Timm. 1993. Melody, K. and D.K. Garcelon. 1999. Potential
Feral pig control methods on Santa Catalina impacts of introduced mule deer on the
Island, California. Pages 44–45. In: Tietje, W. ecology of Santa Catalina Island, California.
and R.H. Barrett (eds.), The wild pig in Conservancy research report, Institute for
California oak woodland: ecology and Wildlife Studies, Arcata, CA, 18 pp.
economics. Integrated Hardwood Range Nixon, K.C. and C.H. Muller. 1994. New names in
Management Program, Department of Forestry California oaks. Novon 4:391–393.
and Resource Management, University of Norland, J.E., L.R. Irby and C.B. Marlow. 1985.
California, Berkeley, CA. Determination of optimum bison stocking rateBISON ON CATALINA ISLAND 247
in Theodore Roosevelt National Park, North Eradication of Invasive Species. IUCN SSC
Dakota. Journal of Environmental Management Invasive Species Specialist Group. IUCN,
21:225–239. Gland, Switzerland and Cambridge, UK.
O’Malley, P.G. 1994. The Catalina Conservancy’s Shaw, J.H. 1999. American bison. Pages 342–343.
First 20 Years: Private conservation comes of In: Wilson, D.E. and S. Ruff (eds.), The
age. Pages 149–155. In: Halvorson W.L. and Smithsonian Book of North American
G.J. Maender (eds.), Fourth California Islands Mammals. Smithsonian Institution Press,
Symposium: Update on the Status of Washington, D.C.
Resources. Santa Barbara Museum of Natural Sokal, R.R. and F.J. Rohlf. 1981. Biometry: the
History, Santa Barbara, CA. principles and practice of statistics in biological
Roe, F.G. 1970. The North American buffalo: a research, Second Edition. W.H. Freeman and
critical study of the species in its wild state. Company, New York, NY, 859 pp.
University of Toronto Press, Toronto, Ontario, Sweitzer, R.A., J.M. Constible and D.H. Van
Canada, 991 pp. Vuren. 2003. Population ecology and
Santa Catalina Island Conservancy. 2002. Rainfall ecological effects of bison on Santa Catalina
data available online: http://www.catalina Island, California. Final report to Santa Catalina
conservancy.org/ecology/weather/index.asp Island Conservancy, 113 pp. Available online:
[Accessed 28 December 2002]. http://www.catalinaconservancy.org/ecology/
Savidge, J.A. 1987. Extinction of an island forest research/Bison%20Study.pdf
avifauna by an introduced snake. Ecology Thorne, R.F. 1976. Conservation and management
68:660–668. of the natural flora of Santa Catalina Island.
Schoenherr, A.A., C.R. Feldmeth, and M.J. Unpublished report prepared for the Center for
Emerson. 1999. Natural history of the Islands Natural Areas, Washington, D.C.
of California. University of California Press, Van Vuren, D. 1987. Bison west of the Rocky
Berkeley, CA. Mountains: an alternative explanation.
Schuyler, P.T., D.K. Garcelon and S. Escover. Northwest Science 61:65–69.
2002. Eradication of feral pigs (Sus scrofa) on Zar, J.H. 1999. Biostatistical analysis, Fourth
Santa Catalina Island, Edition. Prentice-Hall, Inc., Upper Saddle
California, USA. Pages 274–286. In: Veitch, C.R. River, NJ.
and M.N.Clout (eds.), Turning the Tide: theYou can also read