The Secret Shame How America's Most Progressive Cities Betray Their Commitment to Educational Opportunity for All - brightbeam
←
→
Page content transcription
If your browser does not render page correctly, please read the page content below

The
  Secret
  Shame
How America’s Most Progressive
 Cities Betray Their Commitment
to Educational Opportunity for All

                              January 2020
For many years my home state of Minnesota has faced a bewildering conundrum. We
are a state that enjoys a laudable standard of living, abundant natural resources, a strong
economy, Fortune 500 companies that take corporate responsibility seriously, a clean
civic system, and a host of public services that make being a Minnesotan a source of
pride. At the same time, we constantly face a persistent challenge to our status as a
progressive exemplar: Our public schools, unlike our other systems, do not work equally
well for everyone. Educational outcomes for students of color and American Indians are
among the worst in the nation. It is a strong departure from how we think of ourselves,
and one we haven’t confronted adequately.

My work for brightbeam has brought me to a wide variety of cities where I’ve been fortunate in meeting
families, students and educators from all walks of life. During my visits I have noticed that Minnesota is
far from an outlier. In fact, I recognize an obvious pattern that any traveler should be able to see. From
Seattle to Minneapolis, and Oakland to D.C., there are construction cranes everywhere, condominiums
going up, immense wealth growing, but in the shadows of prosperity there are children who will never
truly experience the first-world lifestyles of the cities they live in. Further, like Minnesota, these cities
are undoubtedly politically, socially, and economically progressive.

How is it that these would be places of such great inequity?

This report on the outcomes for children of color in America’s most progressive cities is an attempt
to highlight a problem we at brightbeam see as fixable. Wealthy and progressive cities have so
much potential for truly tackling the immoral and unacceptable problem of racial and economic
gaps in educational outcomes. To get there we first need communities and their political leaders to
acknowledge that they have a problem, and from there we need the political class of all these cities
to commit themselves to a meaningful plan that is co-created with the communities they serve and
monitored year over year for progress toward the goal of closing gaps.

As an organization, we are on a mission to demand a better education and a brighter future for every
child. As you read this report, keep in mind that, for us at brightbeam, this is a first look at the problem
in progressive cities. We are dedicating ourselves to a long-term campaign that challenges and
encourages progressives to apply their values of equity and social responsibility to the unconscionable
gaps in educational opportunity. We welcome your participation, your pushback, and your partnership
in turning our unequal urban centers into cities of hope where all children have the best opportunity
to learn.

Thank you for reading.

Peace be with you,
Chris Stewart, CEO

                                                                                                                02
Table of
Contents

Executive Summary           04

An Example                  07

Progressive Cities Have
Larger Achievement Gaps
Than Conservative Ones      09

Of All the Factors We
Looked At, Progressivism
Is the Greatest Predictor   12

Our Approach                15

Detailed Results            17

Recommendations             29

Conclusion                  31

Acknowledgements            32

About brightbeam            33

                                  03
EXECUTIVE
SUMMARY
Introduction
Martin Luther King, Jr., once famously chided America for giving minorities a bad
check which has come back marked “insufficient funds.” Still, he said, “we refuse
to believe that the bank of justice is bankrupt. We refuse to believe that there are
insufficient funds in the great vaults of opportunity of this nation. So we’ve come to
cash this check, a check that will give us upon demand the riches of freedom and
the security of justice.”

                                            Nowhere is this statement of reckoning more
                                            true than in our nation’s public schools, where
                                            students are nearly as segregated and unequally
                                            resourced as they were in the days when King
                                            led our nation to face the cruel inconsistencies
                                            between our rhetoric and our actions.

                                            Public education is central to American
                                            democracy. Ideally, children from every area
                                            of our country can graduate from effective
                                            and well-resourced schools that prepare them
                                            equally for active citizenship and meaningful
                                            lives. Yet, the conditions in our schools are not
                                            ideal. Schools across the U.S. tend to struggle
                                            with educating black and Latino students when
                                            compared to their white peers. This is the case
                                                                                                 Executive Summary

                                            even in cities where there is notable progress on
                                            other important issues like immigration, health
                                            care and neighborhood revitalization. In fact, as
                                            we show in this report, highly prosperous cities
                                            with progressive residents have particularly poor
                                            outcomes for children living at the margins. It is
                                            ironic that this is happening for children living

                                                                                                  04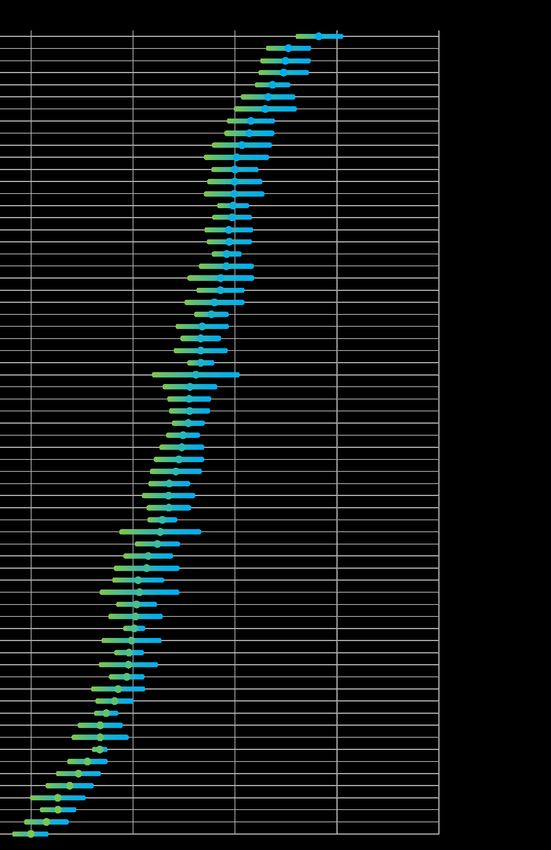
in cities that are best positioned to reverse the    for all of them we did our best to consider the
nation’s shameful education “achievement gap.”       best explanations larger racialized gaps in
                                                     progressive cities. For instance, progressive
Leaders of progressive cities often frame            cities like New York and Chicago are much
their policy proposals in terms of what’s best       larger than any of the conservative cities we
for those with the least opportunity and the         studied. We thought controlling for population
greatest obstacles — those who have been “left       size in our data might reveal that as a predictor
out and left behind,” as the Democratic party        for larger gaps. But it didn’t.
states. But, in education, we found the opposite:
Students in America’s most progressive cities        We also looked at other factors that might
face greater racial inequity in achievement and      create strong correlations between larger
graduation rates than students living in the         achievement gaps and progressive cities: the
nation’s most conservative cities.                   percentage of white students in the city, the per-
                                                     pupil spending, the level of income inequality,
                                                     and the poverty rate. But controlling for these
Progressive Cities Have Larger                       factors did not erase the correlation between a
Achievement Gaps Than                                city’s progressivism and the sizable racialized
Conservative Cities                                  gaps in educational outcomes.

•   Progressive cities, on average, have             It is important to point out, though, that while
    achievement gaps in math and reading that        this report shines a bright light on a striking
    are 15 and 13 percentage points higher than      correlation, it makes no claim as to causation.
    in conservative cities, respectively.            We do not make a claim as to why progressive
                                                     cities appear to have significantly larger gaps
•   In San Francisco, for example, 70% of white      in student achievement. We recognize there
    students are proficient in math, compared        is a great deal of variability in local policies
    to only 12% of black students reaching           and practices that certainly impact results, so
    proficiency — a 58-point gap.                    we limit the scope of this report to the facts
                                                     we observe and we invite those who care to
•   In Washington, D.C., 83% of white students       take action.
    scored proficient in reading compared to 23
    percent of black students — a 60-point gap.
                                                     Our Approach
•   In contrast, three of the 12 most conservative
                                                     To determine a rationale for what is a progressive
    cities — Virginia Beach, Anaheim and
                                                     city and what is a conservative city we relied
    Fort Worth — have effectively closed or
                                                     on criteria developed independently by political
    even erased the gap in at least one of the
                                                     scientists Chris Tausanovitch and Christopher
    academic categories we examined.
                                                                                                           Executive Summary

                                                     Warshaw, who pooled data from seven large
                                                     surveys of U.S. public opinion to rank the nation’s
We Tried to Explain It Away, But                     biggest cities in terms of conservatism. We then
We Couldn’t                                          selected the 12 most conservative cities and
                                                     the 12 least conservative cities from that list
There are many factors that contribute to            to establish the conservative and progressive
student success, and while we could not control      cities that make up the base of this report.

                                                                                                            05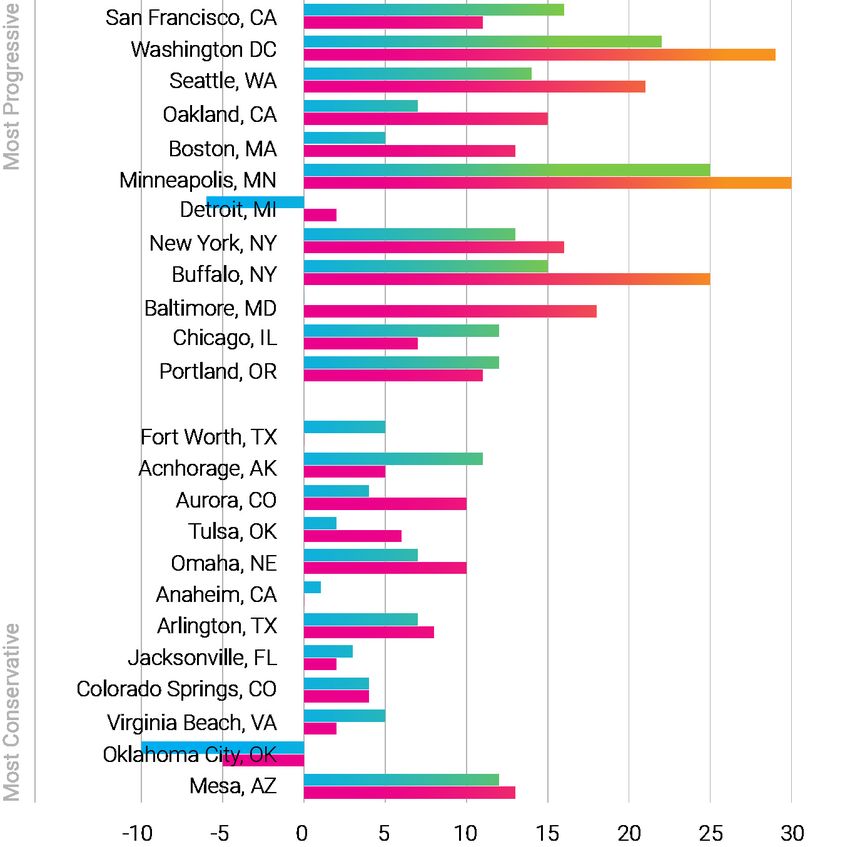
With those cities in mind, we pulled the publicly    For parents, advocates and others, this means:
available school achievement and graduation
data from public school districts in each of those   1. Spreading the word about the problem
cities. When we analyzed the achievement gaps           and potential solutions.
between black and white students and the gaps
between Latino and white students we found           2. Demanding a plan from city leaders
larger gaps than readers might expect from              and then holding them accountable for
cities where progressive residents presumably           making progress.
hold the most political, administrative and
                                                     3. Developing a collective voice pushing for
cultural power.
                                                        better schools.

Recommendations
                                                     Why This Matters
We are careful not to make leaps from sharing
                                                     Though many dedicated educators and
our findings to making policy prescriptions.
                                                     community members commit themselves
Our report is more concerned with outcomes
                                                     every day to improving education, our
as an end point for observation rather than
                                                     most progressive cities have made very
specific school policies or practices that
                                                     little progress towards the fundamental
produce the outcomes. While this research
                                                     responsibility of helping every student reach
does not support any specific policy
                                                     their highest potential.
recommendations, we do hope it will spark
action from political leaders and community          In the face of these data, progressive leaders
organizers to produce community-monitored            cannot make excuses for failing to close these
plans for how they will take decisive action to      gaps. Our research shows that there are U.S.
create a system of educational opportunities         cities where little to no gaps exist. Those cities
that move children from the margins to the           happen to be conservative. This leads us to
economic center of their cities.                     expect more of progressive leaders, and our
                                                     children deserve better.
For leaders with stewardship over children
this means:                                          School and municipal leaders in all cities,
                                                     regardless of political affiliation, now have an
1. Convening city stakeholders to develop
                                                     opportunity to acknowledge these gaps and
   a common understanding of the issues
                                                     take action to change this reality.
   preventing school success.

2. Making plans that marshal all possible
   resources to support children in school.
                                                                                                          Executive Summary

3. Creating understandable methods for
   sharing public information regarding
   school outcomes.

                                                                                                           06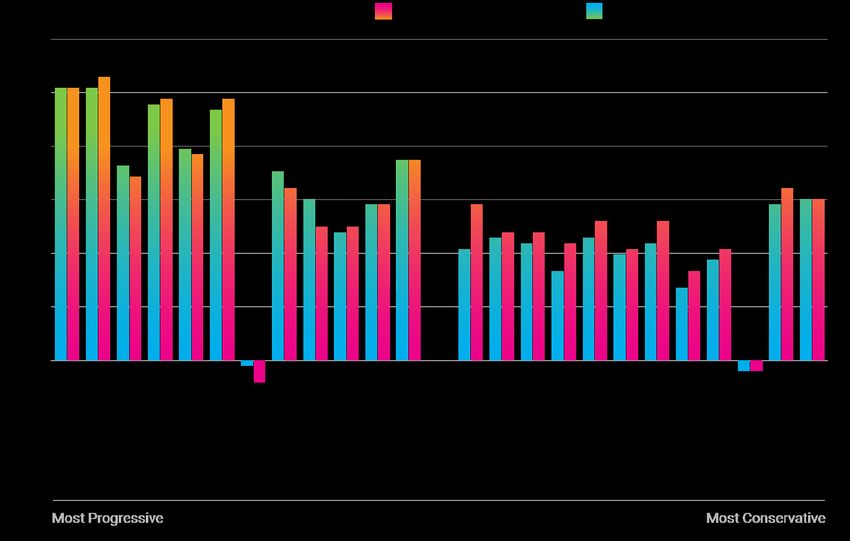
AN EXAMPLE
San Francisco is arguably among the most politically progressive cities in the United
States. Its mayor, London Breed, is an embodiment of the progressive dream: She
became the mayor of a major American city despite the racism she undoubtedly
encountered as a black woman and despite the poverty she faced growing up in
San Francisco’s Western Addition neighborhood, where she lived in public housing,
relied on “government groceries,” and drank water from old mayonnaise jars instead
of cups. Through her own hard work, and with the help of social safety nets, she
graduated from high school with honors before getting a bachelor’s degree from
the University of California, Davis, and a master’s degree 15 years after that.

In August 2019, she announced $10 million in          equal opportunity, and tolerance. Progressives
stipends for public school educators working          assume we’re all in it together: We all benefit
in the city’s “high-potential schools.”               from public investments in schools and health
                                                      care and infrastructure.” The problem with this
 “Students in San Francisco deserve a                 analysis is that “we all” don’t benefit equally
                                                      from investments in schools. Society fails to
  high-quality education, regardless of
                                                      give students in poverty, and students of color,
  where they live or go to school,” she
                                                      an equal opportunity to learn.
  said in a press release.
                                                      The word “equity” is ubiquitous in education,
Breed is the latest in a long, unbroken succession    but there is little consensus on its meaning.
of Democratic mayors in San Francisco. The            We assume it means giving the most help to
last Republican elected there took office in          those with the greatest need (or facing the
1964. The state of California has been under          biggest obstacles), leveling the playing field,
Democratic administrations since Gov. Arnold          and providing opportunities for everyone to
Schwarzenegger left office in 2010.                   thrive, regardless of race, gender, income or
                                                      social status are at the heart of progressive
Democrats and progressives have long prided           platforms, rhetoric, policy-making and individual
themselves on uplifting the underprivileged           lifestyles. Historically, progressives have taken
and often present their policy proposals and          leading roles in advancing these values through
their criticisms in terms of equity or their effect   policy, including the Civil Rights Act, the War
on the “least among us.” Robert Reich, one            on Poverty, marriage equality, the Deferred
                                                                                                          An Example

of the most prominent progressive voices              Action for Childhood Arrivals (DACA) and many
of our time, described progressive virtues            other social programs intended to support
by saying “progressives believe in openness,          disadvantaged groups.

                                                                                                          07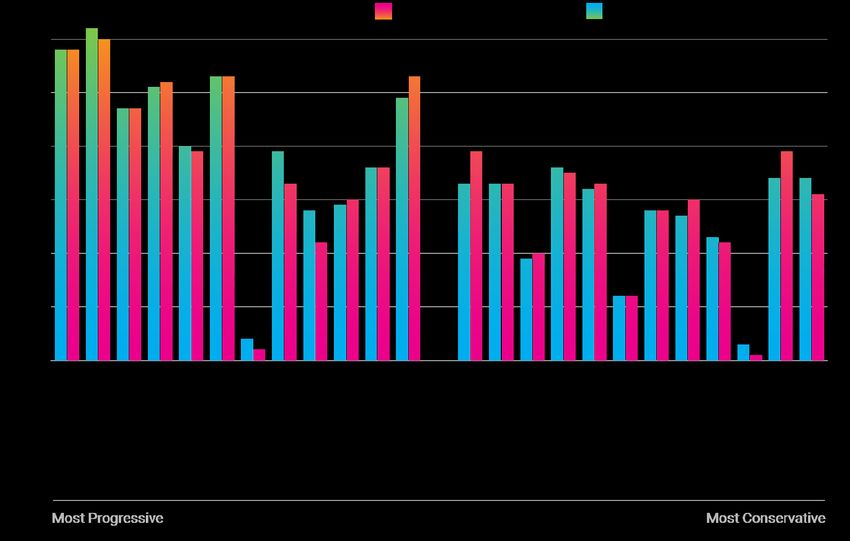
So how do we explain outstandingly poor             likely to have used their considerable resources,
educational results for minority children in San    political will, and community support for helping
Francisco — which also happens to be one of         black and Latino children succeed in school?
the wealthiest cities in the country? After all,    Shouldn’t this be where we see the smallest
progressives hold the power in city and state       educational disparities between white students
government to implement policies derived from       and their black and brown peers?
their values, set tax rates, allocate funding and
reinforce systemic structures that make their       It should be, but it’s not.
stated values manifest. Shouldn’t an incredibly
                                                    Hidden in the shadows of our most progressive
wealthy place like San Francisco be the most
                                                    cities are millions of children who will never
                                                    experience the best of what those cities
                                                    have to offer due to the pervasive inequities
                                                    that decision-makers have presided over
                                                    for decades.

                                                                                                        An Example

                                                                                                        08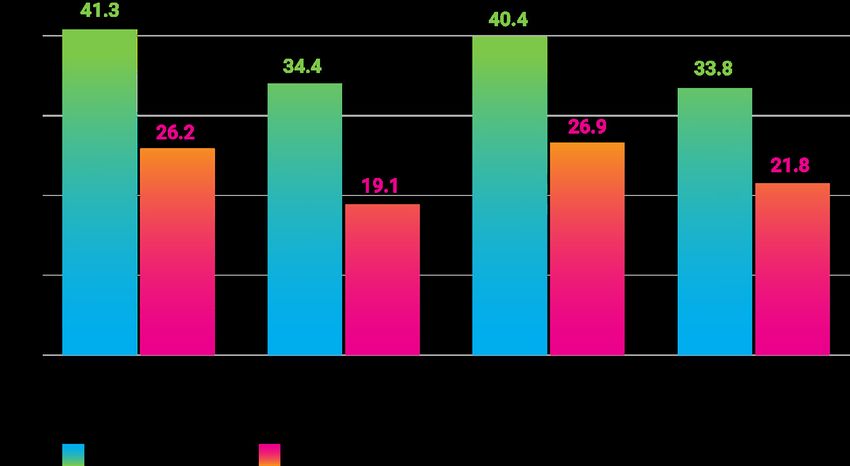
PROGRESSIVE
CITIES HAVE LARGER
ACHIEVEMENT GAPS
THAN CONSERVATIVE
ONES
Progressive Cities Have Larger Achievement Gaps Than Conservative Ones
Despite its political leanings, San Francisco, like 10 of the other most progressive cities
in the country, tends to have greater — not smaller — gaps in academic achievement
between white students and their black and Latino peers, when compared to the
most conservative cities in the country.
When we look at the data for public schools Average Black-White Math Proficiency Gap
in the 12 most progressive and the 12 most
conservative cities, we find that while all
students have roughly the same proficiency
rates (i.e., students in progressive cities
perform slightly better, on average, than
students in conservative cities on reading and
slightly worse in math), the black-white and
Average Latino-White Math Proficiency Gap
Latino-white gaps in math proficiency were,
on average, 15 percentage points greater in
progressive cities. We saw similar patterns
for reading and graduation rates. In every
case except Detroit,1 progressive cities have
strikingly large achievement gaps.
1 Since 1950, Detroit has lost more than 60% of its population and since 2011, 15% of students living in Detroit attend
school in a district outside of the city. They also have substantially lower performance rates. These factors make Detroit
an outlier for the purposes of this study. See more details on page 19.
09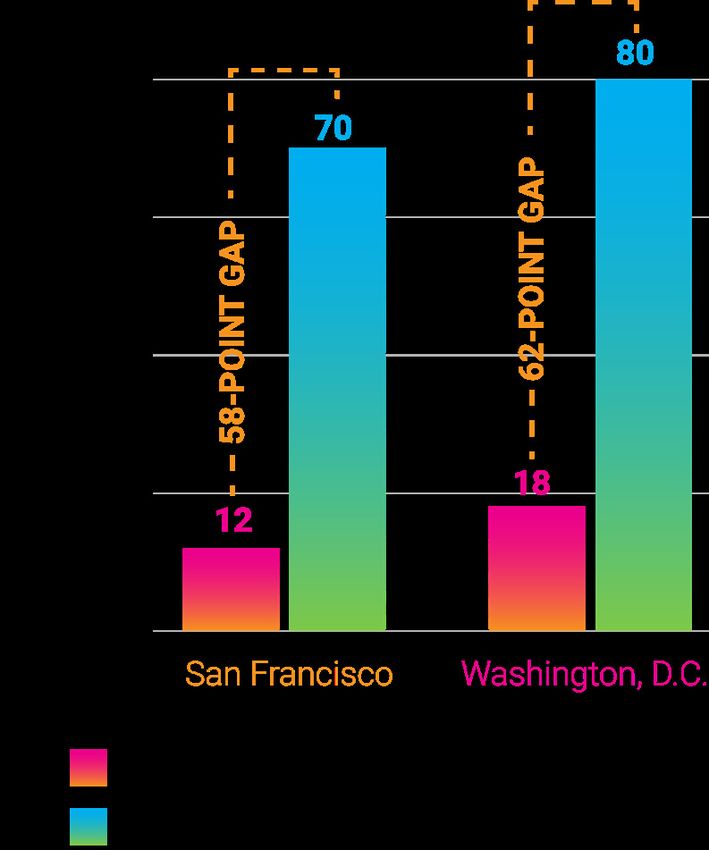
A SNAPSHOT OF
OUR APPROACH:
Six of the 12 progressive cities — San Francisco, 1. Identified Progressive vs Conservative
Washington, Seattle, Oakland, Minneapolis Cities.
and Portland — have yawning black-white We identified the 12 most progressive
achievement gaps in both math and reading and 12 most conservative cities
that exceed 40 percentage points. In politically using an established study by Chris
progressive Minneapolis, the Latino-white high Tausanovitch and Christopher Warshaw
school graduation rate gap is an astounding 30 ranking American cities. Plus, if you live
percentage points. in one of them, you’re probably nodding
in agreement.
To put these gaps into perspective, consider
San Francisco, where 70% of white students
2. Analyzed Achievement Gaps From
are proficient in math (based on the state’s
Publicly Available Data
and district’s own standards), yet only 12% of
black students are hitting that proficiency mark We pulled available public achievement
in math. That’s a 58-point gap. and graduation rate data from public
school districts in these cities and looked
Progressive Cities Have Larger Achievement Gaps Than Conservative Ones
In Washington, D.C., 80% of white students at gaps — rather than rates — to account
are scoring proficient in math as opposed to for potential bias.
only 18% of black students, a 62-point gap.
On average, progressive cities have a 41-point 3. We Identified Correlation, Not
black-white gap in math and a 40-point gap in Causation
reading. The gap between Latino and white
students is smaller than the black-white gap, but We found clear evidence of larger
still larger when compared to conservative cities. achievement gaps in progressive
cities compared to conservative ones.
Average Black-White Math Proficiency Gaps in However, given the data we used for
Washington D.C. and San Francisco this study, we cannot identify what
causes these gaps.
4. We Ruled Out Some Possible
Explanations
We considered the size of the city, the
percentage of white students, and
economic factors. Controlling for these
factors made no meaningful difference
in the results.
10In contrast, three of the 12 conservative cities Average Black-White Graduation Rate Gap
— Virginia Beach, Anaheim, and Fort Worth —
have effectively closed the gap in at least one of
the academic categories we looked at, literally
achieving a gap of zero or one. The politically
conservative Oklahoma City has even turned the
tables on our typical thinking about race-based
gaps. There, students of color outperform white
students on high school graduation rates.
Average Latino-White Graduation Rate Gap
On average, conservative cities own a 26-point
gap in black-white math scores, and a 27-point
gap for reading — still nowhere near ideal
outcomes, but roughly 15 points and 13
points lower, respectively, than what we see in
progressive cities.
Progressive Cities Have Larger Achievement Gaps Than Conservative Ones
Average Black-White Reading Proficiency Gap
The embarrassingly inequitable outcomes in
progressive cities should ignite the residents
of those cities to demand education systems
that work equally well for every child, not just
because their values demand it, or because the
success of the city depends on it, but because
addressing it is critical for the children in
Average Latino-White Reading Proficiency Gap their cities.
Unacceptable racial achievement gaps in our
public education system are prevalent just
about everywhere, from the most conservative
cities to the least and everything in between.
Just because one city’s achievement gaps are
smaller doesn’t mean leaders there shouldn’t
consistently aspire for better outcomes. But
the fact that progressive cities have such
substantially larger academic achievement gaps
stands in sharp contrast to their declared values.
11OF ALL THE
FACTORS WE
LOOKED AT,
PROGRESSIVISM
IS THE GREATEST
PREDICTOR
Of All the Factors We Looked At, Progressivism Is the Greatest Predictor
We attempted to understand the results by looking at other factors that could create
strong correlations between larger achievement gaps and progressive cities. Each
of the bold questions represents a condition that we thought could likely explain
the discrepancy between progressive and conservative cities.
Would we find similar results if we just First, that’s not always true: Duval County
compared big cities, where there are higher Schools in Jacksonville (one of the 12 most
student populations, to smaller cities? conservative cities) has higher percentages of
black and Latino students than Seattle Public
No. In this case, size doesn’t matter. We ran a Schools (one of the 12 most progressive
regression analysis to control for districts with cities). Second, even where there are higher
larger student populations and the effect was percentages of white students, it doesn’t have
statistically insignificant (see pages 26-27) — it a statistically significant effect on math and
didn’t make a difference in the results. reading gaps (see Table 3 on page 27). The
only effect we observed was a slightly larger
Could the gaps be bigger in progressive
graduation rate gap between black and white
cities because they have fewer white people
students in cities where there were more
compared to conservative cities (given that
white students. Still, it wasn’t enough to bring
fewer white people typically means fewer
progressive and conservative cities much
resources to address the gaps)?
closer together.
12Regression-Adjusted Black-White Graduation and progressive cities we studied. Based on
Rate Gaps the Gini Index for Income Inequality from the
most recently available census data (where
0 is total equality and 1 is total inequality),
income inequality, on average, in these
progressive and conservative cities is .4681
and .4607 respectively. In fact, six of the 12
progressive cities have lower-income inequality
than the conservative cities average and five
What about per-pupil spending? of the 12 conservative cities have greater
income inequality than the progressive cities
We know from research that money matters average. Income inequality doesn’t explain
in education. Yet, spending is actually much why progressive cities have significantly higher
higher in most progressive cities with large achievement gaps.
gaps than in conservative cities with small or
negligible gaps, so that doesn’t explain it either. Perhaps students in progressive cities are likely
Of All the Factors We Looked At, Progressivism Is the Greatest Predictor
to have higher poverty rates among students
Wouldn’t conservative cities have higher of color (as measured by more students with
rates of students leaving the public school free or reduced-price lunch status). If that’s
system for private options? That would likely true, wouldn’t a higher percentage of students
“lower the ceiling” and leave the lower-income, of color in poverty translate to more of them
less-advantaged students all together, thus failing to meet the proficiency standards? For
shrinking the gaps, right? example, if 90% of my city’s black students
are poor, we’d expect to see fewer reaching
Actually, families in progressive cities are proficiency than if 30% were, right?
about as likely as those in conservative cities
to choose a private school. According to In cities with higher percentages of middle- to
data from the National Center for Education upper-income black families, you might expect
Statistics, 14.4% of students, on average, attend to see narrower gaps between white and black
private schools in the 12 progressive cities we students. But because of a lack of data, in most
looked at compared to 11.6% of students in the cases, we don’t actually know if there is a greater
conservative cities. percentage of middle- to upper-income black
families in conservative cities. Where we did
A study from 2014 found that where you’ve have race and income data for students, though,
got greater income inequality, you have we found that the gaps between lower-income
greater academic achievement gaps. Perhaps black and white students were often about the
progressive cities have a harder problem same as the gaps between upper-income black
to solve because they have higher rates and white students.
of income inequality. If conservative cities
had the same kind of wealth disparities that We were able to collect school level income
progressive cities have, wouldn’t they likely data in five of the 24 cities: three progressive
have bigger achievement gaps too? cities (San Francisco, the District of Columbia
and Oakland) and two conservative cities
The evidence suggests income inequality is (Anaheim and Virginia Beach). For these five,
roughly the same between the conservative
13we disaggregated results by both race and That finding is stable no matter how we looked
income. The race gaps in these five cities within at the data. The biggest predictor for larger
income categories were very similar to their race educational gaps was whether or not the city
gaps overall. The same was true for lower- and has a progressive population.
higher-income white students compared to
Average Math Gaps of Students in Oakland, San
Latinos within those same income categories.
Francisco, and Washington, D.C.
In the case of math proficiency, however, in
San Francisco, Washington, D.C. and Oakland, Black-White Gap Latino-White Gap
the gaps between middle- to upper-income Lower Higher Lower Higher
Income Income Income Income
black and white students is actually larger
than it is between lower-income white and San
Francisco, 35 56 28 44
black students. CA
Washington,
In other words, despite the familiar D.C.
13 54 1 46
talking point that poverty is the
Of All the Factors We Looked At, Progressivism Is the Greatest Predictor
Oakland, CA 24 50 19 37
primary obstacle to educational
opportunity, these particular Average
24 53.3 16 42.3
progressive cities actually do a better Math Gaps
job of helping low-income black
students close the gap with their white
counterparts in math than they do with
higher-income black students.
The scope of this report does not allow us
to say what drives the correlation between
progressive cities and underperformance of
minority students. We did not consider any
policy or practice as a cause for the larger
achievement gaps between racial subgroups.
But our results demonstrate that there is
a negative difference between our most
progressive and most conservative cities, and
it can’t be explained away by factors such as
city size, racial demographics, spending, poverty
or income inequality. In cities where most of
the residents identify as political progressives,
educational outcomes for marginalized children
lag at a greater rate than other cities.
14OUR APPROACH
Our research partners compared average gaps in math proficiency, reading proficiency,
and high school graduation by race among the public school students in the 12 most
progressive cities with gaps across the same measures in the 12 most conservative
cities. We examined gaps between black and white students as well as Latino and
white students. Proficiency rates, from which we calculated the gaps, come from
publicly reported state assessments in the 2017-18 school year for public school
districts within each city, typically for grades 3-8 and some high school grades. High
school cohort graduation rates are from 2018, or the most recently reported year.
Since states establish their own standards Cities are identified as progressive or
for educational proficiency and high school conservative based on criteria developed
graduation, comparing those rates across independently by political scientists Chris
states would likely introduce bias. But every Tausanovitch and Christopher Warshaw,
student within a given city, regardless of their who pooled data from seven large surveys of
race, faces the same academic standards U.S. public opinion. These surveys measure
and tests. Standards may be higher or lower the relative political conservatism of cities
in different cities and states, but they are not with more than 250,000 residents. We
higher or lower for students of different races define “progressivism” as the opposite of the
within the same city. conservatism measure used by Tausanovitch
and Warshaw. The authors’ estimates of city
In just under half of the cities considered for this conservatism are strongly correlated with
report, states and districts do not report charter vote shares in a recent presidential election,
school performance data as part of district suggesting they have reasonably captured a
results, so in those cases, we didn’t use charter city’s ideological standing on the traditional
school data for this study. We included charter progressive-conservative political ideology
school data for each city where the state or spectrum. Their resulting list of the 12 most
district combined it with traditional school data: progressive and the 12 most conservative cities
in six progressive cities (San Francisco, Oakland, in the U.S. also has face validity, as informed
Detroit, Baltimore, Chicago and Portland) and readers will recognize the various cities as
eight conservative cities (Anchorage, Aurora, clearly belonging in their respective camps.
Anaheim, Jacksonville, Colorado Springs,
Our Approach
Oklahoma City, Tulsa and Virginia Beach).
15Progressive and Conservative Cities
Our Approach
Source: Chris Tausanovitch and Christopher Warshaw
16DETAILED RESULTS
In Tables 1a-1c, we present the achievement levels and graduation rates overall, then by race,
followed by the resulting race gaps, for the public school districts in the 12 most progressive
cities in the U.S. Following those tables, we present similar statistics for the 12 most conservative
cities (Table 2a-2c). Then we compare the gaps across the cities visually through a series of
graphs. Finally, using statistical regressions, we show what the gaps look like after controlling for
two crucial factors: The size of each district’s K-12 student population and the proportion of that
population that is white. As mentioned above, we considered these two factors to be most likely
to skew the results toward larger gaps in progressive cities, so we tested them.
Table 1(a). Math Achievement Gaps in 12 Most Progressive Cities
Math Proficiency Rates Gaps
Overall Black Latino White Black-White Latino-White
San Francisco, CA 51 12 21 70 58 49
Washington, D.C. 31 18 31 80 62 49
Seattle, WA 63 29 40 76 47 36
Oakland, CA 27 12 17 63 51 46
Boston, MA 32 20 22 60 40 38
Minneapolis, MN 39 17 25 70 53 45
Detroit, MI 7 6 11 10 4 -1
New York, NY 43 25 30 64 39 34
Buffalo, NY 21 14 13 42 28 29
Baltimore, MD 14 11 16 40 29 24
Chicago, IL 22 12 20 48 36 28
Portland, OR 48 11 24 60 49 36
Average Math Gaps 41.3 34.4
Detailed Results
17Table 1(b). Reading Achievement Gaps in 12 Most Progressive Cities
Reading Proficiency Rates Gaps
Overall Black Latino White Black-White Latino-White
San Francisco, CA 55 20 29 78 58 49
Washington, D.C. 35 23 32 83 60 51
Seattle, WA 69 36 49 83 47 34
Oakland, CA 33 19 24 71 52 47
Boston, MA 34 24 26 63 39 37
Minneapolis, MN 42 21 27 74 53 47
Detroit, MI 14 13 19 15 2 -4
New York, NY 47 34 36 67 33 31
Buffalo, NY 23 18 16 40 22 24
Baltimore, MD 18 14 19 44 30 25
Chicago, IL 26 18 26 54 36 28
Portland, OR 61 21 38 74 53 36
Average Reading Gaps 40.4 33.8
Table 1(c). Graduation Rate Gaps in 12 Most Progressive Cities
High School Graduation Rates Graduation Rate Gaps
Overall Black Latino White Black-White Latino-White
San Francisco, CA 72 52 57 68 16 11
Washington, D.C. 69 68 61 90 22 29
Seattle, WA 82 74 67 88 14 21
Oakland, CA 75 76 68 83 7 15
Boston, MA 75 76 68 81 5 13
Minneapolis, MN 69 62 57 87 25 30
Detroit, MI 77 78 70 72 -6 2
New York, NY 73 69 66 82 13 16
Buffalo, NY 63 60 50 75 15 25
Detailed Results
Baltimore, MD 72 73 55 73 0 18
Chicago, IL 84 70 75 82 12 7
Portland, OR 80 71 72 83 12 11
Average Graduation Gaps 11.3 16.5
18The largest black-white achievement proficiency gaps among the 12 most progressive urban school
districts are in Washington, D.C., (62 percentage points in math, 60 points in reading) and San Francisco
(58 points in both math and reading). Disappointingly, at 49 and 51 percentage points, the nation’s
capital and the City by the Bay also suffer from the largest Latino-white gaps in learning proficiency.
Minneapolis has the highest black-white and Latino-white gaps in high school graduation rates: 25
and 30 percentage points, respectively. The District is close behind Minneapolis with a black-white
high school graduation gap of 25 percentage points and a Latino-white gap of 29 points.
The smallest achievement and graduation rate gaps within the 12 most progressive school districts
are found in Detroit. The Motor City is unique in many ways that make it an outlier in this study. Detroit
has the lowest overall math and reading proficiency rates among the 24 urban school districts in
this study. Tragically, only 7% of Detroit public school students are proficient in math and only 14%
are proficient in reading. These abysmal learning proficiency rates are similar across all three racial
groups in Detroit, generating small racial gaps that, in some cases, like the Latino-white math and
reading gaps and the black-white high school graduation gap, actually favor children of color.
While Detroit is an outlier with substantially lower achievement gaps, it is certainly not a model.
According to The Detroit News, “Since 2009, Detroit has posted some of the lowest scores ever
recorded on the National Assessment for Educational Progress–and not by just a little.”1 Detroit also
is anomalous because it has lost over 60% of its population since 1950 and, as recently as 2011, over
15% of K-12 students who lived in the city attended public schools in neighboring districts.2 None of
the other 23 cities we studied came close to that kind of drastic population shift or have posted such
low achievement scores. While it was not within the scope of this study to explore the impact of those
unique circumstances, we know that other cities did not face the same circumstances and we believe
it is likely those factors play a role in Detroit’s achievement gap. We also know that population size
alone did not account for statistically significant changes in achievement gaps among the 24 cities
we studied (see regression analysis on pages 26-27).
Excluding the outlier of Detroit from the sample, the remaining 11 progressive school districts average
black-white proficiency gaps of 45 percentage points in math and 44 points in reading, along with a
high school graduation rate gap of 13 percentage points. The Latino-white education gaps for the
progressive cities, excluding Detroit, are a similarly dismal 38 percentage points in math, 37 points in
reading, and 18 points in high school graduation.
The achievement and graduation rate gaps for the conservative districts in our analysis appear
in Tables 2a-2c. Virginia Beach, Virginia, has the lowest achievement gaps among the 12 most
conservative cities. The black-white gap in math proficiency is only 3 percentage points and the gap
in reading proficiency is a miniscule 1 percentage point. The Latino-white proficiency rate gaps in
Virginia Beach actually favor Latino students by 2 percentage points in both math and reading.
Detailed Results
1 “Editorial: Scary Detroit Scores Make Case for Charters,” The Detroit News, November 2, 2019, accessed at https://www.
detroitnews.com/story/opinion/editorials/2019/11/03/editorial-scary-detroit-scores-make-case-charters/4122222002/
2 Thomas Stewart and Patrick J. Wolf, Understanding School Shoppers in Detroit, Michigan Future Inc., February 2012,
accessed at http://www.uaedreform.org/downloads/2016/01/detroit-school-shoppers-report.pdf
19Several conservative cities stand out for completely eliminating or reversing racial gaps in high school
graduation rates. The public school district of Anaheim, California graduates 86% of its high school
students in four years. There are no meaningful racial graduation rate gaps in Anaheim. The graduation
rate for black students in Anaheim is only 1 percentage point below the rate for white students and
the rate for Latino students is identical to the rate for whites. Fort Worth, Texas, similarly has no racial
graduation rate gap for Latino students although the high school graduation rate for black students is
5 percentage points lower than the rate for white students. The Oklahoma City public school district
only graduates 73% of its high school students in four years but the graduation rate is 10 percentage
points higher for black students than for white students and 5 percentage points higher for Latino
students than for whites. Virginia Beach, which stands out for its admirably low achievement gaps,
graduates high school students at the highest rate in the study, at 93%, but with a black-white gap of
5 percentage points and a Latino-white gap of 2 points.
Table 2(a). Math Achievement Gaps in 12 Most Conservative Cities
Math Proficiency Rates Gaps
Overall Black Latino White Black-White Latino-White
Fort Worth, TX 35 23 36 56 33 20
Anchorage, AK 41 22 32 55 33 23
Aurora, CO 17 14 12 33 19 21
Tulsa, OK 16 16 36 52 36 16
Omaha, NE 30 16 26 48 32 22
Anaheim, CA 25 28 21 40 12 19
Arlington, TX 44 32 39 60 28 21
Jacksonville, FL 56 43 56 70 27 14
Colorado Springs, CO 28 13 18 36 23 18
Virginia Beach, VA 64 62 67 65 3 -2
Oklahoma City, OK 13 16 22 50 34 28
Mesa, AZ 43 25 30 59 34 29
Average Math Gaps 26.2 19.1
Detailed Results
20Table 2(b). Reading Achievement Gaps in 12 Most Conservative Cities
Reading Proficiency Rates Gaps
Overall Black Latino White Black-White Latino-White
Fort Worth, TX 35 24 35 63 39 28
Anchorage, AK 46 29 38 62 33 24
Aurora, CO 26 24 20 44 20 24
Tulsa, OK 22 29 43 64 35 21
Omaha, NE 33 20 28 53 33 25
Anaheim, CA 30 35 27 47 12 20
Arlington, TX 42 33 36 61 28 25
Jacksonville, FL 50 35 48 65 30 17
Colorado Springs, CO 37 24 26 46 22 20
Virginia Beach, VA 66 65 68 66 1 -2
Oklahoma City, OK 17 25 33 64 39 31
Mesa, AZ 39 24 26 55 31 29
Average Reading Gaps 26.9 21.8
Table 2(c). Graduation Rate Gaps in 12 Most Conservative Cities
High School Graduation Rates Gaps
Overall Black Latino White Black-White Latino-White
Fort Worth, TX 85 81 86 86 5 0
Anchorage, AK 81 74 80 85 11 5
Aurora, CO 65 68 62 72 4 10
Tulsa, OK 78 80 76 82 2 6
Omaha, NE 78 77 74 84 7 10
Anaheim, CA 86 83 84 84 1 0
Arlington, TX 85 83 82 90 7 8
Jacksonville, FL 85 83 84 86 3 2
Colorado Springs, CO 70 67 67 71 4 4
Detailed Results
Virginia Beach, VA 93 90 93 95 5 2
Oklahoma City, OK 73 81 76 71 -10 -5
Mesa, AZ 79 71 70 83 12 13
Average Graduation Gaps 4.3 4.6
21Arguably, Virginia Beach is an outlier case among conservative districts in more ways than its
admirably low racial education gaps. Military families compose a substantial part of the population
of this port city. With many white, black and Latino children hailing from a shared background of
having military parents, it could be that Virginia Beach is better situated to eliminate achievement
and graduation rate gaps by race than other conservative cities. Excluding the outlier of Virginia
Beach from the set of the 12 most conservative cities, the average black-white proficiency rate
gap in math for the remaining 11 conservative districts is 28 percentage points, with a reading
gap of 29 percentage points and a graduation rate gap of 4 percentage points. The comparable
average Latino-white gaps for conservative cities, excluding Virginia Beach, are 21 percentage
points in math, 24 points in reading, and 5 points in high school graduation.
A visual comparison of achievement gaps between white and black students for all 24 cities is
available in Figure 1, with progressive districts on the left side of the distribution and conservative
districts on the right side. The five cities with the highest black-white proficiency gaps —
Washington, D.C., San Francisco, Minneapolis, Oakland and Portland — all are among the most
progressive cities. Four of the five cities with the lowest black-white proficiency gaps — Virginia
Beach, Anaheim, Aurora and Colorado Springs — are among the most conservative cities. None
of the black-white achievement gaps in the conservative cities reach 40 percentage points while
13 black-white gaps in the progressive cities reach or exceed that threshold.
Figure 1. Black-White Achievement Gaps: State Assessments 2018, by City
Detailed Results
22A similar comparison of the achievement gaps between Latino and white students is available
in Figure 2. Bar graphs appear negative when Latino students outperform white students. The
five cities with the highest Latino-white proficiency gaps — District of Columbia, San Francisco,
Oakland, Minneapolis and Boston — are all among the most progressive cities. All five cities with
the lowest Latino-white proficiency gaps — Virginia Beach, Jacksonville, Colorado Springs, Tulsa
and Anaheim — are among the most conservative cities. None of the Latino-white achievement
gaps in the conservative cities reach 30 percentage points while eight Latino-white gaps in the
progressive cities reach or exceed that threshold.
Figure 2. Latino-White Achievement Gaps: State Assessments 2018, by City
A comparison of the racial graduation rate gaps is provided in Figure 3, with progressive districts
on the top of the distribution and conservative districts on the bottom. The five cities with the
highest race-based high school graduation rate gaps — District of Columbia, Minneapolis, Buffalo,
Seattle and Baltimore — are all among the most progressive cities. Four of the five cities with
the lowest race-based graduation rate gaps — Anaheim, Jacksonville, Colorado Springs and Fort
Worth — are among the most conservative cities. None of the race-based graduation rate gaps
Detailed Results
in the conservative cities reach 15 percentage points while 11 race-based graduation rate gaps in
the progressive cities reach or exceed that threshold.
23Figure 3. Graduation Rate Gaps, by City
Figures 4 and 5 present comparisons of group average gaps in progressive districts versus
conservative districts. Average black-white proficiency gaps are 58% larger in math and 50%
larger in reading in the 12 most progressive districts compared to the 12 most conservative
districts. Average Latino-white proficiency gaps are 80% larger in math and 55% larger in
reading in the progressive districts compared to the conservative districts. Average gaps in
high school graduation between white and black students are more than twice as large in the
average progressive district compared to the average conservative district. Average gaps in
Detailed Results
high school graduation between white and Latino students are more than three times as large
in the progressive districts compared to the conservative districts. The differences between the
much higher average racial gaps in progressive cities and the much lower average racial gaps
in conservative cities are almost identical regardless of whether Detroit and Virginia Beach are
included in, or excluded from, the calculations.
24Figure 4. Average Reading and Math Achievement Gaps,
Progressive vs. Conservative Cities
Figure 5. Average High School Graduation Gaps,
Progressive vs. Conservative Cities
Detailed Results
25Public school districts in the 12 most progressive cities tend to have larger achievement and
graduation rate gaps than public school districts in the 12 most conservative cities. Are these
larger gaps in progressive cities merely due to the racial composition of the progressive districts
or the larger size of their student bodies? The Ordinary Least Squares regression output in Table
3 explores these key questions.
Being a progressive city is associated with much higher racial gaps even after controlling for
the proportion of students in the district who are white and the size of K-12 enrollment. The
progressive cities are associated with a black-white math gap that is 16.7 percentage points
larger and a Latino-white math gap that is 16.5 percentage points larger than the conservative
cities, controlling for variation in the racial composition and size of the 24 districts. The regression-
adjusted black-white and Latino-white reading gaps are 15.1 and 12.9 percentage points higher
for progressive cities, respectively. The progressive cities are associated with racial gaps in high
school graduation that are 8.4 percentage points higher for white students compared to black
students and 13.6 percentage points higher for white students compared to Latino students than
the conservative cities.
Other statistics in the regression output shed interesting light on the issue of race-based education
gaps in politically progressive cities. The association between being a progressive city and having
larger race gaps is statistically significant for all six of the gaps we examine. For three of the six
gaps — Latino-white math, black-white graduation and Latino-white graduation — that statistical
significance exceeds the high level of 99% confidence. For the other three racial gaps, being a
progressive city is associated with higher gaps with a confidence level that exceeds 95%.
Only one other variable demonstrates a statistically significant association with a racial gap in
any of the six regressions. A higher proportion of white students in a district is associated with
having a higher black-white graduation rate gap. Otherwise, district racial composition and size
have no significant associations with differences in the race-based education gaps for the 24
cities in our study. The six regressions explain between 22% and 51% of the total variation in
the size of the race gaps in our study, with the indicator variable for being a progressive city
accounting for almost all of it.
Detailed Results
26Table 3. Effect of Being a Progressive City on Racial Education Gaps Controlling for District
Percentage of White Students and District Size
(1) (2) (3) (4) (5) (6)
Black/ White Latino/ Black-White Latino-white Black-White Latino-White
VARIABLES Math White Math Reading Reading Graduation Graduation
16.670** 16.476*** 15.075** 12.860** 8.425*** 13.556***
Progressive (5.916) (5.072) (6.445) (5.542) (2.907) (3.002)
0.186 0.055 0.171 0.023 0.222** 0.126
District % White Students (0.183) (0.157) (0.200) (0.172) (0.090) (0.093)
-0.158 -1.720 -0.606 -1.826 0.700 -1.595
Student Population 2018 (3.578) (3.068) (3.898) (3.352) (1.758) (1.816)
22.571 36.112 28.592 40.915 -9.655 18.238
Constant (39.744) (34.072) (43.296) (37.231) (19.527) (20.166)
R-squared 0.296 0.349 0.222 0.216 0.386 0.507
Notes: The percentage of white students and overall student population data are retrieved from state departments of
education or the individual school district’s website. In the regression analysis, the variable Student Population 2018 is
transformed into its natural log.
Figure 6 and Figure 7 present regression-adjusted achievement and graduation rate gaps for
the set of progressive cities compared to the set of conservative cities. Controlling for a district’s
percentage of white students and overall enrollment, the achievement and graduation rate gaps
remain larger in progressive districts compared to conservative districts and are very similar to
unadjusted differences.
Figure 6. Regression-Adjusted Reading and Math
Achievement Gaps, Progressive vs. Conservative Cities
Detailed Results
27Figure 7. Regression-Adjusted High School Graduation Gaps,
Progressive vs. Conservative Cities
Finally, five cities in our study provided disaggregated results by both race and income. The set
included three progressive cities mentioned above (San Francisco, District of Columbia and
Oakland) and two conservative cities (Anaheim and Virginia Beach). The race gaps in these five
cities within income categories were very similar to their race gaps overall. In other words, lower-
income white and lower-income black students demonstrated gaps that were about the same
as those for higher-income white and higher-income black students. The same was the case for
lower- and higher-income whites compared to Latinos within those same income categories.
Detailed Results
28RECOMMENDATIONS
Progressives, whether elected or appointed leaders, voters, or other concerned
community members, must take action so that education in their cities works equally
well for every child. It is not enough for cities to tout their booming economies and
call themselves cultural centers if entire swaths of children suffer in the shadows.
The political class in these cities, those with the power to make change, cannot
ignore the fact that racialized gaps in educational achievement are larger in their
cities. There is no such thing as a “world class city” where educational opportunity is
so poor that many children will never enjoy the good lives their cities are known for.
Leaders in these cities must be accountable for experiences and counsel from everyday families
having a well-resourced and publicly monitored is a powerful resource that many leaders often
plan for improving educational outcomes of tokenize or neglect altogether. It’s time for city
children in their care. And engaged residents and education leaders to start looking to the
need to keep these leaders on the hook for families and communities they serve to address
making progress in this area. what to do about these gaps.
Fortunately, conscientious leaders will not have Because each city has its own unique
to solve educational challenges alone. The lived attributes and assets, we offer the following
recommendations as a starting point for
change in these cities, or any city that is fed
up with an education system that fails to meet
the needs of too many children.
Recommendations
29For all leaders with stewardship over children, For parents, advocates and everyone else:
elected, appointed or otherwise:
1. Spread the word.
1. Call the city together to understand the Create a sense of urgency in your
issues. community. Start conversations with
Convene school and city leaders, teachers your friends and family on the need to
and parents to identify where the greatest hold leaders accountable and close
challenges are, what’s been tried in the achievement gaps. Raise awareness of
past, what’s never been tried, and why the how the failures of the current educational
educational realities of black and brown system in your city fails to live up to your
students are so far removed from the own values for meeting the needs of every
cherished ideals of your city. child. We’re producing shareable content at
brightbeamnetwork.org/cities that you
2. Make better plans; set short timelines. can use.
If you’re trying the same tired initiatives that
haven’t worked before, you’re not serious 2. Demand a plan.
about helping kids of color. Take a political Ensure your city’s leaders gather community
risk on behalf of the families who need input to create a plan that can be measured
you most. Reach out beyond your typical against results. Visit brightbeamnetwork.
networks. Bring in well-researched ideas org/cities and sign a petition for your city
and innovators to make informed bets on leaders to create a plan to help all children
what can help students in your city. Work succeed in school, or get involved in any
with your communities to develop and number of our other action opportunities
commit to a city-wide strategic plan that on the site.
outlines specific, measurable goals. And
set a timeline that will expire before you 3. Make your voice heard in the halls of
leave your position. Accountability matters. power.
Reach out on your own to political leaders,
3. Share better information. from the mayor to the school board. Show
Information matters to parents and up at public meetings about education. Tell
anyone else who cares about results. Most them how you feel about the achievement
parents in most cities either get misleading gaps in your city and offer to help. In the
information about their child’s progress or end, it’s up to each of us to tell our leaders
information that’s so complex or out of this matters and to hold them accountable
context that it’s rendered useless. Develop to close these gaps.
a way of making school information more
accessible and easy to understand for the
Recommendations
communities you serve.
30CONCLUSION
Politically progressive politicians rightly decry the severe gaps in student learning
proficiency and graduation rates based on race, but those stirring words have done
little to fix the stark disparities that exist between white students and their black
and Latino peers. None of us, regardless of our political identities and affiliations,
should be satisfied with impassioned rhetoric and token initiatives alone. We need
decisive action from leaders and stakeholders.
But particularly in our most progressive
cities, where educational attainment is at
its most inequitable, we hope that
communities and their leaders will see
this report as a call to action — an opportunity
to lean into their progressive values and
work collectively towards an educational
system that truly meets the high ideals of
opportunity and social responsibility that
progressivism represents.
All of us have an outstanding debt to
our children. But, to return to the words
of Martin Luther King, Jr., America, and
most especially these progressive cities,
has given our black and brown children a
bad check, a check which has come back
marked “insufficient funds.”
“But we refuse to believe that the bank of justice is bankrupt. We refuse to believe that
there are insufficient funds in the great vaults of opportunity of this nation.
So we’ve come to cash this check, a check that will give us upon demand the riches of
freedom and the security of justice.”
Conclusion
31ACKNOWLEDGEMENTS
There were many members of the brightbeam staff who were instrumental in the
creation of this report. The idea for holding progressive political leaders accountable
for better results originated with brightbeam CEO Chris Stewart.
Lane Wright ensured that the research, analysis, writing, and execution of the report was
successfully seen through from start to finish. Maureen Kelleher and Laura Waters provided
crucial insights, writing and copy-editing support and more.
The research, data collection, and analysis was performed by Patrick J. Wolf, Ph.D., and
James Paul at the University of Arkansas.
Members of the brightbeam leadership team – Valentina Payne and J. Gordon Wright –
provided valuable feedback, while Chyrise Harris and our partners at RALLY and Ascendant
Group supported the public release of this report and the ongoing campaign associated with it.
Finally, we are deeply grateful for the insights provided by our Advisory Panel, who shared
thoughts and feedback that improved our work, challenged our assumptions, and we hope,
ultimately led us to a greater report.
Acknowledgements
32ABOUT
BRIGHTBEAM
Brightbeam is a nonprofit network of education activists demanding
a better education and a brighter future for every child.
It is the umbrella organization for the flagship platform known as Education
Post. Don’t worry, Education Post is not going anywhere. Today it’s one of many
digital platforms including Citizen Education, Project Forever Free, and more
than 20 other local and regional sites that spotlight education issues nationally.
When Chris Stewart joined as CEO in May of 2019, we had an opportunity to
broaden and deepen the impact we sought to make when we first launched
Education Post in 2014.
We’ve been exploring new ways to make a difference in the lives of families
and children, and while we’ve seen the futures of millions of children dimmed
by our current education system, there is hope. We’ve seen what’s possible
when communities come together around a shared purpose. And across all of
brightbeam’s platforms and programs we will continue to amplify the voices of
those who demand better — so that every child can get an education that leads
to a brighter future.
Moving forward, we’ll shine a light on communities who challenge decision-
makers to provide the learning opportunities all children need to thrive. We’ll help
our diverse and growing network of voices tell powerful stories designed to unite
and move their communities to action.
To learn more please visit brightbeamnetwork.org/cities.
About Brightbeam
33You can also read


