How Strong Are Soccer Teams? The "Host Paradox" and Other Counterintuitive Properties of FIFA's Former Ranking System
←
→
Page content transcription
If your browser does not render page correctly, please read the page content below
games
Article
How Strong Are Soccer Teams? The “Host Paradox” and Other
Counterintuitive Properties of FIFA’s Former Ranking System
Marek M. Kaminski

                                          Department of Political Science and Institute for Mathematical Behavioral Sciences, University of California,
                                          Social Science Plaza, Irvine, CA 92697, USA; marek.kaminski@uci.edu

                                          Abstract: I investigate the paradoxes associated with the Fédération Internationale de Football
                                          Association (FIFA) point-based ranking of national soccer teams. The ranking has been plagued
                                          with paradoxes that incentivize teams to avoid playing friendly matches, i.e., matches that are not
                                          part of any official FIFA tournament or preliminaries, and applying other counterintuitive strategies.
                                          The most spectacular paradox was the dramatic underrating of the hosts of major tournaments.
                                          For a long time, host teams, which were absent from preliminary matches, would play only friendly
                                          matches that awarded few points. Here, I present three models that estimate the magnitude of the
                                          resulting “host effect” at 14.2–16 positions. Such an estimate counteracts the intuition that a large
                                          investment in hosting a tournament should result in an improvement in the host team’s standing.
                                          However, as discussed here, a given host’s low ranking could decrease interest in the tournament,
                                          and likely result in a major loss of advertisement revenue.

                                          Keywords: football; soccer; FIFA ranking; social choice paradoxes; point systems; host paradox;
                                          World Cup


Citation: Kaminski, M.M. How
Strong Are Soccer Teams? The “Host        1. Introduction
Paradox” and Other Counterintuitive             I investigate the paradoxes associated with the former FIFA ranking. Among a variety
Properties of FIFA’s Former Ranking       of its counterintuitive properties was a very poor treatment of tournament hosts. The
System. Games 2022, 13, 22. https://      source of problems was the low weight assigned to friendly matches, or friendlies, i.e.,
doi.org/10.3390/g13020022                 matches that are not part of any official FIFA tournament or preliminaries, versus the
Academic Editors: Maria Gallego and       preliminaries of both the World Cup and the regional Federation Cups (the multiplier of
Ulrich Berger                             1 versus 2.5). Hosts advance to main tournaments automatically; therefore, they do not
                                          play in the preliminaries, which typically started about two years before the main event.
Received: 27 November 2021
                                          Thus, for approximately two years before the tournament, the host plays only low-scoring
Accepted: 25 February 2022
                                          friendlies. Here, it is important to notice that a team’s ranking is the weighted sum of its
Published: 3 March 2022
                                          scores over the course of four years (with the weights equal to 0.2, 0.3, 0.5, and 1, from the
Publisher’s Note: MDPI stays neutral      most distant year to the most recent, respectively). If a team only played friendlies over two
with regard to jurisdictional claims in   years, the friendlies had a total weight approximately equal to 0.75 of all the team’s results
published maps and institutional affil-   of the past four years. Thus, paradoxically, even if a host scores very well in the friendlies,
iations.                                  its position in the rankings is usually doomed to decline. FIFA has vaguely acknowledged
                                          that host teams have “less opportunity for getting more points” [1]. There are also various
                                          publications that describe the problem with respect to specific hosts; for example, Wang and
                                          Vandebroek [2] described how their ranking system and its variants would have avoided
Copyright:      © 2022 by the author.
                                          the host effect problem for the organizers of Euro 2012—Poland and Ukraine.).
Licensee MDPI, Basel, Switzerland.
                                                Consider the 2018 soccer World Cup that took place in Russia. At the time, Russia was
This article is an open access article
                                          criticized by various countries for the annexation of Ukrainian Crimea and the “hybrid
distributed under the terms and
                                          war” in Donbass. Ultimately, the presidents of some participating countries decided to
conditions of the Creative Commons
Attribution (CC BY) license (https://
                                          skip the World Cup. Another problem was the poor standing of the Russian team. On
creativecommons.org/licenses/by/
                                          7 June 2018, just before the first match, the Fédération Internationale de Football Association
4.0/).                                    (FIFA) rated Russian Sbornaya at position 70, the lowest ranked team of all 32 World Cup

Games 2022, 13, 22. https://doi.org/10.3390/g13020022                                                            https://www.mdpi.com/journal/games
Games 2022, 13, 22 2 of 22
competitors. Critics pronounced that the Russian team was “arguably the poorest in the
history of Russian football” [3], saying that Russia was lucky to be drawn in a relatively
easy first-round group, but also that this was “even better news for Uruguay, Saudi Arabia
and Egypt, because they get to face Russia—the worst Pot 1 team by a wide margin” [4].
In fact, Russia turned out to be a tough opponent and achieved considerable success in
the tournament. For major competitions, teams are grouped into “pots”: Pot 1 includes
the top-ranked teams worldwide (for the World Cup or preliminaries) or within each
confederation (for Confederation Cups or preliminaries); Pot 2 includes the same number
of teams ranked immediately lower, and so on. Each grouping includes one team from
each pot.
Russia humiliated Saudi Arabia 5:0 and convincingly beat Egypt 3:1 in the first-group,
round-robin phase of the 2018 World Cup. Ultimately, Russia became the first team to
advance to the last-16 knockout phase. Among the eight Pot 1 teams, Poland and Germany
failed to qualify, and Argentina did so only thanks to a last-minute goal. Russia’s “safety
margin” was comfortable: they would have advanced due to their superior goal difference.
Then, in two dramatic matches, Russia first beat the soccer superpower Spain in a penalty
shoot-out, and then narrowly lost a penalty shoot-out to Croatia—an ultimate finalist that
lost only to France. Russia was thus very close to advancing to the semifinals.
Better-than-expected performance of the host of a tournament is likely to be partly
due to home-field advantage, an effect widely observed in major soccer national leagues
(see Table 2 in [5]. However, the potential home bias effect comes during the tournament,
whereas any substantial host’s slide in the rankings precedes the tournament. Thus,
possible home bias present in tournament results does not explain the pre-tournament fall
Games 2022, 13, x FOR PEER REVIEW
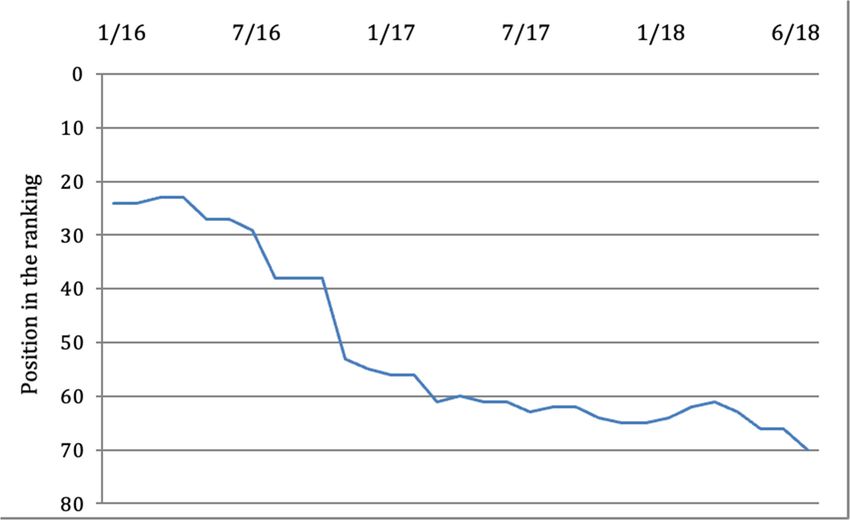
in the rankings (see Figure 1). Reviewing Russia’s record, we must ask: was it really an 3 of 23
overperformance of the Russian team? Systems other than the FIFA’s ranking rated the
Russian Sbornaya much higher: from 42 [6] to 45 [7], and 49 [8].
Figure 1. Russia’s downturn in FIFA rankings in the 30 months prior to the 2018 World Cup. Note:
Figure 1. Russia’s downturn in FIFA rankings in the 30 months prior to the 2018 World Cup. Note:
Figure illustrates Russia’s position in the FIFA rankings from January 2016 to June 2018. A major
Figure illustrates Russia’s position in the FIFA rankings from January 2016 to June 2018. A major
slide follows the start of the preliminaries on 4 September 2016.
slide follows the start of the preliminaries on 4 September 2016.
In this paper, I investigate this perverse “host effect,” which can lead to what I term
a “host paradox”. The “host effect” was originally introduced by Kaminski [9]. The
preliminary analysis dealt mostly with the performance of the Polish team and the data
were limited to pre-2012 tournaments. In Section 2, I begin by reconstructing the details
of the former FIFA ranking system and briefly discuss a few paradoxical traits of theGames 2022, 13, 22 3 of 22
Similar cases of “overperformance” have happened in previous tournaments as well,
and they also involved tournament hosts outperforming expectations. In almost all cases,
the tournament was preceded by a long slide of the host in the ranking. As mentioned
earlier, the problem was that FIFA’s ranking system seriously undervalued the friendly
matches played by the tournaments’ hosts, whereas other teams played in highly valued
preliminaries. The preliminaries for the 2018 World Cup started as early as 12 March 2015
(in Asia), and as late as 4 September 2016 (in Europe), and they lasted until 15 November
2017. Thus, in the time leading up to the 2018 World Cup, Russia had predictably been
sliding in the world rankings (see Figure 1).
In this paper, I investigate this perverse “host effect,” which can lead to what I term
a “host paradox”. The “host effect” was originally introduced by Kaminski [9]. The
preliminary analysis dealt mostly with the performance of the Polish team and the data
were limited to pre-2012 tournaments. In Section 2, I begin by reconstructing the details
of the former FIFA ranking system and briefly discuss a few paradoxical traits of the
ranking. In Section 3, using the data from past tournaments, I examine the magnitude of
the host effect. Next, I discuss possible solutions to the paradox. Finally, I conclude with an
assessment of the paradox’s consequences.
2. The Paradoxes and Strategic Manipulability of FIFA’s Ranking System
FIFA is the international governing body of 211 national soccer associations. Founded
in 1904 and headquartered in Zürich, Switzerland, FIFA is managed by a 25-member
executive committee, which is headed by a president. FIFA’s main activity is the organi-
zation of the FIFA World Cup, the preliminaries, and other tournaments. It coordinates
the activities of six regional federations that supervise their members’ local championships
and friendlies. The six federations include the Asian Football Confederation (AFC, with
Australia included); Confederation of African Football (CAF); Confederation of North,
Central American and Caribbean Association Football (CONCACAF); South American
Football Confederation (CONMEBOL); Oceania Football Confederation (OFC); and Union
of European Football Associations (UEFA).
Among FIFA’s highest profile activities is announcing its monthly ranking of national
soccer teams. From this ranking, the media duly notes the positions of the teams, and their
exact location—whether high or low—can affect the generosity of team sponsors. Moreover,
a team’s ranking determines its chances of drawing opponents in the preliminaries and
main tournaments of the various cups, including the World Cup, because of its allocation
among different pots. Having a higher ranking implies a lower expected ranking of
opponent. For example, consider team A from Pot 1 versus team B from Pot 2. A and
B have the same chance of meeting any specific opponent from Pot 3 and higher pots.
However, in addition, A will face one opponent from Pot 2 while B will face one opponent
from Pot 1. The position in the ranking is a proxy for the teams’ level of strength; therefore,
A will theoretically face a weaker opponent than B.
FIFA’s ranking system has evolved over time. Before a major rule change that occurred
in 2018, the previous system (established in 2006) factored in the results of the official
matches that the national team played in during the previous four years, their opponents’
ranking positions, the strength level of the opponents’ federations, and the importance of
each match. Each team receives points for every game it plays. Then, about once a month,
the teams’ average scores are calculated for the past 12 months, the 12 months before that,
etc. A team’s ranking position reflects its weighted average score for the prior 48 months, a
sort of a moving weighted average. The details of the procedure are presented in Table 1.
The procedures, scores, and ranking positions are drawn from FIFA’s website [10]. It should
be noted that the procedure for ranking women’s soccer teams is different; see [11] for a
comparison of the FIFA men and women ranking systems.Games 2022, 13, 22 4 of 22
Table 1. Factors affecting the scores for individual matches.
Factor Symbol Definition
Match score ms Victory: 3; tie: 1; defeat: 0; penalty shoot-out: 2 for winner, 1 for loser
Friendly: 1; preliminaries to World or Federation Cup: 2.5;
Match weight mw
Federation or Confederation Cup: 3; World Cup: 4
r = 1, st = 200
Opponent strength st For opponent ranked r: 1 < r ≤ 150, st = 200 − r
r > 150, st = 50
Federation strength fs In June 2018: CONMEBOL—1; UEFA—0.99; other—0.85
Note: If preliminaries included a two-match game, and if the results were symmetric, the result of the second
match was disregarded and the points were assigned as if penalties were applied. Supposedly, a change took place
in 2012 regarding this aspect, but the exact new rules were never perfectly clear and could not be reconstructed.
A score for every match was equal to the product of four factors characterizing the
strength of the opponent (as a sort of inversed ranking) and its confederation, the match’s
importance, and the match’s result:
sm = ms × mw × st × f s (1)
The average score for the year (beginning at a certain date and ending exactly 12 months
later) was equal to the arithmetic mean of all matches if the team played at least five times.
With a smaller number of matches (i.e., between 0 and 4), the average was multiplied by
0.2 × m. The position in the ranking, r, at a given moment represented the total weighted
sum of points over the previous four years according to the formula:
s = sm−1 + 0.5 sm−2 + 0.3 sm−3 + 0.2 sm−4 (2)
where sm−i was the average score of the matches played over the period between 12(i − 1)
and 12i months previously.
2.1. The Model
The problem of ranking certain objects based on individual information was first
formalized by Arrow [12] and was implicitly present in various earlier works of welfare
economists. Arrow’s simple setup involved assigning linear social orderings to all profiles
of individual linear orderings. In the Arrowian approach, there was no “true” underlying
social ranking, but only the aggregation of preferences; on the other side of the continuum,
there are problems such as Condorcet jury, where the task is to find the underlying true
outcome. Soccer and other sport rankings occupy the position somewhere between the two
extremes: there is no true deterministic ranking of team’s strength. The ranking should be
probably treated as some probabilistic device that provides estimates of teams’ strengths or
a semi order, where only big differences in the scores are meaningful. It is intuitively clear
that a strong team paired with a weak team would have a better chance of winning, but
it is also clear that this relation is not deterministic. Empirically, the situation resembles
selecting a competition winner based on experts’ judgments. There is some arbitrariness in
the judgments, but they are also not completely detached from candidates’ performance
(see, e.g., [13]). Empirical analysis of factors affecting match results such as home bias is
performed using success functions [5].
FIFA’s soccer rankings consider much more complex information than preference
profiles. Moreover, the constraints on certain relevant parameters are not well defined.
The informal model formulated below is “excessive” in that it covers an excessive domain
that encompasses all possible combinations of information components, but also some
combinations that would not happen in reality. The ranking is defined for a specific date
and aggregates the information over a period of time. The parameter “time” assumes
all dates from the prior 48 months as values. Our goal is to define all components thatGames 2022, 13, 22 5 of 22
are necessary for the application of Equations (1) and (2). The model’s contribution is in
providing a formal delineation of all possible FIFA-like rankings.
We start with a non-empty and finite set of countries C, which is partitioned into
non-empty subsets called federations. Each federation Ci is assigned a weight 0 < wi t ≤ 1
that may assume different values in time. The exact formula for determining federation
weights is unknown.
A match is a vector that includes two different countries from C, their federation
strengths, their individual strengths, the match weight (see “Match weight” in Table 1), the
score, and the time.
The domain D includes all FIFA profiles d that are vectors with their subsequent positions
defined as follows:
• Date of ranking.
• Set of countries C.
• The initial ranking of all countries from C, 48 months before the ranking’s date.
• The initial scores of all countries from C, 48 months before the ranking’s date.
• Exact dates of recalculating the ranking (once a month).
All matches over the 48-month period are considered (the assumed minimal constraint
is that no country can play two or more matches on the same day).
A FIFA score function S : D → RC assigns a numerical score to all countries from C
according to Equations (1) and (2). A FIFA ranking F : D → RC is a function that assigns a
weak ordering to all countries from C that for each specific profile d represents S(d).
In a generic championship tournament (such as the World Cup or Confederations
Cups), the rankings are fixed for the entire tournament’s period. Then, all matches played
by a team enter the calculation of the next ranking. Typically, half of the teams end by
playing only group-stage matches, and the others advance for play-offs. The weights
for such matches are substantial (4 for the World Cup and 3 for Confederations Cups);
therefore, the impact of tournaments on the final rankings is often substantial.
We assume that C does not change over time, which is a slight simplification because
new countries are added or countries that cease to exist, such as Czechoslovakia, the Soviet
Union, or Yugoslavia, may be excluded. The model formulated above includes many FIFA
profiles that could not happen in real calculations of the ranking. For instance, no team
could play matches on every day over 48 months. Another excess is created by the fact
that the algorithm for changing the confederation strengths is unknown. Probably, it is
an endogenous function of the results of matches of the members of a given federation.
However, the purpose of the model was to encompass all actual FIFA profiles; the excess is
impossible to eliminate due to the lack of information on the constraints on profiles, such
as the number of matches a team can play.
Due to the complexity of information involved in FIFA rankings, the informational
connection with Arrowian social choice is not very strong. The feature connecting the two
models is the vulnerability to paradoxes of the FIFA function and Arrow’s social welfare
functions. The excessive character of the model does not allow the formulation of any global
paradoxes, because such a paradox could be due to the excess of the model that could not
happen in actual calculations. However, it is possible to identify and discuss local paradoxes.
Such paradoxes involve some subsets of FIFA profiles that are characterized with parameter
combinations, which are known to be possible (in some cases, which actually happened).
The paradox appears when the ranking functional F is applied to some subset or subsets of
profiles and returns results from some other subset or subsets of profiles that have some
counterintuitive properties. A sample of local paradoxes is discussed below.
2.2. Paradoxes and Strategic Manipulability
FIFA’s web page declares that “The basic logic of these calculations [the rankings] is
simple: any team that does well in world football wins points which enable it to climb the
world ranking” [10]. Unfortunately, FIFA’s ranking system has sometimes violated this and
other simple properties; in other words, it was vulnerable to paradoxes.Games 2022, 13, 22 6 of 22
Voting paradoxes were first investigated by Condorcet and Dodgson (see [14,15]). The
term “paradox” was made popular in social choice theory, and especially in its political
science applications, in books by Brams [16] and Ordeshook [17]. The idea denotes a
situation where a ranking behaves contrary to basic intuition, i.e., it does not satisfy certain
properties that would be informally considered “obvious”, “desired”, or “fair”. FIFA’s
ranking has generated multiple paradoxes and multiple incentives for strategically sensible,
but also apparently counterintuitive behavior.
Vulnerability to paradoxes is often closely related to vulnerability to manipulation.
Farquharson [18] suspected that Arrow’s theorem implies manipulability of all reasonable
voting methods; this suspicion was later proved by Gibbard [19] and Satterthwaite [20].
This is also the case with FIFA’s ranking. Lasek et al. [21] listed several methods for the
“optimization” of a team’s position in the FIFA rankings that include choosing the number
of matches, selecting the ideal opponents, avoiding friendlies, and creating score-improving
coalitions. Wang and Vandebroek [2] further analyzed such strategic opportunities; as did
Kaiser [22,23] in another sport.
Certain features of the FIFA formula were bound to generate criticism from soccer
fans. For instance, the number of points did not depend on whether a team played at home.
Thus, in a match of similar importance, a team would receive more points for defeating
Qatar at home (the controversial organizer of the 2022 World Cup, and, as of 7 June 2018,
ranked 98th) than for a tie with Brazil (ranked 2nd) played in the famously intimidating
Estádio do Maracanã in Rio de Janeiro. Using the ranking positions and other data as
of 7 June 2018, for any team, victory over Qatar would generate 102 × 3 × 0.85 = 260.1;
however, a tie with Brazil would generate 198 × 1 × 1 = 198. The problem arises both
with disregarding who was the host of the match and with the relatively high score of the
weaker opponent.
Another problem is with the scores attached to friendlies. It is well understood that
friendlies provide fewer points; therefore, a team that did well in the preliminaries could
strategically avoid playing friendlies. For instance, Romania was criticized before the 2018
World Cup preliminaries for strategically playing only one friendly (and being seeded).
Similarly, Poland was criticized before the 2018 World Cup for not playing friendlies until
the ranking seeded them in the top pot. Thanks to such quirks, a team could climb the
rankings despite common wisdom that would have placed that team much lower. Notably,
in September 1993, as well as in July and August 1995, a relatively weak team of Norway
was ranked second, whereas in April 2006, the United States was ranked fourth. When we
reverse the ranking dates, in September 1993, the United States was ranked 26th, whereas
in April 2006, Norway was ranked 40th.
Various paradoxical results happen systematically that are less obvious than “strategic
match avoidance” and can be analyzed formally.
2.3. The Violation of Weak Goal Monotonicity
Intuitively, one might assume that a team’s score would increase, or at least stay
unchanged, with each additional goal won by that team. However, until 2012, FIFA’s
rules sometimes violated this property, which may be called “weak goal monotonicity”. A
violation happened when preliminaries included a two-legged, home-and-away fixture.
When the results were symmetrical, the result of the second match was disregarded, and
the points were assigned as if penalty shots were applied.
For all teams A, B ∈ C, let us denote the score of team A from a match between A
and B when A scores a goals and B scores b goals as sm a,b . A more formal definition of this
property is as follows:
Weak goal monotonicity: For all teams A, B ∈ C and for all matches between A and B,
sm a+1,b ≥ sm a,b .
As an example, I provide the following scenario. Team A plays against Team B in
a two-match competition to advance to the next round. A first defeats B at home 3:0,
and then loses 0:3. If the match had ended at 0:2, A would have advanced to the nextGames 2022, 13, 22 7 of 22
round, receiving zero points for the lost match. When A concedes the third goal, the
score becomes symmetrical (3:0 and 0:3), and the result of the second match is decided
by penalties. However, crucially, we find that A’s score for this match would increase
with the conceding of a third goal, regardless of the result of the penalty shoot-out: If A
loses the penalty shoot-out, they receive some points with a multiplier of 1; on the other
hand, if A wins, the multiplier will be 2. In both cases, we see that the number for A is
positive, instead of receiving zero for losing 0:2. As an effect, conceding the third goal
by A automatically increases A’s FIFA score for the match and, paradoxically, possibly its
position in the rankings. Conversely, the mirror problem occurs for Team B, in that it would
receive more points for a match won 2:0 than for winning 3:0, regardless of the result of the
penalty shoot-out.
This “weak goal monotonicity” paradox has appeared in several matches. In the
Jordan–Kyrgyz Republic preliminaries on 19 October 2007, Jordan lost 0:2, and 10 days
later, beat Kyrgyz Republic at home 2:0. Let us calculate the actual and hypothetical score
for Jordan from the second match. The weights are as follows:
• 0.85—Opponent confederation’s strength.
• 67—Opponent’s strength (Kyrgyz Republic on 24 October 2007 was ranked 133).
• 2.5—Match’s weight (World Cup qualifier).
• 2—Match’s score (Jordan won 2:0, and then it won penalty shots 6:5).
Jordan received a score of 284.75 for this match, i.e., the product of the four numbers
listed above. For winning only 1:0, the last number on our list (the Match’s score) would
have been equal to 3, and Jordan would have received substantially more—
0.85 × 67 × 2.5 × 3 = 427.125 points [24]. A similar problem was noted when, on
12 July 2011, Saint Lucia defeated Aruba 4:2 after having lost previously, also by a score
of 4:2. Furthermore, in November 2005, Australia beat Uruguay in a penalty shoot-out
after first losing 0:1, and then winning 1:0. Losing the goal guaranteed Uruguay the same
score as losing on penalties, or a better score in the case of winning the penalty shoot-out.
Apparently, FIFA fixed this problem, although no proclaimed correction of the rules can be
found [25]. For a comprehensive discussion of the problem, see [24].
In general, similar problems always appear when the result of a two-match competition
is settled by penalties. Penalties constitute an additional “mini-match” played after two
symmetrically completed games. If a penalty shoot-out affects the score, then we encounter
difficulties such as those described above. If the penalties do not affect the score, then the
fact that one team beat the second one overall is disregarded.
2.4. Examples of Paradoxes and Their Strategic Consequences
Certain FIFA’s ranking local paradoxes are associated with non-intuitive shifts in the
ranking positions and violations of different versions of monotonicity (see Kaminski 2012).
The following examples involve subsets of FIFA profiles with certain parameters fixed;
under suitable ceteris paribus clauses, they illustrate the ranking’s potential for generating
paradoxes. Each of the examples discussed below can be formulated as an appropriate
property or axiom that is violated.
In the examples below, we assume for simplicity that: (a) all teams (Reds, Blues, and
possibly Greens) played exactly five matches in the prior 12-month period; (b) all matches
played in the previous 48 months would not be reclassified into a different period after
the ranking is modified; (c) no other matches were played between the time of the old and
new rankings by the teams in the examples or any other teams; and (d) the federations’
strengths are equal to 1. The scores are rounded in the usual way.
Example 1. Winning a match moves the winner behind the loser.
The paradox is that, initially, Reds are ranked higher than Blues. In a friendly match,
Reds defeat Blues, and as a result, Reds fall behind Blues in the ranking. For all teams
R, B ∈ C, let us denote R winning a match against B as RwB. Let us denote the rankingGames 2022, 13, 22 8 of 22
of R and B before their match as r(R) and r(B), and the rankings after their match as r*(R)
and r*(B).
Strong ranking reversal: For all teams R, B ∈ C and for all matches, [r ( R) < r ( B) & RwB]
→ r ∗ ( R ) < r ∗ ( B ).
The numerical example illustrating the violation of this property is as follows:
• Reds: #20 in the ranking; 12 m points: 1100; total points in all previous periods: 200.
• Blues: #30 in the ranking; 12 m points: 200; total points in all previous periods: 1050.
According to our assumptions, Reds are ranked higher than Blues with the total
of 1100 + 200 = 1300 points versus 200 + 1050 = 1250 points. Now, in a friendly match,
Reds defeat Blues. Let us calculate the scores of both teams in the next ranking using
our assumptions:
• Reds receive 200 + 5/6 × 1100 + 1/6 × 170 = 1145.
• Blues receive 1050 + 5/6 × 200 + 1/6 × 0 = 1216 2/3.
The next examples present the numbers that generate the described paradoxes in more
concise formats. The rubrics in the examples are defined as follows:
• Team—the name of team.
• Ranking—team’s ranking.
• Score (last)—the average score from last year (five matches).
• Score (3)—the average score from three previous years.
• Final—the final score after the match or matches.
Example 2. Ranking leaders doomed to fall after the match regardless of the result.
Reds and Blues occupy the top two positions in the ranking. After their friendly
match, a different team, Greens, is ranked first, regardless of the result. The property
that is violated here may be formulated in a slightly more general way without assuming
any specific positions for the three teams. Again, r(.) denotes the ranking before a match
between R and G and r*(.) denotes the ranking after the match. We assume that the only
change in the parameters that happens is a single match between R and B.
Automatic exchange of leaders: For all teams R, B, G ∈ C, if r ( R) < r ( G ) & r ( B) <
r ( G ) then r ∗ ( R) < r ∗ ( G ) or r ∗ ( B) < r ∗ ( G ).
A numerical example in Table 2 shows how this property may be violated.
Table 2. Automatic exchange of leaders.
Team Ranking Score (Last Year) Score (3) Final
Reds 1 1000 1000 no more than 1932
Blues 2 990 1000 no more than 1933
Greens 3 950 1000 1950
Greens did not play a match; therefore, their score remained the same and was equal to
1950. The ranking’s leader, Reds, received a post-match score of, at most, 1932 points (in the
best-case scenario of winning against Blues), whereas Blues received, at most, 1933 (when
winning against Reds). Let us provide the explicit calculations for Reds’ best-case scenario:
The final score is equal to 1000 + [5/6 × 1000 + 1/6 (3 × 198 × 1 × 1) = 1932
In both cases, Greens have the highest score and become the new ranking leader.
Example 3. Coalitional manipulations increase the scores of both teams.
This property demands that when two teams play two consecutive matches, then it is
impossible for them to jointly manipulate the scores. For two teams R, B ∈ C, let us call
the results of a pair of matches between R and B a scenario, i.e., a scenario includes two
coordinates where the first one represents the result of match 1 for R (win, tie, loss) and theGames 2022, 13, 22 9 of 22
second one represents the result of match 2 for R. For any two scenarios Si , let us denote
the points score by team R under Si as Si (A).
1 2 1
2 1 2
all teams R, B ∈ C and any two scenarios S , S , [S ( R) >
Coalition-proofness: For
S ( R)] → [S ( B) ≤ S ( B) .
The property says that R and B can never manipulate the results of the two matches to
simultaneously increase their scores as compared with some alternative scenario.
This problem appears always when, assuming the unchanged parameters between
the two matches, in S1 there are two ties and in S2 R wins once and B wins once. In such a
case, the higher multiplier for winning is equal to 3, whereas the combined multiplier for
the two ties is equal to 2; this means that agreeing to one loss and one win versus two ties
increases both teams’ total scores by 50%.
Example 4. Tournament punishes the winners.
Teams Reds, Blues, and Greens play in an informal round-robin tournament in one
group. Ranking before the tournament: Reds–Blues–Greens; results of the round-robin:
Reds win, Blues are second, and Greens are third (RtBtG); ranking after the tournament:
Greens–Blues–Reds.
Without unnecessary formalizing the rules for a round-robin tournament, we use the
common rules that the teams are ranked according to their total points and the tie-breaking
rule is the surplus of goals (which is sufficient for our example). In this example, r(.) denotes
the rankings before the tournament and r*(.) denotes the ranking after the tournament. We
assume that the only change in the parameters that happens are three pairwise matches
among R, B, and G.
Tournament reversal: For all teams R, B, G ∈ C and any tournament T, [ RtBtG & r ( R) < r ( B)
< r ( G )] → ¬(r ( R) > r ( B) > r ( G ).
In our example of how the Tournament Reversal property may be violated, we assume
that the results of the matches were as follows: R:G 2:0; R:B 0:1; B:G 0:1. Thus, the
tournament results are RtBtG. Additionally, the initial rankings are r ( R) < r ( B) < r ( G ).
If we calculate the score of Reds after the tournament, we will derive 57 × 1000 + 71 × 3 ×
197 + 500 ≈ 1299, with the usual rounding. The results of calculations for the remaining
teams are presented in Table 3.
Table 3. Tournament reversal.
Team Ranking Score (Last) Score (3) Final
Reds 1 1000 500 1299
Blues 2 780 700 1343
Greens 3 560 900 1385
After the tournament, the ranking of Reds, Blues, and Greens was reversed.
Example 5. Winning consecutive matches causes a slide in the ranking behind the losers.
Reds play matches in an informal play-off tournament; these are classified as friendlies.
With each consecutive win, the position of Reds in the ranking declines behind the position
of the opponent who lost. Now, r0 ( R), r1 ( R), r2 ( R) represent the initial ranking of Reds,
their ranking after the first match, and their ranking after the second match, respectively;
w1 , w2 denote winning in the consecutive matches. We assume that the only change in the
parameters results from two consecutive matches of R against B, and R against G.
Play-off cannot reverse rankings inversely to results: For allteams R, B, G ∈ C, [r0 (R) < r0 ( B)
& Rw1 B & r1 ( R) < r1 ( G ) & Rw2 G ] → ¬ r1 ( R) > r1 ( B) & ¬[ r2 ( R) > r2 ( G ) .
Initially, Reds are ranked higher than Blues. In a play-off, they beat Blues, and after
the match, they slide below Blues in the ranking. After this match, Reds are still ranked
higher than Greens, but after winning the play-off against Greens, they slide below theGames 2022, 13, 22 10 of 22
Greens. The last column “Scores” represents the teams’ total scores before the first match,
after the first match, and after the second match, respectively (see Table 4).
Table 4. Play-off reverses rankings inversely to results.
Team Ranking Score (Last) Score (3) Scores
Reds 1 1000 200 1200/1132/1084
Blues 2 290 900 1190/1142/1142
Greens 3 250 900 1130/1130/1108
The common core problem for many examples discussed above is the low score
assigned to friendlies, and the fact that the means for the four years are computed in
the ranking independently. If a team’s high ranking depends mostly on an outstanding
previous year, then even a very high victory in a low-value friendly with the ranking leader
may ruin that team’s position. On the other hand, for a team with a weak previous year,
even a defeat may be negligible.
The paradox described in Example 3 (Coalition-proofness) is based on another prop-
erty of the index. Namely, the total number of points acquired by both teams in a match
is not constant. In the case of a tie, the total is 1 + 1 = 2, whereas in the case of one
team’s victory, it is 3. This creates some room for coalitional manipulation described in
this example.
An obvious strategic incentive facing a team trying to maximize its position in the
ranking is “match avoidance” or “match delay” to avoid playing low-scoring friendlies
or to move them to a different period for calculating ranking positions. Under some
conditions, both strategies could be also optimal for a host team to maximize its position
in the rankings. For instance, in Example 5, an obvious incentive for a rank-maximizing
team is to lose their first match and become eliminated from further matches. In Example 2,
rank-maximizing teams should not be playing a match at all, or possibly register such a
match as being played between their reserves rather than the top national teams.
3. Estimation of the Host Effect
An example of how the host paradox has affected teams is provided by the matches
played in 2011 by Poland, a co-host of Euro 2012. Out of 13 matches, Poland won 7, tied 3,
and lost 3. In these matches, they beat strong opponents, such as Argentina (ranked 10th
at the end of 2011) and Bosnia and Herzegovina (ranked 20th); lost in close games with
Italy (ranked 9th) and France (ranked 15th); and tied in their matches with Greece (ranked
14th), Germany (ranked 2nd), and Mexico (ranked 21st). Overall, 2011 was a good year
for Poland, and much better than the previous two years (in 2010, Poland’s victories, ties,
and defeats were 2, 6, and 3, respectively). Despite 2011 being a very good year for Poland,
the team ended 2011 ranked 66th with 492 points—only slightly better than their finish in
2010, which was a terrible year for them, where they ranked 73rd, and lower than their
final ranking in 2009, 58th, before the start of the preliminaries. Meanwhile, Ukraine, the
other co-host of Euro 2012, was punished by FIFA’s ranking system as well. At the end of
2009, Ukraine was ranked 22nd; in 2010, the team fell to 34th; and ended 2011 in 55th place
despite having quite a good year.
The difference in the weights for the friendlies versus the preliminaries is responsible
for this disconcerting fall in rankings if everything else is held constant. In Section 4, I
recalculate hypothetical scores for three recent tournament hosts (Russia, Poland, and
Brazil) using three different corrections to the ranking to illustrate how they would have
been ranked much higher if they had not been punished with the low weight attached
to friendlies.
The estimation of the host effect presents substantial methodological challenges. First,
the data did not come from a “representative sample,” but rather, were generated by three
processes: the nonrandom selection of the host, the nonrandom selection of matches, and
the random process of the results of matches with an unknown distribution. I believeGames 2022, 13, 22 11 of 22
that the first process could have affected the analysis in a noticeable way—mostly for the
World Cup—whereas the second process did not introduce any systematic bias (see [26]
on sample selection bias in the FIFA rankings). Second, in my calculations, I used ranking
positions, rather than FIFA scores, which created a problem due to the ordinal measurement.
However, the paradox in the host effect that I am interested in is caused by a host’s low
position in the rankings. Any result obtained with FIFA scores would have to be translated
into a mean ranking loss, which would recreate the ordinality problem.
Below, I discuss three alternative methods. The data used in this analysis included
26 hosts of eight World Cups, nine Asian Cups, and nine Euro Cups. After the change in
the ranking methodology in 2006, FIFA recalculated the teams’ rankings back to the year
1993, which meant that the tournaments which took place from 1994 onward were included.
Certain regional tournaments were omitted: specifically, the CAF and CONCACAF take
place biannually, and their preliminaries are held in the same year as the main tournaments,
which creates a short life span for a potential host effect. Additionally, the CONMEBOL has
a small number of members and no preliminary rounds, and the OFC has lower-ranked
teams, with 11 official members; the best team is New Zealand, ranked 119th.
3.1. Average Dip in the Rankings
Considering the above, the most obvious question to ask is: what is the average dip
(i.e., drop in positions) in the rankings caused by the host paradox? To begin to answer this
question, we assume the following notation for the key variables:
T—year of the tournament.
rT —last ranking before the tournament (in the case of unclear timing, we use the
ranking from the month immediately preceding the month of the tournament).
rP —the ranking immediately preceding the start of host’s confederation preliminaries.
rT+4 —the first ranking in January or February of year T + 4.
∆ = r T − 1/2(r P + r T +4 )—the estimated individual host effect.
At the time of rP , there were no negative consequences of future preliminaries, whereas
at the time of rT+4 , the preliminaries were too old to be included in the calculations. The
mean of both rankings was used to smooth random variations in the teams’ levels of
performance and the potential effect of the growing FIFA membership. There is no good
reason to assign speculatively unequal weights to both rankings. Finally, rT is the last
ranking before the tournament, where the preliminaries still carry heavy weight; this
is publicized in the media and is often used as a measure of the host’s strength (see
Appendix A). A bar over a variable denotes its mean value.
Table 5 displays the calculations of r P , r T +4 , and r T for the Euros, the Asian Cup,
the World Cup, and all three competitions combined. Hypothesis 1 operationalizes the
conjecture of the host effect and states that a positive fall in the ranking equal to ∆ can
be identified:
Table 5. The average positions and changes in the FIFA rankings for the hosts of major tournaments
since 1994.
¯ ¯ ¯ ¯
Tournament Number of Hosts rP rT r T+4 ∆
All major 26 50.4 64.7 50.6 14.2
Euros 9 25.4 42.2 23.9 17.5
World Cup 8 32.0 36.1 17.0 11.6
Asian Cup 9 89.6 112.4 100.4 17.4
Note. Rounding resulted in slight discrepancies in the means. Nonparametric binomial tests were performed,
with rT > rP and rT > rT+4 counted as “successes” and rT < rP and rT < rT+4 counted as “failures” (any ties were
disregarded; q signifies the probability of success). The p-values for the one-sided test “H0 : q = 0.5” versus “HA :
q > 0.5”: Euro + World + Asian p < 0.001; Euro p < 0.001; World Cup p ≈ 0.008; Asian Cup p ≈ 0.008. Appendix A
provides data for all 26 hosts. See the introduction to Section 3 for the explanation of the choice of tournaments.Games 2022, 13, 22 12 of 22
Hypothesis 1 (H1). ∆ > 0.
The overall average dip in rankings, as represented by ∆, is equal to 14.2. For all cases,
the estimated dips are positive and are in double digits; additionally, the p-values are small
despite low counts for the regional tournaments. After conducting calculations, we find
that Hypothesis 1 is corroborated in all cases.
The exact estimates for specific tournament types must be treated with caution due to
the small counts. We see that the smallest host effect appears in the World Cup—a change
of +11.6. One mitigating factor here might be the fact that, except for Russia, all recent
World Cup host teams were very strong in their respective federations. One or two years
before the World Cup, all eight teams participated in main regional tournaments, where
it was relatively easy to qualify (see the analysis of Brazil in Section 4.3). Additionally,
six out of the eight host teams also took part in the previous World Cup. Thus, the host
effect was partially offset by the nonrandom process of selecting the hosts, i.e., the higher
probability of the World Cup being hosted by regionally strong teams, which have more
opportunities to play in heavily weighted matches than weak teams, and which also lose
less often due to not playing in preliminaries. Moreover, one year before the World Cup,
FIFA also organizes a small Confederations Cup. In this competition, both the host and
the world champion play the champions of the regional confederations. This gives the
strong host teams a relatively easy opportunity to earn heavily weighted points against the
champions of smaller confederations.
Many more teams play in the regional Confederation Cups than in the World Cup.
Thus, nonparticipation in the World Cup preliminaries is offset to a greater degree by
participation in the Confederation Cups than vice versa. One would expect a stronger
effect for the hosts of regional preliminaries than for the hosts of the World Cup. The data
corroborate this conjecture.
We find that a strong host effect appears for the Asian Cup (+17.4). Here, one can
speculate that the effect is relatively less diluted by participation in the other main tourna-
ments, because the teams in the Asian Cup are substantially weaker than the teams of the
organizers of either the World Cup or the Euros (see Appendix A). Every World Cup host
except for Russia took part in the previous Confederation Cups; however, no Asian Cup
host, except for China, participated in the previous World Cup. China gained nothing from
their participation because they earned no points and scored no goals. Thus, the hosts of
the Asian Cup earned their ranking points only in federation preliminaries, federation main
tournaments, the World Cup preliminaries, and in friendlies. The only non-systematic effect
influencing the results was nonparticipation in the regional championships. Additionally,
the teams participating in the Asian Cup occupy lower positions in the ranking, where
fewer points are needed on average for climbing the ranking. Thus, participation in the
preliminaries leads to greater average gains than for competitors in the World Cup.
In the case of the Euros, organized by the UEFA, the high host effect of 17.5 could
have been somewhat reduced by the fact that five out of the nine hosts participated in the
previous World Cup. Similarly to the World Cup, the hosts of the Euros have much stronger
teams than the hosts of the Asian Cup, and they also have more chances of playing highly
valued matches. Nevertheless, playing friendlies decreases the average score quickly for
high-ranked UEFA teams. Given the typically high-ranking positions of European teams,
the Euro effect seems to be most consequential.
3.2. Estimated Dip as a Function of a Team’s Position
Another question, implicitly present in the earlier discussion, is whether the dip
depends on a team’s strength. A strong team has more chances of playing in highly valued
tournaments than a weak team due to the higher probability of advancing to the regional
competitions and the World Cup. The point differences among the strongest teams are
greater on average than such differences among weaker ones. Moreover, a strong host may
additionally benefit from the FIFA’s Confederations Cup, which is held one year before theGames 2022, 13, 22 13 of 22
World Cup. All these aspects suggest that the ranking of a strong team is less vulnerable to
the host effect.
An assessment of how the host effect depends on the host’s initial ranking would allow
for a more precise estimation of the losses. Thus, an examination of the scatter plot should
help us quickly see whether the relationship is linear (see Figure 2). For the alternative
explanatory variable rT+4 , all results are nearly identical. Due to strong multicollinearity
Games 2022, 13, x FOR PEER REVIEW 14 of 23
(Spearman’s rho correlation 0.965), rT+4 and rP cannot be used jointly. A polynomial
regression returned similar results as well.
Figure 2. Scatter plot of host rankings at p and T with the regression line inserted.
Figure 2. Scatter plot of host rankings at p and T with the regression line inserted.
From
From Figure
Figure2,2,weweseesee that
that the scatterplot
the scatter plotshows
shows a clear
a clear linear
linear relationship;
relationship; the slope
the slope
is slightly greater
is slightly greater than
than1 1(see
(seeTable
Table 6),
6), which means that
which means thatthe
theexpected
expectedloss lossofof positions in
positions
theinranking
the ranking is slightly
is slightly increasing
increasing withwith
thethe increase
increase in the
in the team’s
team’s initialposition.
initial position.The
Theslides
slides of stronger teams are surprisingly consistent, whereas the slides
of stronger teams are surprisingly consistent, whereas the slides of weaker teams display of weaker teams
moredisplay more variation
variation in the graph.
in the graph. This This phenomenon
phenomenon maybe
may be caused
causedbyby two factors.
two First,First,
factors.
relatively larger differences in scores among stronger teams and some “crowding” in scores
relatively larger differences in scores among stronger teams and some “crowding” in
among weaker teams (smaller typical differences between consecutively ranked teams)
scores among weaker teams (smaller typical differences between consecutively ranked
may result in greater sensitivity to changes in the score among lower-ranked teams. Second,
teams) may result
high-ranked teamsin aregreater
likely tosensitivity
play both intothe changes in the
World Cup and score among lower-ranked
the Confederations Cup,
teams. Second, high-ranked teams are likely to play both
which may alleviate the losses associated with being the host of one of them. in the World Cup and the
As mentioned
Confederations Cup, whichCup
above, the Confederations may alleviate
offers the losses associated
extra opportunities for stronger with being
teams the host
to play highlyof one
of valued
them. As matches, and a greater
mentioned above,number of such matches
the Confederations somewhat
Cup offers counterbalances
extra opportunities the for
negative
stronger effectstoofplay
teams friendlies.
highly valued matches, and a greater number of such matches
somewhat counterbalances the negative effects of friendlies.
Table 6. Rankings before the tournament, predicted by the ranking of the preceding preliminaries
(regression rT = B × rP + C).
Variable Coef. SE(B) t p No of Obs.
rP 1.078 0.098 10.94 0.000
25
constant C 12.1 6.18 1.95 0.063Games 2022, 13, 22 14 of 22
Table 6. Rankings before the tournament, predicted by the ranking of the preceding preliminaries
(regression rT = B × rP + C).
Variable Coef. SE(B) t p No of Obs.
rP 1.078 0.098 10.94 0.000
25
constant C 12.1 6.18 1.95 0.063
Note. R2 = 0.84; Adj R2 = 0.83; F(1, 23) = 119.78. See Appendix A for data for all 26 hosts.
Longer vertical distances of the data points located in the middle from the regression
line suggest a heteroscedasticity problem, which is confirmed by tests. Thus, we know
that the estimated standard errors are biased, and that the OLS results should be treated as
representing the parameters of the population of all hosts thus far, but that one should be
cautious when interpreting them as estimates of the general relationship. Heteroscedasticity
arises, at least partially, from the one-sided constraints of the ranking. Specifically, the
fact that high-ranked teams can fall in the rankings, but that their rise is limited (and, of
course, for the first-positioned team, it cannot increase at all). Heteroskedastic two-step GLS
estimation returns a significant constant of 4.42 and a borderline significant exponential
coefficient of 0.023. However, the estimates used this way are mostly unreasonable; for
example, for rP = 25, r̂T ≈ 10.7 (negative host effect); for rP = 50.4 (mean), r̂T ≈ 96 (very
large mean effect); and for rP = 60, r̂T ≈ 289 (beyond the range of rT ). The ordinary least
squares (OLS) intercept has substantial variance; therefore, a linear regression suppressing
the intercept was also performed. Suppressing the intercept to zero would be equivalent to
the assumption that, for high-ranked teams, the host effect is almost nonexistent, which
has no justification in either theory or data. The estimate of a mean host effect in this case
was similar. The problem with heteroscedasticity may be also related to the fact that both
variables are essentially ordinal; the scatter plot of the scores could have looked differently.
Additionally, we find that the change in the host effect is surprisingly weakly depen-
dent on the initial team’s position. The intercept of 12.1 and the slope of 1.078 mean that
the host team which has a certain position in the rankings at time P could be expected to
slide down in the last pretournament rankings by 12.1 plus 0.078 times its pre-preliminaries
ranking. Thus, if one knows the host’s ranking rP , one can estimate that the position at time
T is increased by 12.1 + 0.078 rP . The average estimated dip in the rankings according to
this method is 16.0. The results corroborate that stronger teams do, in fact, slide less than
weaker ones, but also that the difference is quite small (Table 6).
3.3. Comparative Analysis of FIFA Rankings and Alternative Rankings
Although FIFA’s ranking system is the most popular one, there are alternative rankings
that use different methodologies for grading national soccer teams. If the host effect is
caused by factors specific to the FIFA ranking system, we should not be able to see it in
other ranking approaches. Conversely, if some external intervening factors are responsible
for the host effect, we should be able to identify them in the alternative rankings as well.
Table 7 repeats the values of the FIFA aggregate rankings for the tournament hosts in the
first row and shows the respective indicators compiled from the rankings produced by
two alternative systems: Elo and rankfootball. The Elo ranking system, named after the
Hungarian physicist and chess player Árpád Élö, is most notably used for ranking chess
players. Alternative rankings are cited using the websites Elo [7] and rankfootball [8]. For
Elo, the rankings were available for the beginning of years T − 2 and T + 4, and for the
last month preceding the tournament in year T for all cases except at T + 4 for the recent
hosts—France 2016 and Russia 2018. For rankfootball, the rankings were available for the
beginning of years T − 2, T, and T + 4 from the end of 1996, and except at T + 4, for the
recent hosts—again, France 2016 and Russia 2018.Games 2022, 13, 22 15 of 22
Table 7. The average positions and changes in the FIFA and two alternative rankings Elo
and rankfootball.
¯ ¯ ¯ ¯
Ranking rP rT r T+4 ∆
FIFA (repeated from Table 5) 50.4 64.7 50.6 14.2
Elo 52.1 50.9 52.8 −1.5
Rankfootball 53.6 52.5 51 0.1
Note. Nonparametric binomial tests run for rT > rP and rT > rT+4 counted as “successes” and rT < rP and rT < rT+4
counted as “failures” (any ties were disregarded; q signifies the probability of success). The p-values for the
one-sided test “H0 : q = 0.5” versus “HA : q > 0.5”: ELO—0.93; rankfootball—0.17. Note that four years after the
tournament, hosts’ FIFA rankings returned exactly to the pre-preliminary levels. For the methodology behind the
alternative rankings, see [7,8].
The calculations of the two alternative ranking systems shown in Table 7 indicate
that they are immune to systematic host-like effects. We find that the average rankings
of all three systems are quite similar for the times P and T + 4, when the host effect was
not present. However, Elo and rankfootball provide similar averages for time T before the
beginning of the tournament, but FIFA shows a big dip. Both alternative estimates of the
size of the host effect are insignificant.
4. Solutions
The host paradox could be eliminated, or substantially reduced, with various simple
solutions, as described below. It is notable that FIFA had the means to introduce a solution
to the paradox as a set of rules independent of the ranking’s properties. We describe three
such solutions and perform simulations how they would affect the positions of three recent
hosts, i.e., Russia in the 2018 World Cup, Poland in the 2012 Euros, and Brazil in the 2014
World Cup. For Poland and Russia, the elimination of the host effect would have placed
them much higher in the rankings, but still well-below the top. For Brazil, the effect lowered
their position in the ranking by a small number of positions, but without it, Brazil would
have been a clear 1st in the world for long time instead of being ranked in the middle of
the top 10.
4.1. Russia: Freezing the Host’s Score
A simple method to deal with the host paradox would be to freeze the host’s score at
about the time the preliminaries start. In fact, the European confederation UEFA applies an
equivalent solution. The UEFA uses its proprietary scoring system to assign teams to pots
and to allocate club tournament spots to club teams. The rules for the UEFA ranking make
an explicit provision for the tournament hosts:
“In the case of an association that has hosted UEFA’s Euro or FIFA’s World Cup
final tournament during one of the reference periods as mentioned under Annex
D.1.2 and therefore has no points from the respective qualifying competition, the
points earned in the most recent qualifying competition in which the association
has taken part are used.” [27]
The preliminaries to the 2018 World Cup started almost three-and-a-half years before
the main tournament, and the most important European preliminaries started approxi-
mately two years before the tournament. The exact moment of the freeze could be subject
to discussion, but for the main regional confederations, this could occur with the start of
the preliminaries and end with the last match of the preliminaries. About six months before
the tournament, after the preliminaries are over, the calculation could be unfrozen and the
score computed as if the period of freeze did not exist. About three-and-a-half years after
the tournament, the host’s score would be back to the usual calculations, i.e., with the use
of matches from the previous four years. Freezing could also be annulled if a host declares
this desire in advance.
Freezing would certainly eliminate the effects for hosts of not playing in the prelimi-
naries; however, a negative aspect of freezing would be that it would prevent any legitimateYou can also read