HPC Board Meeting April 13, 2022 - Mass.gov
←
→
Page content transcription
If your browser does not render page correctly, please read the page content below
HPC Board Meeting April 13, 2022
Agenda
         CALL TO ORDER
         Approval of Minutes (VOTE)

         Recognition of Black Maternal Health Week

         Market Oversight and Transparency

         Care Delivery Transformation

         Executive Director’s Report

         Schedule of Upcoming Meetings

                                                     2
Agenda
         Call to Order

         APPROVAL OF MINUTES (VOTE)
         Recognition of Black Maternal Health Week

         Market Oversight and Transparency

         Care Delivery Transformation

         Executive Director’s Report

         Schedule of Upcoming Meetings

                                                     3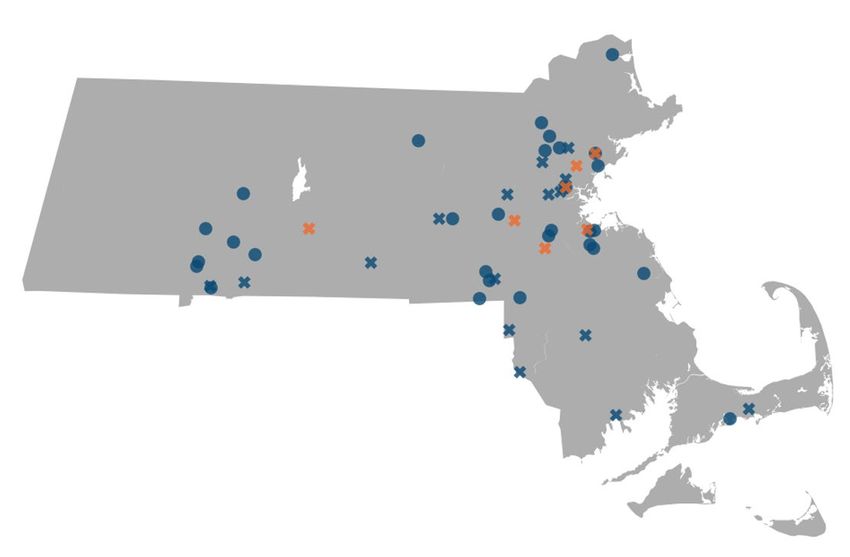
VOTE
Approval of Minutes
from the January 25,
2022 Board Meeting
                       MOTION
                       That the Commission hereby approves the minutes of the
                       Commission meeting held on January 25, 2022, as presented.

                                                                                    4
Agenda
         Call to Order

         Approval of Minutes (VOTE)

         RECOGNITION OF BLACK MATERNAL HEALTH WEEK
         Market Oversight and Transparency

         Care Delivery Transformation

         Executive Director’s Report

         Schedule of Upcoming Meetings

                                                     5
The HPC Celebrates Black Maternal Health Week 2022
Black Maternal Health Week, established five
years ago by the Black Mamas Matter Alliance,
takes place every year April 11 – April 17.
In 2021, the White House issued a
proclamation officially recognizing Black
Maternal Health Week.
According to the Black Mamas Matter Alliance,
“the campaign and activities for Black
Maternal Health Week serve to amplify the
voices of Black Mamas and center the values
and traditions of the reproductive and birth
justice movements. Activities during BMHW are
rooted in human rights, reproductive justice,
and birth justice frameworks.”
Source: Black Mama’s Matter Alliance 6Maternal Health Activities in the Commonwealth
BETSY LEHMAN CENTER HPC BESIDE
DOULA SUPPORT REPORT INVESTMENT PROGRAM
MASSHEALTH DOULA INSPiRE
REIMBURSEMENT RESEARCH PROJECT
PNQIN MASSACHUSETTS RACIAL INEQUITIES
AIM INITIATIVE IN MATERNAL HEALTH
EQUITY BUNDLE COMMISSION
7Agenda
Call to Order
Approval of Minutes (VOTE)
Recognition of Black Maternal Health Week
MARKET OVERSIGHT AND TRANSPARENCY
• Mass General Brigham Performance Improvement Plan: Request for Extension (VOTE)
• 2023 Health Care Cost Growth Benchmark (VOTE)
• Recent Market Changes
• Research Presentation: Trends in Emergency Department Use Among Massachusetts Residents
Care Delivery Transformation
Executive Director’s Report
Schedule of Upcoming Meetings
8Agenda
Call to Order
Approval of Minutes (VOTE)
Recognition of Black Maternal Health Week
Market Oversight and Transparency
• MASS GENERAL BRIGHAM PERFORMANCE IMPROVEMENT PLAN: REQUEST FOR
EXTENSION (VOTE)
• 2023 Health Care Cost Growth Benchmark (VOTE)
• Recent Market Changes
• Research Presentation: Trends in Emergency Department Use Among Massachusetts Residents
Care Delivery Transformation
Executive Director’s Report
Schedule of Upcoming Meetings
9Performance Improvement Plans: MGB Request for Extension
• On January 25, 2022, the Board voted to require Mass
General Brigham (MGB) to develop and file a Performance
Improvement Plan (PIP). MGB was required to file a proposal,
request for waiver, or request for an extension within 45 days.
• On March 14th, MGB requested an extension of the deadline to
file its proposed PIP to May 16, 2022.
• The approximately 60-day extension request can only be
approved by vote of the Board.
• MGB states that it requires additional time to develop a plan
that addresses both TME for its primary care patients and
Total Health Care Expenditures for the state, in accordance
with the standards laid out in the PIP regulation. MGB also
indicated that it would be beneficial to file its proposal after
the DPH staff reports were released on the separate matter of
MGB’s Determination of Need applications.
• Staff recommends approving the request.VOTE
Mass General
Brigham Performance
Improvement Plan:
Request for Extension MOTION
That the Commission hereby approves, pursuant to 958 CMR 10.08,
Mass General Brigham's request for an extension to May 16, 2022 to
submit a Performance Improvement Plan proposal.Agenda
Call to Order
Approval of Minutes (VOTE)
Recognition of Black Maternal Health Week
Market Oversight and Transparency
• Mass General Brigham Performance Improvement Plan: Request for Extension (VOTE)
• 2023 HEALTH CARE COST GROWTH BENCHMARK (VOTE)
• Recent Market Changes
• Research Presentation: Trends in Emergency Department Use Among Massachusetts Residents
Care Delivery Transformation
Executive Director’s Report
Schedule of Upcoming Meetings
12In 2012, Massachusetts became the first state to establish a target for sustainable
health care spending growth.
CHAPTER 224 OF THE ACTS OF 2012 GOAL VISION
An Act Improving the Quality Reduce total health care A transparent and
of Health Care and spending growth to meet innovative healthcare
Reducing Costs through the Health Care Cost system that is accountable
Increased Transparency, Growth Benchmark, which for producing better health
Efficiency, and Innovation. is set by the HPC and tied to and better care at a lower
the state’s overall economic cost for all the people of the
growth. Commonwealth.
13Massachusetts spending growth has been below the U.S. since 2010, but the gap nearly closed in 2018 and 2019. Massachusetts and national annual per-capita total health care spending growth, 2000 to 2019 Notes: U.S. data includes Massachusetts. Massachusetts 2018-2019 spending growth estimate is preliminary. Sources: Centers for Medicare and Medicaid Services, National Healthcare Expenditure Accounts Personal Health Care Expenditures Data, 2014-2019 and State Healthcare Expenditure Accounts, 1999-2014; Center for Health Information and Analysis, Total Health Care Expenditures, 2014-2019 14
The Health Care Cost
Growth Benchmark
                                        Setting a statewide benchmark is effective as a collective call to action to
                                        address the unsustainable growth of health care costs, which threaten the
                                        financial well-being of our residents, the competitiveness of the state’s
                                        economy, and efforts to reduce health care disparities.

                                        The benchmark is a prospective target for controlling the growth of total
                                        health care expenditures across all payers (public and private) tied to the
                                        state’s long-term economic growth rate.

                                        The health care cost growth benchmark is not a cap on spending or provider
The benchmark is not a bright line
                                        price increases, but rather a measurable goal for moderating excessive health
limit applied indiscriminately to all
payers, providers, spending             care spending growth and advancing health care affordability and equity.
categories, or insurance sectors.
                                        To promote accountability for meeting the state’s benchmark target, the HPC
                                        can require health care providers and health plans to implement Performance
                                        Improvement Plans (PIP) and submit to public
                                        monitoring.
                                                                                                                        15
PIPs Accountability Structure
The HPC may require any entity referred to it by CHIA to complete a Performance Improvement Plan (PIP) if,
after a review of regulatory factors, it identifies significant concerns about the Entity’s costs and determines
that a PIP could result in meaningful, cost-saving reforms.
The HPC interprets the inclusion of these factors in its review process as a directive to consider contextualizing
factors for the payers, providers, and communities where growth is occurring. Factors include evaluating
spending and pricing trends over time, payer mix, the entity’s market position, and cost drivers outside of the
entity’s control, among other factors.
The consideration of these factors in enforcement of the benchmark promotes accountability, while recognizing
that spending growth may be more concerning in some cases (e.g., at already high-priced, high-spend
providers), and in others may represent appropriate growth that improves access and outcomes.
16Performance Improvement Plans: Factors Reviewed by the Commission
How the HPC Contextualizes Spending Performance: Examples
Regulatory Factor: Pricing patterns and trends over time
• Low baseline prices
• High baseline prices
• Price increases that mitigate provider price
• Price increases that exacerbate provider price
variation
variation
• Corrections to underpriced services or provider
• High spending growth over multiple years
types
Less likely to PIP
More likely to PIP
Regulatory Factor: Population(s) served, payer mix, product lines, and services provided
• Spending growth concentrated in higher-
• Growth in lower income communities that may
income communities
correct patterns of historical underutilization
• Payer mix disproportionately commercial
• Payer mix disproportionately public
• Growth due to changes in service mix or
• Growth due to increased spending on primary care
provider mix that increase costs without
or behavioral health
improving value
Regulatory Factor: Factors leading to increased costs that are outside the Entity’s control
• Mandated coverage of new high-cost drugs
• No indication that factors outside of the
• Documented changes in patient health
entity’s control drove spending
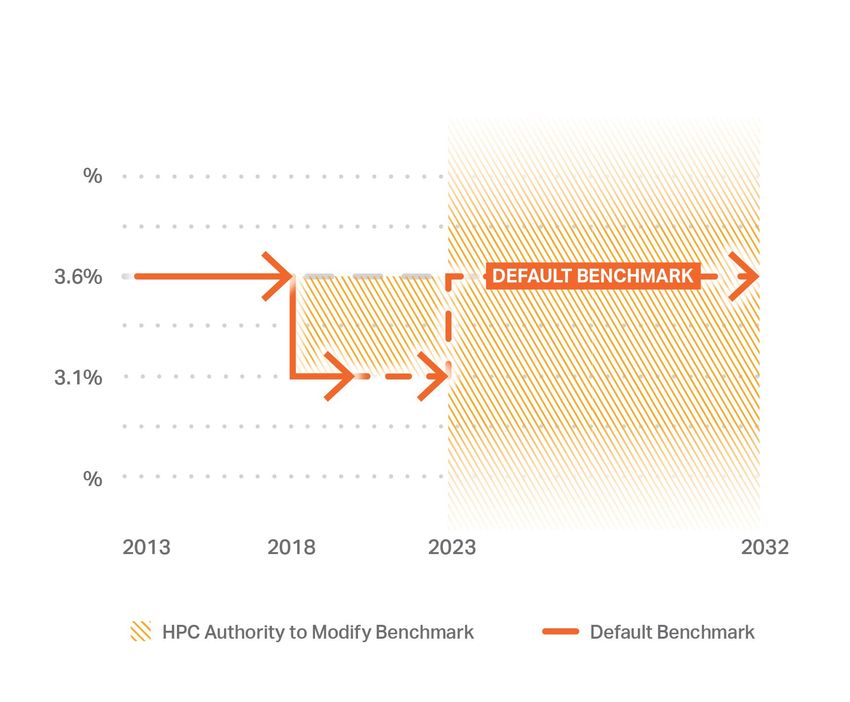
• Emergency responseThe HPC’s authority to modify the benchmark is prescribed by law and subject to
potential legislative review.
YEARS
The benchmark is established by law at the
state’s long-term potential economic growth
rate of Massachusetts (PGSP), as determined
annually by the Legislature and the Governor.
The benchmark is established by law at a
default rate of at PGSP minus 0.5% (3.1%); The
HPC had the authority to modify the benchmark
up to 3.6% by a 2/3rd vote of the Board, subject
to legislative review. The HPC elected not to
modify the benchmark during this time period.
The benchmark is established by law at a
default rate of PGSP (3.6%); HPC can modify to
any amount, by a 2/3 vote of the Board, subject
to legislative review.
18Benchmark Modification Process: Key Steps
HPC PROCESS TO MODIFY
• Prior to any modification of the benchmark, the HPC’s Board must hold a public hearing on whether modification is warranted.
The hearing must examine recent data on provider and payer costs, prices, and cost trends as well as stakeholder testimony.
• Members of the Joint Committee on Health Care Financing participate in the hearing.
If the HPC’s Board votes to maintain the benchmark at the default rate of 3.6%, the annual process is complete.
If the HPC’s Board votes to modify the benchmark to any other number, the HPC must submit notice of its intent to modify
the benchmark to the Joint Committee for potential further legislative review.
POTENTIAL LEGISLATIVE REVIEW
• Following notice from the HPC of an intent to modify, the Joint Committee may hold a public hearing within 30 days and may
submit findings and recommendations, including any legislative recommendations, to the General Court within 30 days of that
hearing.
19Summary of Public Testimony
ORGANIZATION POSITION
Association for Behavioral Healthcare Not specified
Atrius Health 3.6% (or higher)
Blue Cross Blue Shield of MA 3.1%
Conference of Boston Teaching Hospitals Suspend benchmark
Health Care For All 3.1% (or lower)
Lawrence General Hospital Not specified
Massachusetts Association of Health Plans 3.6% (or lower)
Massachusetts Health and Hospital Association Suspend benchmark
Massachusetts Medical Society Not specified
National Federation of Independent Business Not specified
Retailers Association of Massachusetts 3.1%
All written testimony is available on the HPC’s website: https://www.mass.gov/service-details/testimony-hearing-to-determine-the-2023-health-care-cost-growth-benchmark 20The health care cost growth benchmark is set prospectively for the upcoming
calendar year, while actual performance is measured retrospectively.
Set in Set in Set in WE
2019 2020 2021 ARE
HERE
2017 2018 2019 2020 2021 2022 2023 2024
BENCHMARK
3.6% 3.1% 3.1% 3.1% 3.1% 3.1% To be set by
April 15, 2022
To be set by
April 15, 2023
PERFORMANCE
AGAINST THE
BENCHMARK
2.8% 3.6% 4.1% -2.4% TBD TBD TBD TBD
Ongoing COVID-19 pandemic
21The HPC’s
2021 Policy As the Commonwealth approaches the ten-year anniversary of its
Recommendations benchmark-anchored cost containment effort, the HPC
recommends the Commonwealth take immediate action to
strengthen and enhance the state’s strategy for addressing the
intersecting challenges of cost containment, affordability, and
health equity to improve outcomes and lower costs for all. In
addition to implementing the following items, this includes
sustaining the successful innovations made during the COVID-19
pandemic, such as expanded access to telehealth, workforce
flexibilities, and new care models.
AREAS OF FOCUS
1 2 3 4 5
Strengthen Constrain Make Health Advance Implement
Accountability Excessive Plans Health Targeted
for Excessive Provider Accountable for Equity for All Strategies and
Spending Prices Affordability Policies
22Recommendation #1: Strengthen Accountability for Excessive Spending
The Legislature should take action to improve the annual
performance improvement plan (PIP) process by allowing the
Center for Health Information and Analysis (CHIA) to use metrics
other than health status adjusted total medical expense growth to
identify entities contributing to concerning spending...The PIPs
process can be further strengthened by increasing financial
penalties for above-benchmark spending or non-compliance.
23
Massachusetts Health Policy Commission. 2021 Cost Trends Report: https://www.mass.gov/doc/2021-health-care-cost-trends-report/downloadRecommendation #1: Strengthen Accountability for Excessive Spending
The recommended legislative changes would enhance accountability and market functioning in multiple ways:
CHIA could include a broader range of provider types in the PIPs referral process, beyond those for which
total medical expenses can be calculated (i.e., primary care groups).
Use Metrics Referral could be decoupled from changes in payer and provider risk scores, which are influenced by
Other than HSA medical coding efforts.
TME
CHIA could base its referrals on a wider range of metrics that capture differences in baseline size,
spending, or price, and could potentially have a higher bar for referrals for smaller, lower-priced, or lower-
spend entities.
Financial penalties may be a stronger deterrent effect than a PIP alone, as other states have recognized.
For example, Oregon has recommended that “payers and providers who exceed its cost growth target with
statistical certainty and without a reasonable basis across multiple years be subject to a meaningful
Increase financial penalty…the amount of the financial penalty would vary based on how much a payer or provider
Financial has exceeded the cost growth target.”
Penalties
Any funds collected from these penalties could be used to improve health care quality, access, and
affordability, including potentially to support providers that care for a larger share of publicly insured
patients or to support populations adversely impacted by high costs.
24
Massachusetts Health Policy Commission. 2021 Cost Trends Report: https://www.mass.gov/doc/2021-health-care-cost-trends-report/downloadRecommendation #2: Constrain Excessive Provider Prices
The Legislature should take action to cap prices for the highest-priced providers (i.e.,
limiting the highest, service-specific commercial prices with the greatest impact on
spending) and limit price growth (e.g., limiting annual service-, insurer-, and provider-
specific price growth). Such price caps, targeted specifically at the highest-priced
providers in Massachusetts, would be an important complement to the health care cost
growth benchmark, which is [currently] not designed to directly address prices. Such
caps would reduce unwarranted price variation and promote equity by ensuring that
future price increases can accrue appropriately to lower-priced providers, including
many community hospitals and other providers that care for populations facing the
greatest health inequities, ensuring the viability of these critical resources.
25
Massachusetts Health Policy Commission. 2021 Cost Trends Report: https://www.mass.gov/doc/2021-health-care-cost-trends-report/downloadRecommendation #2: Constrain Excessive Provider Prices
Examples of policy options to constrain excessive provider prices include:
Price in the PIPs • Reforming the PIPs process as previously described would allow the HPC to address price levels and price growth,
Process the primary driver of spending growth in Massachusetts.
Price Growth • Delaware’s Department of Insurance set a target for commercial payer aggregate unit price growth for non-
Caps professional services (inpatient, outpatient, and other medical services). Progress on achieving the target will
inform, but not determine, their rate review decisions.
• Rhode Island requires that insurers limit annual hospital inpatient and outpatient price growth.
Montana Level • Cap on state employee health plan payments for inpatient and outpatient hospital services (average price of all
Caps services at hospital): Payments limited to 234% of Medicare rates.
• State was able to secure all major hospitals in network, due partly to public pressure from workers and unions.
Hamilton • Set rate caps to limit prices for health care services at the very top of the commercial price distribution (5x the
Project Caps 20th percentile of the market’s truncated commercial price distribution).
• Annual price growth caps specific to each insurer-provider-service combination to reduce price growth and variation.
Delaware-Health-Care-Affordability-Standards-Report-Final-03042021.pdf; States’ Role in Combatting High Health Care Prices | Commonwealth Fund; Chernew, Dafny, Pany. The Hamilton Project proposal: Chernew ME, Dafny LS, Pany MJ. “A Proposal
to Cap Provider Prices and Price Growth in the Commercial Health Care Market.” The Hamilton Project, March 202. Available at: https://www.hamiltonproject.org/assets/files/CDP_PP_WEB_FINAL.pdf; REPORT TO THE MASSACHUSETTS LEGISLATURE: OUT-
OF-NETWORK RATE RECOMMENDATIONS. September 2021. https://www.mass.gov/doc/report-to-the-massachusetts-legislature-out-of-network-rate-recommendations/download
26Other Complementary Recommendations
#3. MAKE HEALTH PLANS ACCOUNTABLE FOR #5.C.i. FOCUS INVESTMENT IN PRIMARY CARE AND
AFFORDABILITY BEHAVIORAL HEALTH CARE
As both health insurance premiums and consumer cost- Payers and providers should increase spending devoted to
sharing growth continued to outpace increases in total claims primary care and behavioral health while adhering to the
spending, wage growth, and inflation between 2017 and Commonwealth’s total health care cost growth benchmark.
2019, the Commonwealth should require greater These spending increases should prioritize non-claims-based
accountability of health plans for delivering value for spending such as capitation, infrastructure, and workforce
consumers and ensure that any savings that accrue to health investments. CHIA and the HPC should continue to track and
plans are passed along to consumers. report on primary care and behavioral health care spending
trends annually and hold entities accountable for meeting
This recommendation would improve affordability by: improvement targets if they fall short of established targets.
Requiring that the DOI Rate Review process assess
payer rate filings against statewide affordability This recommendation would improve health equity by:
standards Actively encouraging spending growth in high value
Allowing DOI to reject proposed increases that do not service lines; and
meet the standards; and Transforming health care spending by requiring
Increasing transparency into DOI’s process. significant investments in primary care and behavioral
health in the context of a statewide spending growth
target.
Massachusetts Health Policy Commission. 2021 Cost Trends Report: https://www.mass.gov/doc/2021-health-care-cost-trends-report/download 27Summary
Taken together these recommendations will advance the state’s cost
containment efforts by:
Focusing accountability on the entities most responsible for unwarranted
spending growth;
Addressing unwarranted price variation and promoting equity;
Helping to ensure the viability of lower priced providers and other providers
that care for populations facing the greatest health inequities;
Advancing affordability by ensuring that health plans pass along savings to
consumers in the form of lower premiums, deductibles, and co-pays; and
Shifting health care resources over time to invest in high-value services, such
as primary care and behavioral health care.
28VOTE
2023 Health Care
Cost Growth
Benchmark
MOTION
That, pursuant to G.L. c. 6D, § 9, the Commission hereby
establishes the health care cost benchmark for calendar year
2023 as _____, subject to the further process set forth in G.L. c.
6D, § 9 (e).
29Agenda
Call to Order
Approval of Minutes (VOTE)
Recognition of Black Maternal Health Week
Market Oversight and Transparency
• Mass General Brigham Performance Improvement Plan: Request for Extension (VOTE)
• 2023 Health Care Cost Growth Benchmark (VOTE)
• RECENT MARKET CHANGES
• Research Presentation: Trends in Emergency Department Use Among Massachusetts Residents
Care Delivery Transformation
Executive Director’s Report
Schedule of Upcoming Meetings
30Types of Transactions Noticed
TYPE OF TRANSACTION NUMBER FREQUENCY
Formation of a contracting entity 33 24%
Physician group merger, acquisition, or network affiliation 29 21%
Clinical affiliation 28 20%
Acute hospital merger, acquisition, or network affiliation 24 17%
Merger, acquisition, or network affiliation of other provider
20 14%
type (e.g., post-acute)
Change in ownership or merger of corporately affiliated
5 4%
entities
Affiliation between a provider and a carrier 1 1%
31Elected Not to
Proceed
A proposed joint venture between BILH Surgery Center Plymouth Hospital
Holdco, a subsidiary of Beth Israel Deaconess Hospital - Plymouth, and
Pilgrim ASC to own and operate a freestanding ASC in Plymouth.
A proposed clinical affiliation between Atrius Health and South Shore
Hospital under which South Shore would be designated as a preferred
hospital provider for Atrius patients.
A proposed transaction between Spire Orthopedic Partners (Spire) and
Sports Medicine North Orthopedic Surgery (SMN), a physician group practice
on the North Shore, under which Spire would acquire certain non-clinical
assets of and provide administrative services for SMN.
A proposed joint venture between NEBSC Hospital Holdings, comprising NE
Baptist and Constitution Surgery Alliance MA, and NEBSC Surgeon Holdings,
comprising orthopedic surgeons on the medical staff at NE Baptist, to own
and operate a freestanding ASC in Dedham.
32Elected Not to
Proceed
A proposed contracting affiliation between South Shore Health Integrated
Delivery Network and Compass Medical, P.C., a professional corporation
providing primary care, urgent care, and specialty care in southeastern
Massachusetts.
RECEIVED SINCE 1/25
A proposed clinical affiliation between Beth Israel Lahey Health (BILH) and
Cape Cod Health Care (CCHC) under which the parties would jointly provide
clinical services and recruit primary care providers in CCHC’s service area
and would enter into a preferred provider relationship.
33Material Change
Notices Currently
Under Review A proposed transaction between Signature Healthcare, South Shore Health System, Sturdy
Memorial Hospital, and Southeast Massachusetts Behavioral Health, a subsidiary of US
HealthVest, to own and operate a new psychiatric hospital in Southeastern
Massachusetts.
RECEIVED SINCE 1/25
A proposed clinical affiliation between Lawrence General Hospital (LGH) and Steward
Healthcare (Steward), under which LGH and Steward would engage in clinical
collaboration, and joint Medicare managed care contracting.
A clinical affiliation between Atrius Health and Emerson Hospital under which Emerson
would be designated a preferred hospital for Atrius patients.
The proposed acquisition of Franciscan Hospital for Children, a Catholic non-profit
specialty hospital that focuses on pediatric chronic care, mental health disorders, and
rehabilitation services by Children’s Hospital Boston. This acquisition is subject to review
under both the HPC’s Material Change Notice and DPH’s DoN review processes.
34Determination of Need (DoN) Application by Children’s Hospital Boston to Expand
Outpatient Services Outside of Boston
On July 14, 2021, The Children’s Medical Center Corporation (Children’s), filed a Determination of Need application for a
capital expenditure for three ambulatory sites outside of Boston, totaling $435 million:
Expansion and renovation of an existing multi-specialty site in Waltham;
Creation of a new multi-specialty site in Needham, to include eight ambulatory surgery operating rooms and one MRI; and
Creation of a new multi-specialty site in Weymouth, to include one MRI.
Children’s states that the expansions would expand access, improve coordination of care, and expand behavioral health
capacity. Children’s also states that its satellite locations receive 20% lower commercial prices than its main campus.
Some key information about the project is unclear from the materials filed to date, including:
The expected volume by service at each of the locations.
Whether facility fees will be charged for certain services at the project locations.
On September 9, 2021, the Department of Public Health notified Children’s that it was requiring an Independent Cost Analysis
(ICA) be conducted. The ICA is currently underway.
A public hearing was conducted on December 9, 2021, and a number of entities have provided comment in support of the
application.
35Tufts Medical Center’s Proposed Closure of Pediatric Inpatient Beds and Plans to
Transition Services to Children’s
Tufts Medical Center (Tufts) has announced plans to close its 41 pediatric inpatient beds and convert them into adult
med/surg and ICU beds as of July 1, 2022.
Tufts Children’s Hospital (formerly Floating Hospital for Children) is part of Tufts Medical Center in Boston and provides a
variety of services to children in the Commonwealth.
In fiscal year 2019, Tufts Medical Center had approximately 2,800 pediatric inpatient discharges.
Tufts has stated it will maintain its 40-bed NICU, pediatric emergency department, outpatient services at its main campuses
and community satellites, and pediatric hospitalist staffing at affiliated community hospitals.
Tufts has stated that it has a letter of intent with Children’s to provide continuity of care to Tufts’ patients, including ensuring
that pediatric inpatient care for Tufts patients will be provided at Children’s.
Tufts has filed a 90-day essential service closure notice with DPH and will need to provide a more complete notice at least 60
days prior to proposed closure, including a plan for continuity of care.
DPH will also conduct a public hearing on the proposed closure in the coming weeks.
Any affiliation between Tufts Medical Center and Children’s Hospital Boston to transition services or staff from Tufts to
Children’s would likely require an MCN filing with the HPC.
36Agenda
Call to Order
Approval of Minutes (VOTE)
Recognition of Black Maternal Health Week
Market Oversight and Transparency
• Mass General Brigham Performance Improvement Plan: Request for Extension (VOTE)
• 2023 Health Care Cost Growth Benchmark (VOTE)
• Recent Market Changes
• RESEARCH PRESENTATION: TRENDS IN EMERGENCY DEPARTMENT USE AMONG
MASSACHUSETTS RESIDENTS
Care Delivery Transformation
Executive Director’s Report
Schedule of Upcoming Meetings
37Background and Data
BACKGROUND
Emergency Department (ED) visits fell sharply in spring 2020, decreasing 55%
between January and April; the number of ED visits from January to
September 2020 was 23% below the total from the same months in 2019.
From April to September 2020, the total number of potentially avoidable ED
visits was 38% lower than in the same months in 2019.
Historically, around 30-40% of ED visits in Massachusetts are potentially
avoidable visits that could more effectively be cared for in another clinical
setting.
DATAData sources:
2019-2020 Case Mix Emergency Department Database (EDD),
Preliminary 2021 and 2022 Case Mix EDD.
– Exclusions: ED sites missing a quarter or more of data: Beth Israel
Deaconess Hospital – Needham and Sturdy Memorial Hospital
All-Payer Claims Database v10.0, 2018-2020
Sources: Health Policy Commission. Impact of COVID-19 on the Massachusetts Health Care System: Interim Report. April 2021. Available at:
38
https://www.mass.gov/doc/impact-of-covid-19-on-the-massachusetts-health-care-system-interim-report/downloadOverall Avoidable Sites of care By December 2021, ED visits were higher than 2020 levels, but still had not returned to 2019 levels. Number of ED visits by month, January 2019 to December 2021 Notes: Excludes two ED sites due to missing data. Sources: HPC analysis of Center for Health Information and Analysis Emergency Department Database, 2019-2020, preliminary 2021 and 2022q1 39
Overall   Avoidable         Sites of care

By 2021, ED visits remained 12% below 2019 levels. The reduction was largest for
children (23%) and smallest for adults aged 65+ (5%).
Number of ED visits by age group and percent change from the March to September 2019 time period, March 2019 to September 2021

1,400,000

1,200,000
                                                  -12%

1,000,000

                                       -34%
  800,000
                                                                                                                                            -11%

  600,000                                                                                                                          -28%

  400,000

                                                                                                                                                                         -5%
  200,000                                                                                           -23%                                                      -29%
                                                                                         -58%

           -
                                     All ages                                           0 - 17                                    18 - 64                     65 +
                                                                                               2019        2020       2021

 Notes: Includes ED visits between March 16th and September 15th of each year. Excludes two ED sites due to missing data.
 Sources: HPC analysis of Center for Health Information and Analysis Emergency Department Database, 2019-2020, preliminary 2021                                                         40
Identification and Classification of ED Visits into 5 Categories
Non-BH and non-
All ED visits Billings’ algorithm
COVID visits
Concussion,
Major depressive Injury visits laceration
BH visits disorder, suicidal
ideation
Non-emergent visits
Potentially Influenza, low
back pain
COVID visits Emergent, primary care avoidable visits
treatable visits
Emergent, ED care needed,
preventable or avoidable visits
Emergent, ED care needed, not
preventable or avoidable visits
Alcohol or substance-related “All other” visits Chest pain,
visits abdominal pain
Altered mental status-related visits
Visits unclassified by algorithm
Notes: BH visits were defined using AHRQ CCSR MBD001-MDB034. Injury and avoidable ED visits are based on the Billings algorithm, which classifies an ED visit into multiple categories. "Avoidable" is defined here as ED
visits that were emergent - primary care treatable or non-emergent. All other are the total sum of ED visits minus avoidable ED, BH visits, COVID-19, and injury visits. 41Overall Avoidable Sites of care
All categories of ED visits declined from 2019 to 2021, with the largest declines for
potentially avoidable and injury visits (17%).
Number of ED visits by visit category and percent change relative to same period in 2019
600,000
500,000
-17%
400,000
-6%
300,000 -39%
-32%
-17%
200,000 -36%
100,000 -13%
-22%
-
COVID BH Injury Potentially avoidable All other
2019 2020 2021
Notes: Includes ED visits between March 16th and September 15th of each year. Excludes two ED sites due to missing data. BH visits were defined using AHRQ CCSR MBD001-MDB034. Injury and avoidable ED visits are
based on the Billings algorithm, which classifies an ED visit into multiple categories. "Avoidable" is defined here as ED visits that were emergent - primary care treatable or non-emergent. All other are the total sum of ED
visits minus avoidable ED, BH, COVID, and injury visits. COVID visits are defined as ED visits with a primary or secondary U071 (“COVID-19”) diagnosis code.
Sources: HPC analysis of Center for Health Information and Analysis Emergency Department Database, 2019-2020, preliminary 2021 42Ages 0-17 Ages 18-64 Ages 65+ Overall Avoidable Sites of care
Potentially avoidable ED visits among children dropped by two-thirds (60,000 visits)
in 2020 and were still one-third below 2019 levels by 2021.
Number of potentially avoidable ED visits by age group and percent change relative to same period in 2019
AGE GROUP 2019 2020 2021
0-17 89,016 29,608 (-67%) 61,215 (-31%)
18-64 313,733 211,778 (-32%) 265,094 (-16%)
65+ 76,640 51,454 (-33%) 71,037 (-7%)
Notes: Includes ED visits between March 16th and September 15th of each year. Excludes two ED sites due to missing data. Avoidable ED visits are based on the Billings algorithm, which classifies an ED visit into multiple
categories. "Avoidable" is defined here as ED visits that were emergent - primary care treatable or non-emergent.
Sources: HPC analysis of Center for Health Information and Analysis Emergency Department Database, 2019-2020, preliminary 2021 43Ages 0-17 Ages 18-64 Ages 65+ Overall Avoidable Sites of care
Among children, the decline was greatest for avoidable ED visits; behavioral health
ED visits declined the least between 2019 and 2021.
Number of ED visits for children aged 0-17 by visit category and percent change relative to same period in 2019
100,000
80,000
-31%
60,000
-21%
-17%
40,000
-46%
-67%
-60%
20,000
-13%
-41%
-
COVID BH Injury Potentially avoidable All other
2019 2020 2021
Notes: Includes ED visits between March 16th and September 15th of each year. Excludes two ED sites due to missing data. BH visits were defined using AHRQ CCSR MBD001-MDB034. Injury and avoidable ED visits are
based on the Billings algorithm, which classifies an ED visit into multiple categories. "Avoidable" is defined here as ED visits that were emergent - primary care treatable or non-emergent. All other are the total sum of ED
visits minus avoidable ED, BH, COVID, and injury visits. COVID visits are defined as ED visits with a primary or secondary U071 (“COVID-19”) diagnosis code.
Sources: HPC analysis of Center for Health Information and Analysis Emergency Department Database, 2019-2020, preliminary 2021 44Ages 0-17 Ages 18-64 Ages 65+ Overall Avoidable Sites of care
For adults aged 18-64, potentially avoidable and injury ED visits declined the most
(17% and 16%) between 2019 and 2021.
Number of ED visits for adults aged 18-64 by visit category and percent change relative to same period in 2019
350,000
300,000
-16%
250,000
-6%
-32%
200,000
-27%
150,000 -17%
-33%
100,000
-20% -14%
50,000
-
COVID BH Injury Potentially avoidable All other
2019 2020 2021
Notes: Includes ED visits between March 16th and September 15th of each year. Excludes two ED sites due to missing data. BH visits were defined using AHRQ CCSR MBD001-MDB034. Injury and avoidable ED visits are
based on the Billings algorithm, which classifies an ED visit into multiple categories. "Avoidable" is defined here as ED visits that were emergent - primary care treatable or non-emergent. All other are the total sum of ED
visits minus avoidable ED, BH, COVID, and injury visits. COVID visits are defined as ED visits with a primary or secondary U071 (“COVID-19”) diagnosis code.
Sources: HPC analysis of Center for Health Information and Analysis Emergency Department Database, 2019-2020, preliminary 2021 45Ages 0-17 Ages 18-64 Ages 65+ Overall Avoidable Sites of care
For adults aged 65+, 2021 ED visits approached 2019 levels for all categories.
Number of ED visits for adults aged 65+ by visit category and percent change relative to same period in 2019
100,000
80,000
-7% 0%
60,000
-33% -27%
-10%
40,000
-31%
20,000
-23% -7%
-
COVID BH Injury Potentially avoidable All other
2019 2020 2021
Notes: Includes ED visits between March 16th and September 15th of each year. Excludes two ED sites due to missing data. BH visits were defined using AHRQ CCSR MBD001-MDB034. Injury and avoidable ED visits are
based on the Billings algorithm, which classifies an ED visit into multiple categories. "Avoidable" is defined here as ED visits that were emergent - primary care treatable or non-emergent. All other are the total sum of ED
visits minus avoidable ED, BH, COVID, and injury visits. COVID visits are defined as ED visits with a primary or secondary U071 (“COVID-19”) diagnosis code.
Sources: HPC analysis of Center for Health Information and Analysis Emergency Department Database, 2019-2020, preliminary 2021 46Ages 0-17 Ages 18-64 Ages 65+ Overall Avoidable Sites of care
Among high-volume potentially avoidable ED diagnoses for children, visits declined
for infection/illness-related diagnoses such as vomiting and fever.
Number of potentially avoidable ED visits for children aged 0-17 for top primary diagnoses (excluding influenza) between March 2019 and
March 2020 and percent change relative to same period in 2019
10,000
8,000 -8% -22%
6,000
-59%
4,000
-31%
+11%
2,000 -44%
-82%
-77% -72%
-68%
0
Acute upper respiratory Fever, unspecified Vomiting, unspecified Acute pharyngitis, unspecified Cough
infection, unspecified
2019 2020 2021
Notes: Includes ED visits between March 16th and September 15th of each year. Excludes two ED sites due to missing data. Avoidable ED visits are based on the Billings algorithm, which classifies an ED visit into multiple
categories "Avoidable" is defined here as ED visits that had at least a 70% probability of being emergent - primary care treatable or non-emergent. Top five diagnosis codes include: J069 (Acute upper respiratory infection,
unspecified), R509 (Fever, unspecified), R1110 (Vomiting, unspecified), J029 (Acute pharyngitis, unspecified), and R05 (Cough).
Sources: HPC analysis of Center for Health Information and Analysis Emergency Department Database, 2019-2020, preliminary 2021 47Ages 0-17 Ages 18-64 Ages 65+ Overall Avoidable Sites of care
Potentially avoidable visits for influenza among children nearly disappeared for the
period of September 2020 to March 2021.
Number of potentially avoidable ED visits for children aged 0-17 for influenza, September 2019 to March 2020 versus September 2020 to
March 2021
14,000
12,872
12,000
10,000
8,000
6,000
4,000
2,000
42
-
9/16/19 to 3/15/20 9/16/20 to 3/15/21
Notes: Influenza includes “Influenza due to other identified influenza virus with other respiratory manifestations” (J101) and “Influenza due to unidentified influenza virus with other respiratory manifestations” (J111).
"Avoidable" is defined here as ED visits that had at least a 70% probability of being emergent - primary care treatable or non-emergent. Excludes two ED sites due to missing data.
Sources: HPC analysis of Center for Health Information and Analysis Emergency Department Database, 2019-2020, preliminary 2021 48Overall Avoidable Sites of care
The percentage of ED visits that were potentially avoidable declined the most for residents
living in the lowest-income areas but remained higher than for other residents.
Percent of ED visits that were potentially avoidable by zip-income quintile, March to September 2019 to 2021
50%
42.4%
40.3%
40% 39.3% 39.3% 39.2%
38.1%
37.4% 36.8% 37.2% 37.5%
35.3% 35.5% 35.3%
33.6% 33.6%
30%
20%
1 (Low) 2 3 4 5 (High)
2019 2020 2021
Notes: Includes ED visits between March 1st and September 30th of each year. Excludes two ED sites due to missing data. Avoidable ED visits are based on the Billings algorithm, which classifies an ED visit into multiple
categories. "Avoidable" is defined here as ED visits that were emergent - primary care treatable or non-emergent. Results are reported according to community income level linked to zip code tabulation area.
Sources: HPC analysis of Center for Health Information and Analysis Emergency Department Database, 2019-2020, preliminary 2021 49Overall Avoidable Sites of care
Between 2018 and 2020, fewer evaluation and management visits occurred in the
office, HOPD, and ED settings while more occurred in urgent cares and via telehealth.
Number of evaluation and management (E&M) visits per 1,000 member months by site type and year for commercially-insured patients,
2018 to 2020
250
205 200
200
150
128
100
62
50 42 41
25
15 18 19 16 15 12
0 0
0
Office HOPD Urgent care Telehealth ED
2018 2019 2020
Notes: Population includes commercially-insured individuals with full coverage. Behavioral health, therapy, and counseling-related evaluation and management visits were excluded. Evaluation and management codes
include: 99201-99205, 99211-99215, 99281-99285 (ED visits).
Sources: HPC analysis of Center for Health Information and Analysis All-Payer Claims Database v10.0, 2018-2020 50Ages 0-17 Overall Avoidable Sites of care
By the end of 2020, the number of evaluation and management visits for children were still
down by 30%, but a smaller proportion of these visits took place in offices and emergency
departments.
Number of evaluation and management (E&M) visits among children aged 0-17 per 1,000 member months by site type for commercially-
insured patients, October 2019 to December 2020
300
14
250 7
14 19
0
17 14
14
200
8
150 10
42
40
6 17
100 202 211 12 7
8
63
50 4 89 100
3
39
0
Oct-Dec 2019 Jan-Mar 2020 Apr-Jun 2020 Jul-Sept 2020 Oct-Dec 2020
Office HOPD Urgent care Telehealth ED
Notes: Population includes commercially-insured individuals with full coverage. Behavioral health, therapy, and counseling-related evaluation and management visits were excluded. Notes: Population includes
commercially-insured individuals with full coverage. Behavioral health, therapy, and counseling-related evaluation and management visits were excluded. Evaluation and management codes include: 99201-99205, 99211-
99215, 99281-99285 (ED visits).
Sources: HPC analysis of Center for Health Information and Analysis All-Payer Claims Database v10.0, 2018-2020 51Ages 0-17 Ages 18-64 Overall Avoidable Sites of care
The proportion of all visits for common pediatric conditions taking place at urgent care
centers increased slightly in 2020 while remaining similar or declining in the ED, suggesting
possible care shifting away from the ED.
Share of visits at urgent care centers vs the ED for five common primary diagnoses among children aged 0-17, 2019-2020
18%
15.5%
16% 15.0%
14%
12%
9.8% 9.8%
10% 9.3%
8.9%
8.1% 8.4%
8% 7.1%
6.6%
6.1% 5.7%
6%
4.6% 4.8%
4%
2.3% 1.9% 1.9%
1.9%
2% 0.8% 0.8%
0%
Acute pharyngitis, unspecified Acute upper respiratory Cough Fever, unspecified Streptococcal pharyngitis
infection, unspecified
Urgent Care 2019 Urgent Care 2020 ED 2019 ED 2020
Notes: Five diagnosis codes were: J029 (Acute pharyngitis, unspecified), J069 (Acute upper respiratory infection, unspecified), R05 (Cough), R509 (Fever, unspecified), and J020 (Streptococcal pharyngitis). These
diagnoses were among the top non-COVID related conditions for children aged 0-17 with significant presence at both urgent care centers and EDs. The following care types were included in the total number of visits for
each diagnosis: urgent care centers, EDs, offices, and retail clinics.
Sources: HPC analysis of Center for Health Information and Analysis All-Payer Claims Database v10.0, 2019-2020 52While 7 emergency department sites closed from 2019-2021, the Commonwealth saw
a net growth of 13 new urgent care centers open during the same time period.
Changes in Emergency Department and Urgent Care Center Sites, 2019-2021
Between 2019 and 2021:
7 emergency departments closed.
Collectively, these had accounted for
3.5% of ED visits in 2018.
30 new urgent care centers opened,
while 17 closed.
The next issue of the HPC DataPoints series will
feature more detail on changes in urgent care
centers in Massachusetts.
Notes: In 2019, EDs at Melrose Wakefield Hospital Lawrence Memorial Campus and North Shore Medical Center Union Campus closed. In 2020, EDs at Steward Norwood Hospital, MetroWest Medical Center - Leonard
Morse Campus, Cambridge Health Alliance - Somerville Campus, and Steward Satellite Emergency Facility – Quincy closed. In 2021, the Satellite Emergency Facility at Baystate Mary Lane Outpatient Center closed. 53Conclusions
Overall, the number of ED visits in 2021 increased from 2020 levels but
remained below pre-pandemic 2019 levels.
There were declines in all types of ED visits between 2019 and 2021, with the
largest declines in potentially avoidable ED visits and the smallest declines in
BH-related ED visits.
Declines in ED visits, especially potentially avoidable ED visits, were largest for
children.
There is some evidence of small shifts in care to other settings, including
urgent care and telehealth. Other mechanisms leading to the decline in ED
visits include changes in care seeking behavior (postponing or not seeking
care in the formal health care system) and reduced transmission of non-
COVID-19 communicable diseases.
54Agenda
Call to Order
Approval of Minutes (VOTE)
Recognition of Black Maternal Health Week
Market Oversight and Transparency
Care Delivery Transformation
• ACCOUNTABLE CARE ORGANIZATION (ACO) CERTIFICATION
Executive Director’s Report
Schedule of Upcoming Meetings
55ACO LEAP 2022-2023
Certifications Atrius Health, Inc.
Baycare Health Partners, Inc.
Beth Israel Lahey Performance Network
BMC Health System, Inc.
Cambridge Health Alliance
Children’s Medical Center Corporation
Community Care Cooperative, Inc.
Mass General Brigham
Reliant Medical Group, Inc.
Signature Healthcare
Southcoast Health System, Inc.
Steward Health Care Network, Inc.
Trinity Health of New England
Wellforce, Inc.
56ACO Certification
Elements
PATIENT-CENTEREDNESS
The Certified ACOs are most commonly using periodic patient experience
surveys to understand their patients’ experiences and preferences, and to
design and iterate on patient experience improvements.
This information has been used to guide ACO-wide strategic plans, design
staff training opportunities, and to make refinements to telehealth or digital
care experiences, particularly those first implemented in response to the
pandemic.
CULTURE OF PERFORMANCE IMPROVEMENT
Many Certified ACOs identified leadership engagement in tracking and
reviewing performance and/or periodically convening clinical and/or
business leaders to discuss performance improvement goals and strategies
as key approaches to ensuring a culture of performance improvement.
Several highlighted that they offer financial incentives to hold providers
accountable for performance goals.ACO Certification
Elements
DATA-DRIVEN DECISION-MAKING
Certified ACOs are using multiple approaches to help clinicians make the
best possible clinical decisions, with most developing and/or disseminating
evidence-based protocols to ACO providers or making available structured
learning opportunities. Many have also developed or encouraged use of
clinical decision support tools, in some cases in conjunction with evidence-
based protocols disseminated by the ACO.
POPULATION HEALTH MANAGEMENT PROGRAMS
Certified ACOs highlighted 64 distinct population health management programs
in operation, including a variety of care management and/or transitions of care
programs.
These programs each have specific metrics and goals targeting improvements in
process, utilization, and/or outcomes measures, with many of the ACOs making
adjustments or programmatic changes to PHM programs in the past two years
based on measured performance.ACO Certification
Elements
WHOLE-PERSON CARE
Certified ACOs are advancing behavioral health integration, offering a range
of financial, technical, and operational supports to facilitate steps like co-
location, information-sharing across settings, and supporting e-consults
and virtual linkages between primary care and behavioral health providers.
All of the Certified ACOs have implemented screenings and referral
processes for health-related social needs, in some cases beginning with the
MassHealth population and expanding to commercial and Medicare
populations in stages.
HEALTH EQUITY
Activity in this area is in early development for most ACOs. Many of the
initiatives described focused on closing gaps in quality outcomes,
expanding access to services, or modifying current population health
interventions to better target health inequities. Several examples
highlighted by ACOs focused on initiatives directly related to COVID-19.Highlights of the 14 Recertified ACOs
2.8 MILLION COVERED LIVES ACROSS TOP STRATEGIES FOR CONTROLLING
95 RISK CONTRACTS TME GROWTH
93% of covered lives are in contracts with • Complex care management programs
downside risk, a slight uptick from 2019; 8 of • Reductions in avoidable inpatient or PAC
14 ACOs have at least one PPO risk contract • Investments in primary care and/or
behavioral health capacity
MOST COMMON STEPS TO PROMOTE TOP CHALLENGES TO CONTROLLING
EQUITY TME GROWTH
Provider or staff training, provider or staff • Price growth for drugs, medical supplies, etc.
recruitment, quality improvement strategies, • Difficulty translating risk contract incentives
and telehealth access expansions into incentives for clinicians
• Prices of providers outside of the ACO
60
COMMON TELEHEALTH SUPPORTS TOP DIGITAL HEALTH STRATEGIES
Interpreter services, a common technology Patient portals, virtual visits, remote patient
platform, and provider technical assistance monitoring, and e-consults (PCP-Specialist)Agenda
Call to Order
Approval of Minutes (VOTE)
Recognition of Black Maternal Health Week
Market Oversight and Transparency
Care Delivery Transformation
EXECUTIVE DIRECTOR’S REPORT
Schedule of Upcoming Meetings
61Recent and Upcoming Publications
RECENTLY RELEASED UPCOMING
Investment Program Profiles: Moving Massachusetts Upstream Innovation Spotlight: Medical Legal Partnerships
“MassUP” (March 2022) DataPoints Issue #23: Growth in Alternative Care
DataPoints Issue #22: Growth in Out-of-Pocket Spending for Sites Over Time in Massachusetts
Pregnancy, Delivery, and Postpartum Care in Massachusetts HPC Shorts: Growth in Out-of-Pocket Spending for
(March 2022) Pregnancy, Delivery, and Postpartum Care in
Annual Report: Office of Patient Protection (March 2022) Massachusetts
Report to the Legislature: Children with Medical Complexity in Video: SHIFT Opioid Use Disorder Initiative Spotlight
the Commonwealth (February 2022) - Harrington Hospital
DataPoints Issue #21: Quality Measure Alignment Taskforce’s Report to the Legislature: Impact of COVID-19 on
Evaluation of Payer Adherence to the Massachusetts Aligned the Health Care Workforce
Measure Set (February 2022) Evaluation Report: SHIFT-Care Challenge
HPC Public Comment: MGB Determination of Need (January Impact Brief: SHIFT Opioid Use Disorder Cohort
2022)
62Background on Contract Extension Request
The HPC has ongoing hourly rate contracts with several professional service firms to support its market oversight and other
activities, including with experts in economics, actuarial science, accounting, care delivery improvement, quality measurement,
and payer-provider contracting.
Understanding the unpredictability and need for flexibility in market oversight activities, the HPC’s by-laws allow the Executive
Director to enter into contracts up to $500,000. Board approval is required again for contracts valued at more than $500,000.
As the end of the state fiscal year (FY22) approaches, the Executive Director anticipates exceeding $500,000 for one contract
and is seeking the Board’s authorization to expend beyond this amount.
The contract is for the primary team of expert economic consultants assisting with the economic modeling for the HPC’s
market oversight projects this year. This contractor’s work in the current fiscal year has included conducting analyses relating
to an unprecedented number of MCN reviews, the MGB DoN applications, the anticipated changes to the pediatric provider
market, and analytic assistance on multiple other projects. Much of this work is ongoing.
The additional funding request is fully accounted for within the current Board-approved budget for FY22 and is not net new
spending. The additional funds for this contractor will be shifted from funds previously allocated for other contractors.
63VOTE
Professional Services
Contract Extension
MOTION
That, pursuant to Section 6.2 of the Health Policy Commission’s By-
Laws and vote of the Commission on October 16, 2013, the
Commission hereby authorizes the Executive Director to increase the
maximum allowable contract amount for Bates White by $250,000
through June 30, 2022, for economic expertise in support of the
Commission’s ongoing measuring and monitoring of provider
relationships and market changes, subject to further agreement on
terms deemed advisable by the Executive Director.
64Agenda
Call to Order
Approval of Minutes (VOTE)
Recognition of Black Maternal Health Week
Market Oversight and Transparency
Care Delivery Transformation
Executive Director’s Report
SCHEDULE OF UPCOMING MEETINGS
652022 Public Meeting Calendar
BOARD MEETINGS
Tuesday, January 25
Wednesday, March 16 – Benchmark Hearing
Wednesday, April 13
Wednesday, June 8
Wednesday, July 13
Wednesday, September 14
Wednesday, December 14
COMMITTEE MEETINGS
Wednesday, February 9
Wednesday, May 11
Wednesday, October 12
ADVISORY COUNCIL
Wednesday, March 30
Wednesday, June 22
Wednesday, September 21
Wednesday, December 7
COST TRENDS HEARING
Wednesday, November 2
All meetings will be held virtually unless otherwise noted. This schedule is subject to change, and additional meetings and hearings may be added. 66Schedule of Upcoming Meetings
BOARD COMMITTEE ADVISORY COUNCIL SPECIAL EVENTS
June 8 May 11 June 22 November 2
Cost Trends Hearing
July 13 October 12 September 21
September 14 December 7
December 14
Mass.gov/HPC HPC-info@mass.gov @Mass_HPC tinyurl.com/hpc-linkedin
67You can also read