Image Aesthetics and its Effects on Product Clicks in E-Commerce Search
←
→
Page content transcription
If your browser does not render page correctly, please read the page content below
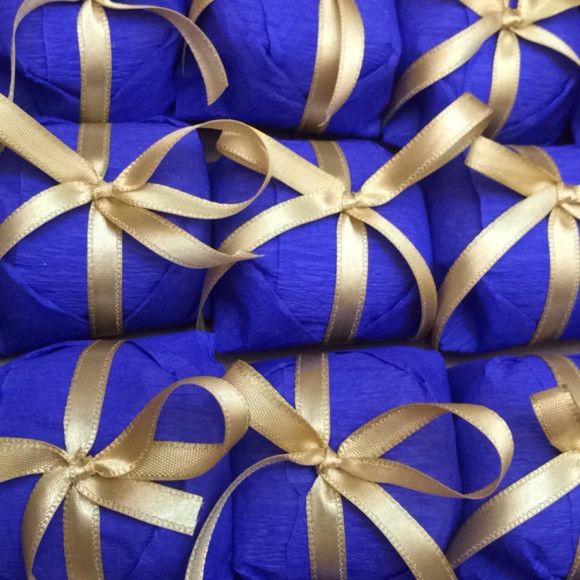
Image Aesthetics and its Effects on Product Clicks in
                               E-Commerce Search
                                  Alexandre Maros, Fabiano Belém, Rodrigo Silva, Sérgio Canuto
                                            Jussara M. Almeida, Marcos A. Gonçalves
                                     Universidade Federal de Minas Gerais - Computer Science Department
                                 {alexandremaros,fmuniz,rmsilva,sergiodaniel,jussara,mgoncalv}@dcc.ufmg.br

ABSTRACT                                                                              even though this is commonly overlooked or taken for granted,
Product search engines are a key factor for online business. Re-                      the product’s image, alongside with its title, description and tags,
trieving relevant products in an E-Commerce (EC) website is of                        may be deciding factors between buying the product or not. The
the utmost importance, as a single EC website can have millions of                    quality of the product must be clearly conveyed through these
products with very similar features. One aspect that is not widely                    features in order to convince the customer to buy the product
studied in this scenario is the effect that the image of the product                  [2, 10]. In such context, it is known in other domains that certain
(notably aesthetic properties) shown to the customer has on the                       image characteristics (e.g., brightness, colorfulness) are related to
customer’s interest. Previous studies have been able to link certain                  one’s innate interest [5]. However, this issue has not been fully
characteristics of images to our innate interest. For instance, it is                 investigated in the context of EC search. Thus, we here investigate
known that bright images with several colors are more likely to                       the hypothesis that aesthetics properties of the product’s image shown
attract one’s attention than dark ones. However, these issues have                    to the customers of EC websites does influence the product clicks in
been understudied in the EC context. In this context, we conduct                      searches, and possibly the amount of purchases, since clicking and
experiments on real-world EC to analyze the effects that the prod-                    visualizing a product is an important step to guide the user decision
uct’s image aesthetic has on the user interest (expressed in clicks)                  for purchasing the product or not.
in the product. Experimental results show that this relationship                          The challenge of evaluating the aesthetics, beauty, or quality of
exists and that it is more visible in some categories of products.                    an image, music or any artistic work has been studied for quite
                                                                                      some time [1, 6]. The main problem involving this field of study
KEYWORDS                                                                              is that beauty is often considered as personal; what may be pretty
                                                                                      for one person may not be liked by another. With product image
E-Commerce, product images, search, aesthetic properties
                                                                                      classification these factors can vary even more, e.g., the image does
ACM Reference Format:                                                                 not necessarily needs to be pretty, but it must be clearly visible.
Alexandre Maros, Fabiano Belém, Rodrigo Silva, Sérgio Canuto, Jussara                 However, our driving hypothesis is that products that have more
M. Almeida, Marcos A. Gonçalves. 2019. Image Aesthetics and its Effects               attractive images (have better brightness, contrast, saturation) may
on Product Clicks in E-Commerce Search. In Proceedings of the SIGIR
                                                                                      have a higher probability of being clicked when they appear.
2019 Workshop on eCommerce (SIGIR 2019 eCom), 4 pages.
                                                                                          Even though this is a complex and noisy problem to model, there
                                                                                      are few general characteristics of artistic works that determine their
1 INTRODUCTION                                                                        visual quality. For instance, in photography, exposure, rule of thirds,
E-Commerce (EC) platforms have become a popular means to bring                        contrast, and other characteristics are often carefully planned and
greater shopping convenience to costumers around the globe. These                     chosen by the photographer. A few authors, such as [1], define
platforms bring a series of social and technical challenges, which                    beauty as a ratio between harmony and complexity of a work.
have not been extensively studied. Examples of these challenges                           The present study tackles the aforementioned hypothesis by
include problems related to the trust and familiarity that these                      analyzing the relationship between the quality of a product’s image
websites convey to the customers [7] as well as new computational                     and the probability of it being clicked when presented as a result
challenges, specially in the area of information retrieval, such as                   for a search query in a large EC website focused on crafts and
new ways to increase revenue given specific s earches a nd user                       personalized products. Our goal is to verify whether the image
profiles [19].                                                                        features, including features related to aesthetics, can explain, at
   After stumbling upon a product in an EC website, as a result of                    least partially, those clicks. Our experimental results show that
an explicit search or associated with an ad, the user’s decision to                   this relationship does exist, even though it seems to be noisy. The
click on such product (which, in turn, may lead to a purchase) may                    applied methodology could be used to improve the search results
be influenced by the image of the product shown to the user. Thus,                    of EC, presenting more attractive products to the customers or to
                                                                                      guide sellers towards improving the attractiveness of their products.
Copyright © 2019 by the paper’s authors. Copying permitted for private and academic
purposes.                                                                             2   RELATED WORK
In: J. Degenhardt, S. Kallumadi, U. Porwal, A. Trotman (eds.):
Proceedings of the SIGIR 2019 eCom workshop, July 2019, Paris, France, published at   There are several works focused on the definition and evaluation
http://ceur-ws.org                                                                    of the aesthetics of an image. In one of the earliest studies [1],
                                                                                      the aesthetic measure is formalized as the ratio between order
                                                                                      and complexity. In [18], the artistic process is modeled from an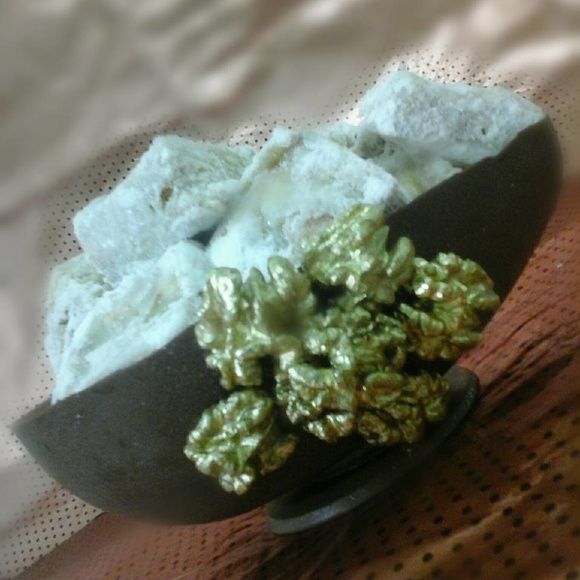
SIGIR 2019 eCom, July 2019, Paris, France                                                                                                      Maros et al.
                                                                                          Table 1: Base Features for the images
Information Theory perspective to allow the quantification of these
properties. In particular, the Shannon Entropy and Kolmogorov                        Feature       Description
Complexity are used to estimate values for the order and complexity                  f1–f4         Sharpness [3, 15]
of some famous paintings.                                                            f5            Exposure
    A more recent work [14] proposes a method to extract features                    f 6, f 7      Contrast and Interval Contrast
                                                                                     f8            Average Intensity (Datta 1)
from images in the Photo.net dataset in order to use machine learn-                  f 9, f 10     Colorfulness Color/Black & White (Datta 2)
ing techniques such as Support Vector Machines (SVMs) to classify                    f 11, f 12    Average Saturation and Hue (Datta 3, 4)
images into aesthetically good or bad categories. Some of these                      f 13 – f 15   Central Hue, Saturation and Intensity (Datta 5–7)
                                                                                     f 16 – f 19   Hue Texture (Datta 10, 11, 12, 19)
features, originally proposed by [5, 11], include characteristics such               f 20 – f 23   Saturation Texture (Datta 13, 14, 15, 20)
as brightness, contrast, saturation, central saturation and image ratio.             f 24 – f 27   Texture Value (Datta 16, 17, 18, 21)
                                                                                     f 28 – f 30   Height, Width and Sum of Height and Width
Other characteristics such as Bags of Visual Words (BOVW) [4],                       f 31, f 32    Composition (Datta 24, 25)
Fisher Vectors (FV) [17] and GIST descriptors [16] have also been                    f 33 – f 47   HSV Segmentation (Datta 26–40)
used to improve learning accuracy. The BOVW and FV algorithms                        f 48 – f 52   Segmentation Sizes (Datta 41–45)
                                                                                     f 53 – f 57   Segmentation Codes (Datta 48–52)
work by clustering Scale-Invariant Feature Transform (SIFT) vec-                     f 58 – f 60   HSV Depth ((Datta 53–55)
tors [12] that capture local properties of an image (e.g., “Does this                f 61          Convexity (Datta 56)
patch contain sharp edges?”, “Is the color of this patch saturated?”).               f 62, f 63    Dominant Hue and Hue Compression
                                                                                     f 64          Ratio of pixels next to dominant Hue
GIST in turn uses histograms to capture information from images.                     f 65          Average distance to dominant Hue
    The use of Convolutional Neural Networks (CNN) is explored in                    f 66          Color Dispersion
[13]. The objective is to build a robust way to automatically extract
features and predict whether an image is considered good or bad.           of the image, including features that capture the exposure, contrast,
The main advantage is that there is no need to propose nor calculate       saturation, ratio, depth, sharpness and composition [3, 5, 15]. Most
predefined features, which can be expensive. However, there are            of these features were successfully exploited in aesthetic classifi-
two main disadvantages: (a) the models must have a fixed-size input,       cation in other domains [14], thus being be a good starting point.
implying the need to scale the images, causing information loss            Table 1 presents these features with a brief description .
(this can be minimized by using random crops of the same image)
and; (b) the ability to interpret and understand the produced model        3.2     GIST
is affected. The CNNs are trained and tested using the AVA dataset1 ,
                                                                           The GIST descriptor is a low-dimensional scene descriptor that
containing over 1.5 million images.
                                                                           captures a set of characteristics, such as naturalness, roughness, ex-
    There are very few works that try to correlate the quality of the
                                                                           pansion and ruggedness. These characteristics are estimated using
image of a product with the product popularity (e.g., click rate).
                                                                           spectral information and coarse localization. The image is parti-
In [8], a study of the impact of the image on user clicks was con-
                                                                           tioned into a 4 × 4 regular grid and a histogram of gradients (with
ducted. The authors used a limited number of image features and a
                                                                           20 bins) is computed for each of the 16 regions and 3 color channels.
stochastic gradient boosting model to predict CTR of the randomly
                                                                           Finally, all histograms are concatenated to form a 960D vector [16].
selected products. The results indicated significant correlation be-
tween the images features and CTR. In [2], the authors find that
the “Perceived Product Quality”, whose definition relies directly on
                                                                           3.3     Bag of Visual Words (BOVW)
information available to the consumer, such as the product images,         BOVW represents an image by a histogram of local features [4].
description, title and reviews directly affects the interest in a prod-    First, an unordered set of local patches are extracted and described
uct. In here, we take a different perspective based on the aesthetics      by SIFT descriptor. A visual vocabulary is learned by clustering
of the image associated with the product and on features that can          these descriptors with K-Means. The local features are then ex-
be automatically extracted from them based on this perspective.            tracted from an image by counting the number of local descriptors
                                                                           assigned to each visual word in a fixed-length histogram. This
3     IMAGE FEATURES                                                       algorithm has been very successful in image classification. [14].
We use use three sets of of automatically extracted features to cap-
ture the aesthetic of the product images. The first one corresponds        4     DATASET
to state-of-the-art aesthetic base features that capture the most fun-     Our evaluation exploits real data from Elo7, the largest Brazilian e-
damental aspects of the image (e.g. exposure and saturation). The          marketplace focused on creative and personalized products2 . In this
second one is the GIST descriptor that captures scene categorization       EC platform, sellers register their own products, uploading pictures
and image layout. The third and last set is the BOVW, a generic            and providing descriptive text data (e.g. title, description, price,
content-based set of features which describe the distribution of           tags). Product searches return a grid of products where the photos
local patches within the image.                                            are prominent and textual data include only the product’s title and
                                                                           price. Since the sellers are responsible for this information, there
3.1     Base Features                                                      is a lot of heterogeneity in terms of quality of the products’ text
The base features consists of 66 attributes extracted from the prod-       features and, specially, their pictures, making it an ideal scenario
uct’s image. These attributes are directly related to the main aspects     for this study. The data contains over four million products in 42

1 https://research.google.com/ava/                                         2 https://www.elo7.com.br
Image Aesthetics and its Effects on Product Clicks in E-Commerce Search                            SIGIR 2019 eCom, July 2019, Paris, France

Figure 1: Examples of images considered good and bad from                Figure 2: Distribution of the feature value from the most and
the Elo7 website                                                         least relevant product per query

(a) Image with a high click score     (b) Image with a low click score
                                                                                  (a) f 5 – Exposure             (b) f 8 – Average Intensity

                                                                         5.1    Feature Distributions
                                                                         To check whether there is a significant difference between prod-
different categories and a hundred thousand unique queries across
                                                                         ucts that are more frequently clicked against their counterparts,
two months (October and September of 2018).
                                                                         we selected two thousand queries that had products with over a
   In this work, departing from our main hypothesis, we associate
                                                                         thousand impressions. For each query, we compare image features
the interest of users in a product with the quality of its image.
                                                                         of the highest and lowest ranked products (most and least “rele-
More formally, given a search query q and a product p, we have the
                                                                         vant” products, respectively). For each feature, we performed the
number of times in which p was retrieved after a customer searched
                                                                         Kolmogorov-Smirnov test to check whether the two distributions
for q (impressions) and how many times it was clicked. The interest
                                                                         (associated with the lowest and highest ranked products according
score of a product with relation to a query is then calculated as the
                                                                         to their click scores) are significantly different. 42 out of the 66
ratio between the number of clicks and impressions times the log
                                            clicks                       features had p-values under the 0.05 threshold, meaning that they
of the number of clicks: clickscore =                 × log2 clicks.     are statistically different. Figure 2 shows the density plot of two
                                         impressions
   The addition of the logarithmic term is to give an additional         features with a p-value under 0.05.
priority for products that have a high click count and are more pop-        By looking at the density plot (Figure 2) of the features under
ular. We only considered products that have more than a thousand         the two categories (most and least relevant) we can see that the
impressions to try to eliminate eventual noise coming from prod-         distributions are slightly different, corroborating the idea that im-
ucts that appeared very few times to the customers. For example,         age features do influence users in the click decision. For instance,
a high click rate on a product that appeared very few times over         in Figure 3a we can see that images that are more clicked have a
many queries may suggest a customer looking for a very specific          higher exposure, which makes sense, since brighter images tend to
product that does not otherwise show up in other searches and            attract more attention.
therefore is not a clear indication that the product has a good image
as perceived by larger set of users.                                     5.2    Quality Prediction
   Based on these scores, we then label images that are above the        We performed a second experiment to check how accurately we can
80th percentile as “highly clicked” images. Images that are bellow       predict the quality of the product’s image based on its click data.
this percentile were considered “poorly clicked”. The idea is to         Given that the products have a category, and since the images vary
check if image features, including features related to aesthetics,       vastly from category to category, we built different models for each
influence the amount of product clicks in e-commerce search.             category. Thus, we divided the prediction into 10 sets of products
   Figure 1 shows two examples of product’s images from the web-         corresponding to the ten most common categories. A thousand
site. Figure 2a and 2b are from products that have a high and low        images labeled as “highly clicked” and a thousand image labeled as
score, respectively. The first image has more colors, better lighting    “poorly clicked” were put into each one of these ten groups. Finally,
and is overall more attractive than the first one.                       we use three sets of features (Base, Base + GIST and Base + BOVW)
                                                                         to train an SVM [9] with a 10-Fold cross validation procedure.
                                                                            Table 2 shows the metrics F1, Precision and Recall for the predic-
5   EXPERIMENTS AND ANALYSIS                                             tions (in the test sets of the cross-validation procedure) of the ten
Two experiments are conducted. First, we verify whether there is         categories and the three sets of features. Firstly, we can see that,
a significant difference in the values of image features between         although predictions are hard, as the categories have a mean F1 of
highly relevant (clicked) products and the less clicked products.        56.7% for the Base features (the worst being 53% and the best 61%),
Second, we test the capacity of a machine learning model to predict      for most categories they are still statistically better than random
whether or not a product will be highly clicked based on its image       (F1=0.5). Thus, there is indeed some predictive power in the set
features.                                                                of Base features. Secondly, we can see that the GIST features only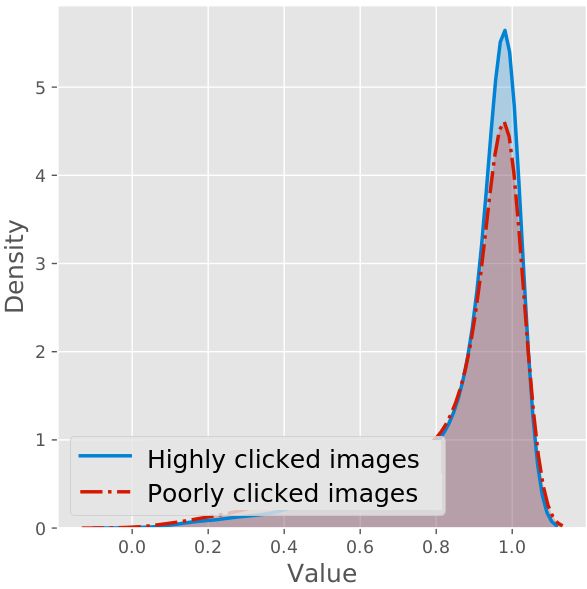
SIGIR 2019 eCom, July 2019, Paris, France                                                                                                                  Maros et al.
                Table 2: Classification results for different categories of products using different sets of features.

                                                       Base                           Base + GIST                           Base + BOVW
                 Category                    F1        Precision   Recall       F1         Precision    Recall         F1        Precision    Recall
                 Birthdays and Parties   0.56 ± 0.04     0.55      0.58     0.57 ± 0.04      0.55        0.59     0.58 ± 0.03       0.56       0.60
                 Party favors            0.56 ± 0.05     0.52      0.61     0.50 ± 0.04      0.50        0.49     0.55 ± 0.06       0.52       0.60
                 Decoration              0.59 ± 0.03     0.57      0.62     0.58 ± 0.04      0.57        0.59     0.60 ± 0.02       0.57       0.64
                 Baby                    0.53 ± 0.04     0.54      0.52     0.54 ± 0.04      0.53        0.54     0.55 ± 0.03       0.55       0.55
                 Children’s              0.61 ± 0.05     0.52      0.72     0.55 ± 0.03      0.51        0.60     0.61 ± 0.04       0.53       0.72
                 Invitations             0.54 ± 0.03     0.52      0.56     0.45 ± 0.07      0.52        0.41     0.54 ± 0.03       0.53       0.55
                 Home                    0.55 ± 0.04     0.56      0.54     0.58 ± 0.03      0.55        0.58     0.58 ± 0.04       0.59       0.57
                 Clothes                 0.57 ± 0.03     0.56      0.59     0.57 ± 0.04      0.55        0.60     0.58 ± 0.03       0.54       0.63
                 Paper & Co              0.55 ± 0.02     0.55      0.55     0.59 ± 0.03      0.53        0.66     0.57 ± 0.03       0.55       0.58
                 Candies                 0.61 ± 0.02     0.55      0.69     0.59 ± 0.03      0.54        0.67     0.60 ± 0.02       0.59       0.64

helped to improve the F1 score in four out of the ten categories,                    propose specialized models for different categories, since the influ-
making only the recall higher whilst reducing the precision. The                     ence of the images in product clicks seem to vary according to the
BOVW features improved the results in six of the ten categories,                     product category. We plan to study in more detail why and how
increasing both, recall and precision. This means that local features                product categories differ in order to produce more accurate models
have an interesting potential in this application.                                   to better predict product clicks from image quality. Finally, we in-
   Finally, we note that clearly some categories are easier to predict               tend to run additional comparative experiments (e.g., comparing
than others. The categories “Candies” and “Children’s” had the                       images with product’s titles and prices) to deepen our understand-
highest F1 while categories such as “Invitations” and “Baby” had                     ing of a customer’s motivation to click on a product.
the lowest. This could be explained by the types of images that are
presented in these categories. In the “Candies” category, we usually                 ACKNOWLEDGEMENTS
have products that have bright colors, with different shapes, sizes                  This work was partially supported by Elo7, the FAPEMIG-PRONEX-
and textures that can attract attention and clicks. In this category,                MASWeb project – Models, Algorithms and Systems for the Web,
images that do not have many colors or that are darker may have                      process APQ-01400-14, as well as by the National Institute of Sci-
a lower click rate. However, in the “Invitations” category, where                    ence and Technology for the Web (INWEB), CNPq and FAPEMIG.
we have very similar images to one another, mostly white paper
invitations with similar texture, the image may not be a deciding                    REFERENCES
factor for a product’s click rate.                                                    [1] G. D. Birkhoff. Aesthetic measure, volume 38. Harvard University Press Cambridge,
   Although there are some categories that are easier to predict                          79 Garden St, Cambridge, MA 02138, USA, 1933.
                                                                                      [2] Z. Chen and A. J. Dubinsky. A conceptual model of perceived customer value in
than others, the precision is still low. This indicates that the image                    e-commerce: A preliminary investigation. Psychology & Marketing, 20(4), 2003.
alone is not completely responsible for the user’s decision to click                  [3] F. Crete, T. Dolmiere, P. Ladret, and M. Nicolas. The blur effect: perception and
on a product. Other factors such as the price range and the title                         estimation with a new no-reference perceptual blur metric. In Human vision
                                                                                          and electronic imaging XII, volume 6492. International Society for Optics and
of the product may influence customers actions. But, as we can                            Photonics, 2007.
see from the results, a product’s image quality does have some                        [4] G. Csurka, C. Dance, L. Fan, J. Willamowski, and C. Bray. Visual categorization
                                                                                          with bags of keypoints. In Workshop on Statistical Learning in Computer Vision,
influence and could possibly be used to improve search results                            2004.
for an EC platform. The question of how much the quality of a                         [5] R. Datta, D. Joshi, J. Li, and J. Z. Wang. Studying aesthetics in photographic
product’s image influences its click rate as compared to its other                        images using a computational approach. In ECCV, 2006.
                                                                                      [6] L. Frost. What makes a painting good? PhD thesis, Rhodes University Graham-
properties (such as title and price) is left as future work.                              stown, 1987.
                                                                                      [7] D. Gefen. E-commerce: the role of familiarity and trust. Omega, 28(6), 2000.
                                                                                      [8] A. Goswami, N. Chittar, and C. H. Sung. A study on the impact of product images
                                                                                          on user clicks for online shopping. In WWW, 2011.
6    CONCLUSIONS & FUTURE WORK                                                        [9] M. A. Hearst. Support vector machines. IEEE Intelligent Systems, 13(4), July 1998.
In this work we investigated how product images influence prod-                      [10] S. E. Kaplan and R. J. Nieschwietz. A web assurance services model of trust for
                                                                                          b2c e-commerce. Int. J. of Accounting Information Systems, 4(2):95 – 114, 2003.
uct clicks in e-commerce platforms. The detection of aesthetically                   [11] Y. Ke, X. Tang, and F. Jing. The design of high-level features for photo quality
“bad” or “good” images can be used to improve e-commerce search                           assessment. In CVPR ’06, pages 419–426, 2006.
engines, and, consequently, customers’ satisfaction and revenue                      [12] D. G. Lowe. Distinctive image features from scale-invariant keypoints. Int. J. of
                                                                                          Computer Vision, 60(2):91–110, 2004.
for e-commerce companies. They may also provide feedback to                          [13] X. Lu, Z. Lin, H. Jin, J. Yang, and J. Z. Wang. Rating image aesthetics using deep
help sellers to make their product more attractive to customers.                          learning. IEEE Transactions on Multimedia, 17(11):2021–2034, 2015.
                                                                                     [14] L. Marchesotti, F. Perronnin, D. Larlus, and G. Csurka. Assessing the aesthetic
Our experiments show that image attributes such as brightness,                            quality of photographs using generic image descriptors. In ICCV, 2011.
colorfulness and contrast can influence product clicks. First, we                    [15] P. Marziliano, F. Dufaux, S. Winkler, and T. Ebrahimi. A no-reference perceptual
analyzed how some of these features vary when comparing more                              blur metric. In Image processing’02, volume 3, pages III–III. IEEE, 2002.
                                                                                     [16] A. Oliva and A. Torralba. Modeling the shape of the scene: A holistic representa-
frequently clicked products with less clicked ones. We then used                          tion of the spatial envelope. Int. J. of Computer Vision, 42(3):145–175, 2001.
machine learning to try to predict product clicks based on image                     [17] F. Perronnin and C. Dance. Fisher kernels on visual vocabularies for image
features. The performed experiments show that there is potential                          categorization. In CVPR, pages 1–8, June 2007.
                                                                                     [18] J. Rigau, M. Feixas, and M. Sbert. Informational aesthetics measures. IEEE
in this technique, specially for some specific categories of products.                    Computer Graphics and Applications, 28(2), 2008.
   As future work, we intend to test other machine learning meth-                    [19] L. Wu, D. Hu, L. Hong, and H. Liu. Turning clicks into purchases: Revenue
                                                                                          optimization for product search in e-commerce. In SIGIR, pages 365–374, 2018.
ods and to add other features, such as Fisher Vectors. We can also
You can also read