The Product Space Conditions the Development of Nations
←
→
Page content transcription
If your browser does not render page correctly, please read the page content below
The Product Space Conditions the
              Development of Nations
      C.A. Hidalgo R.*  (1), B. Klinger*(2), A.-L. Barabási(1), R. Hausmann(2).

   (1) Center for Complex Network Research and Department of Physics, University of
       Notre Dame, Notre Dame, IN. 46556.
   (2) Center for International Development, Kennedy School of Government, Harvard
       University, Cambridge, MA. 02139.
    To whom correspondence should be addressed: chidalgo@nd.edu.
   *These authors contributed equally to this work.

                                         Abstract
Economies grow by upgrading the type of products they produce and export. The
technology, capital, institutions and skills needed to make such new products are more
easily adapted from some products than others. We study the network of relatedness
between products, or ‘product space’, finding that most upscale products are located in
a densely connected core while lower income products occupy a less connected
periphery. We show that countries tend to move to goods close to those they are
currently specialized in, allowing nations located in more connected parts of the
product space to upgrade their exports basket more quickly. Most countries can reach
the core only if they “jump” over empirically infrequent distances in the product space.
This may help explain why poor countries have trouble developing more competitive
exports, failing to converge to the income levels of rich countries.

                                                                                      1
Does the type of product a country exports matter for subsequent economic performance? In David Ricardo’s words, does it matter if Britain specializes in cloth and Portugal in wine? The fathers of development economics held that it does, suggesting that industrialization creates externalities that lead to accelerated growth (1,2,3). Yet, lacking formal models, mainstream economic theory has not been able to incorporate these ideas. Instead, two approaches have been used to explain a country’s pattern of specialization. The first focuses on the relative proportion between productive factors (i.e. physical capital, labor, land, skills or human capital, infrastructure, and institutions)(4). Hence, poor countries specialize in goods relatively intensive in unskilled labor and land while richer countries specialize in goods requiring infrastructure, institutions, human and physical capital. The second approach emphasizes technological differences (5) and has to be complemented with a theory of what is behind these differences and how they evolve over time. The varieties and quality ladders models (6,7) assume a continuum of products, so there is always a slightly more advanced product or just a different one that countries can move to, abstracting away similarities between products when thinking about structural transformation and growth. Let us assume instead that the underlying productive factors are relatively specific to a set of products. For example, making cotton shirts does not require more or less skills than making chocolate, but different skills. Transporting oil requires pipelines on which you cannot transport fresh fruit, which do require cold storage systems that can be used by other fresh produce as well as institutional setups dealing with phyto-sanitary issues irrelevant for other manufactures. While existing theories abstract from this complexity, here we propose that it underpins the relatedness between products in the fact that countries specializing in one product may or may not also specialize in the other. We empirically study this pattern and use network techniques to show that this relatedness, calculated at a certain time point from trade data, governs how countries change their specialization patterns over time: countries move preferentially to related or ‘nearby’ goods. In theory, many possible factors may cause relatedness between products, such as the intensity of broad factors like labor, land, and capital(8), the level of technological sophistication (9,10), the inputs or outputs involved in a product’s value chain (e.g. cotton, yarn, cloth, garments) (11) or requisite institutions (12,13). All of these measures are based on a priori notions of what dimension of similarity is most important, assuming that factors of production, technological sophistication or institutional quality exhibit little specificity. Instead, we take an agnostic approach and use an outcomes-based measure, based on the idea that if two goods are related, because they require similar institutions, infrastructure, physical factors, technology, or some combination thereof, then they will tend to be produced in tandem, whereas highly dissimilar goods are less likely to be produced together. Our measure of similarity between products i and j is based on the conditional probability of having Revealed Comparative Advantage(14), which measures whether a country is an effective exporter (RCA>1) of a given good i or not (RCA
ϕ i , j ,t = min{P(RCAxi ,t | RCAx j ,t ), P (RCAx j ,t | RCAxi ,t )}
To calculate these probabilities we use international trade data, cleaned and made
compatible(15) through a National Bureau of Economic Research project lead by Robert
Feenstra(16), disaggregated according to the Standardized International Trade Code at the
4-digit level (SITC-4), providing for each country the value exported to all other
countries for 775 products. Using this we calculate the 775 by 775 matrix of revealed
proximity between every pair of goods using the equation above.
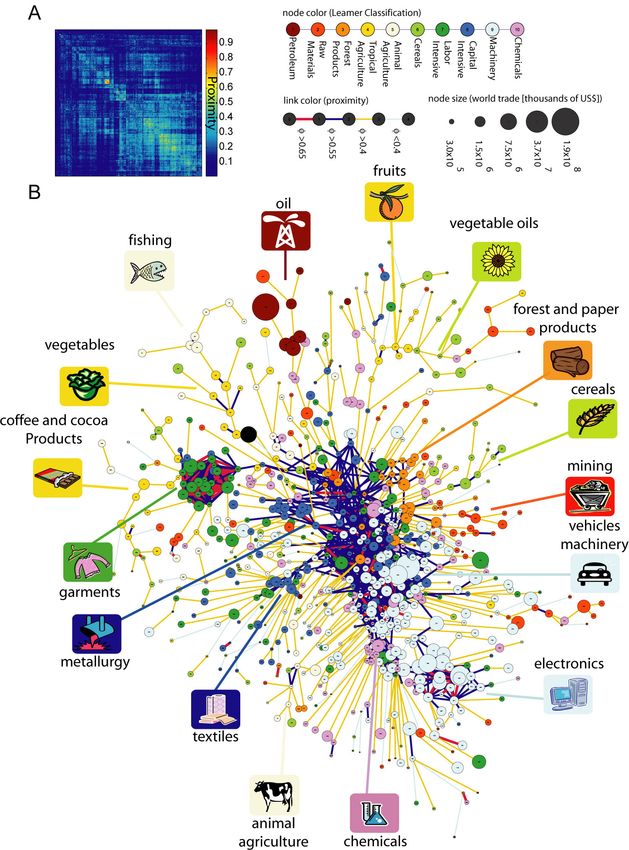
Figure 1A shows a hierarchically clustered version of the matrix. A smooth and
homogeneous product space would imply uniform values (homogenous coloring), while a
product-ladder model (7) would suggest a matrix with high values (or bright coloring)
only along the diagonal. Instead the product space of Fig 1 A appears to be modular (17),
with some goods highly connected and others disconnected. Furthermore, as a whole the
product space is sparse, with φij distributed according to a broad distribution (see
Supplementary Material) with 5% of its elements equal to zero, 32% of them smaller than
0.1 and 65% of the entries taking values below 0.2. These significant number of
negligible connections calls for a network representation, allowing us to explore the
structure of the product space, together with the proximity between products of given
classifications and participation in world trade. To offer a representation in which all 775
products are part of a single network we determined the underlying maximum spanning
tree (see Supplementary Material) and superposed on it the links with a proximity larger
than 0.55 (Fig 1B).
Far from homogenous, the product space appears to have a core-periphery structure (Fig
1B). The core is formed by metal products, machinery and chemicals while the periphery
is formed by the rest of the product classes. The products in the top of the periphery
belong to fishing, animal, tropical and cereal agriculture. To the left there is a strong
peripheral cluster formed by garments and another one belonging to textiles, followed by
a second animal agriculture cluster. At the bottom of the network we find a large
electronics cluster and to the right of the network we have mining followed by forest and
paper products.
The network shows clusters of products somewhat related to the classification introduced
by Leamer (8), which is based on relative factor intensities. Yet it also introduces a more
detailed split of some product classes. For example, machinery is naturally split into two
clusters, one consisting of vehicles and heavy machinery, and another one belonging to
the electronics industry. The heavy machinery cluster is also strongly interwoven with
some products classified as capital intensive such as metal products, but not to similarly
classified products such a textiles.
The map obtained can be used to observe the evolution of a country’s productive
structure. For this purpose we hold the product space fixed and study the dynamics of
production within it, although changes in the product space are also an interesting avenue
for future research (18).
3We first explore regional variations in the pattern of specialization for four regions in the
product space (Fig 2). Products exported by a region with RCA greater than 1, are
marked with black squares. Industrialized countries occupy the core, specialized in a set
of closely-related products such as machinery, metal products and chemicals. They also
have a considerable participation in more peripheral products such as textiles, forest
products and animal agriculture. East-Asian countries have developed RCA in a few
distinct clusters along the periphery of the core taking control of the garments, electronics
and textile clusters. Latin America and the Caribbean are further out in the periphery and
participate in mining, all types of agriculture and the garments sector. Finally sub-
Saharan Africa exports very few product types, all of which are in the far periphery of the
product space, indicating that each region has a distinguishable pattern of specialization
in the product space.
Next, we show that the structure of the product space affects potential changes in a
country’s pattern of specialization. Figure 3A shows how comparative advantage evolved
in Malaysia and Colombia between 1980 and 2000 in the electronics and garments sector
respectively. We see that both countries follow a diffusion process in which comparative
advantage moves preferentially towards products close to existing goods: garments in
Colombia and electronics in Malaysia.
Beyond this graphical illustration, is it really true that countries develop comparative
advantage preferentially in nearby goods? We use two different approaches to answer this
question. We first develop a measure of the average proximity of a new potential product
j to a country’s current productive capability, which we call density and define as
k
∑xφ
i
i ij
ω j = ,
∑φ i
ij
where ωkj is the density around good j for the kth country, xi = 1 if RCAi>1 and 0
otherwise and φij is the matrix of proximities between goods i and j. A value of ωj equal
to 0.4 for a given product/country means that in a particular country from the perspective
of the jth product, 40 percent of the neighboring space seems to be developed. To study
the evolution in the patterns of comparative advantage we consider products exported
with an RCA less than 0.5 in 1990 and look at the same products in 1995. For each
country, we call transition products those exported with RCA>1 in 1995 and
undeveloped products as those that in 1995 had an RCA< 0.5, disregarding the rest as
inconclusive. Figure 3B shows the distribution of density around transition products
(yellow) and compares it to densities around undeveloped products (red). Clearly, these
distributions are very distinct, with a higher density around transition products than
among undeveloped ones.
We deepen this approach by considering the density around each product in countries that
transitioned into them and compare it to the density in the countries that did not develop
comparative advantage in the product,
4T
∑ω
k =1
k
j /T
Hj = N
∑ω
k =T +1
k
j /( N − T )
where we average the ωj across the T countries that transitioned into the good and the (N-
T) countries that did not. Figure 3C shows the frequency distribution of this ratio. For 79
percent of products, this ratio is greater than 1 indicating that the density in countries that
transitioned is greater than in countries that did not, often substantially.
An alternative way of illustrating that countries develop RCA in goods close to the ones
where they had, is to calculate the conditional probability of transitioning into a product
if the nearest product with RCA>1 is at a proximity φ. Figure 3D shows a monotonic
relationship between proximity of the nearest good and the probability of transitioning
into it. While the probability of moving into a good at proximity 0.1 in the course of 5
years is almost nil, the probability is about 15 percent if the closest good is at proximity
of 0.8 (19).
Since production shifts to nearby products, we ask whether the product space is
sufficiently connected that given sufficient time, all countries can reach most of it,
particularly its dense core. Lack of connectedness may explain the difficulties faced by
countries trying to converge to the income levels of rich countries: they may not be able
to undergo structural transformation because proximities are too low. A simple approach
is to calculate the relative size of the largest connected component as a function of φ.
Figure 3E shows that at φ≥0.6 the largest connected component has a negligible size
compared with the total number of products while for φ≤0.3 the product space is almost
fully connected, meaning that there is almost always a path between two different
products.
We study the impact of the product space structure by simulating how the position of
countries evolve if they were allowed to repeatedly move to all products with proximities
greater than a certain φο. If countries are able to diffuse only to nearby products, but these
are sufficiently connected to others, then after several iterations, 20 in our exercise,
countries would be able to reach richer parts of the product space. On the other hand, if
the product space is sufficiently disconnected and modular, countries will not be able to
find paths to the richer part of the product space, independently of how many iterations
they are allowed to make at proximities above φο.
The results of our simulation for Chile and Korea are presented in Figure 4A. At a
relatively low proximity (φ=0.55) both countries are able to diffuse through to the core of
the product space, however Korea is able to do so much faster thanks to its current
presence in core products. For higher proximities the question becomes whether the
country can spread at all. Diffusing up to a proximity of φ=0.6 Chile is able to spread
very slowly throughout the space while Korea is still able to populate the core after 4
5rounds. At even higher proximities, φ=0.65, Chile is not able to diffuse at all and Korea
develops RCA slowly to a few products close to the machinery and electronics cluster.
To generalize this analysis for the whole world, we need a summary measure of the
position of a country in the product space. We adopt a measure based on Hausmann,
Hwang and Rodrik (20), which involves a two stage process. First, for every product we
assign an income level, which is the weighted GDP per capita of countries with
comparative advantage in that good, which we call PRODY (20). We then choose the
average of the PRODYs of the top N products that the country has access to. We
characterize the position of a country in the product space after M iterations at
proximities above φο as the average PRODY of the top N products that can be reached
and denote it by < PRODY > MN φ .We show the distribution of < PRODY > MN φ in Figure
4B for N = 50, M=20 and φ=1 (green), φ=0.65 (yellow) and φ=0.55 (red). The
distribution for φ=1 allows us to characterize the current distribution of countries in the
product space. It shows a bimodal distribution, signature of a world divided into rich and
poor countries with few countries occupying the center of the distribution. When we
allow countries to diffuse up to φ=0.65, this distribution does not change significantly: it
shifts slightly to the right due to the acquisition of a limited number of sophisticated
products by some countries. This diffusion process, however, stops after a few rounds
and the world maintains a degree of inequality similar to its current state. Contrarily,
when the diffusion parameter is lowered to φ=0.55, most countries are able to diffuse and
reach the most sophisticated basket in the long run. Only a few countries are left behind,
which unsurprisingly make up the poorest end of the income distribution.
To quantify the level of convergence we calculated the Inter Quartile Range (IQR) for the
distribution of < PRODY >50 20 φ and normalize this quantity by dividing it with the IQR for
the original distribution. Figure 4C shows that the level of convergence of the system
goes through an abrupt transition and that convergence is possible if countries are able to
diffuse to products located at a proximity φ>0.65.
The bi-modal distribution of international income levels and a lack of convergence of the
poor towards the rich has been explained using geographic (21) and institutional (12,13)
arguments. Here, we introduced a new factor into this discussion: the difficulties involved
in moving through the product space. The detailed structure of the product space is
shown here for the very first time and together with the location of the countries and the
characteristics of the diffusion process undergone by them, strongly suggests that not all
countries face the same opportunities when it comes to development. Poorer countries
tend to be located in the periphery of the product space in which the move towards new
products is harder to achieve. More interestingly, among countries with a similar level of
development and seemingly similar levels of production and export sophistication, there
is significant variation in the option set implied by their current productive structure, with
some on a path to continued structural transformation and growth, while others are stuck
in a dead end.
6These findings have important consequences for economic policy, as the incentives to
promote structural transformation in the presence of proximate opportunities are likely
quite different from that required when a country hits a dead-end. It is quite difficult for
production to shift to far-away products in the space, and therefore policies to promote
large jumps are more challenging. Yet, precisely these long jumps are the ones generating
new options for subsequent structural transformation.
In this paper we have mapped the product space, and studied how countries dynamically
evolve on it. We empirically proved that countries develop RCA following a diffusion
process for which our outcome based definition of the product space appears to be the
natural substrate. Moreover, the structure of the product space limits the diffusion process
by being non-traversable by jumps of any proximity. When we combine these results
with the fact that poorer countries tend to have RCA mainly on peripheral products, it
implies that a country’s productive structure is constrained not only by its levels of factor
endowments, but also by how easily those product-specific factors can be adapted to
alternative uses, as indicated by location in the product space. On a more global
perspective, these results point towards a new hypothesis for the lack of income
convergence in the world: convergence can only exist if countries have the ability to
reach any area of the product space. Our study shows that most of the diffusion occurs
through links with proximities of 0.6 or larger, thus the most popular strategy involves
diffusing to nearby products, a strategy that is successful for richer countries located on
the core of the space, and ineffective for poorer countries populating the periphery.
7Figure 1. The product space and Leamer clusters. A. Hierarchically clustered proximity
matrix representing the 775 SITC-4 product classes exported in the 1998-2000 period. B.
Network representation of the product space. This network was laid out using a force
spring algorithm and retouched by hand .
8Figure 2. Localization of the productive structure for different regions of the world. The
products for which the region has an RCA > 1 are denoted by black squares.
9Figure 3. Empirical evolution of countries. A. Examples of RCA spreading for Colombia
(COL) and Malaysia (MYS). The color code shows when this countries first developed
RCA>1 for products in the garments sector in Colombia and the electronics cluster for
Malaysia. B. Distribution of density for transition products and undeveloped products C.
Distribution for the relative increase in density for products undergoing a transition with
respect to the same products when they remain undeveloped. D. Probability of
developing RCA given that the closest connected product is at proximity φ. E. Relative
size the largest connected component NG with respect to the total number of products in
the system N as a function of proximity φ.
10Figure 4. Simulated diffusion process and inequality. A. Simulated diffusion process for
Chile and Korea in which we allow countries to develop RCA in all products closer than
φ= 0.55, 0.6 and 0.65. The number of steps required to develop RCA can be read from the
color code on the top right corner of the figure. B. Distribution for the average PRODY
of the best 50 products in a countries basket before and after 20 rounds of diffusion. The
original distribution is shown in green while the one associated with the distribution after
20 diffusion rounds with φ=0.65 is presented in yellow and φ=0.55 in red. C. Global
convergence of the diffusion process as a function of proximity measured by calculating
the inter quartile range after diffusing with a given φ normalized by the inter quartile
range of the original distribution.
111. A Hirschman, The Strategy of Economic Development (Yale University press,
New Haven, Conn., 1958)
2. P. Rosenstein-Rodan, Economic Journal 53 June-September (1943).
3. K. Matsuyama, Journal of Economic Theory 58 December (1992).
4. E. Heckscher, B. Ohlin, Heckscher-Ohlin Trade Theory, H. Flam, M. Flanders,
Eds. (MIT Press, Cambridge MA, 1991).
5. P. Romer. Journal of Political Economy 94 5 (1986).
6. P. Aghion, P. Howitt. Econometrica 60 2 (1992).
7. G. Grossman, E. Helpman. Review of Economic Studies 58 1 (1991).
8. E.Leamer, Sources of Comparative Advantage: Theory and Evidence (MIT Press,
Cambridge MA, 1984)
9. S. Lall, Oxford Development Studies 28, 337 (2000).
10. R. Caballero, A. Jaffe. NBER macroeconomics annual, O. Blanchard, S. Fischer,
Eds. 15 (1993)
11. E. Dietzenbacher, M. Lahr, Input-output analysis: frontiers and extensions
(Palgrave, NY, 2001).
12. D. Rodrik, A. Subramanian, F. Trebbi, Institutions Rule: the primacy of
institutions over geography and integration in economic development (NBER
Working Paper 9305, Cambridge MA 2002)
13. Acemoglu, Daron, Simon Johnson and James A. Robinson. "The Colonial Origins
Of Comparative Development: An Empirical Investigation," American Economic
Review, 2001, v91(5,Dec), 1369-1401
14. We use the Balassa definition of revealed comparative advantage (see methods).
B. Balassa, The Review of Economics and Statistics 68, 315 (1986)
15. Since one country’s exports is another country’s imports national statistics can be
reconciled this way and missing data from non-reporting countries can be
completed
16. Feenstra, R. R. Lipsey, H. Deng, A. Ma and H. Mo. 2005. “World Trade Flows:
1962-2000” NBER working paper 11040. National Bureau of Economic
Research, Cambridge MA
17. E. Ravasz, A.L. Somera, D.A. Mongru, Z.N. Oltvai, A.-L. Barabasi, Science 297
1551 (2002) G. Palla, I Derenyi, I Frakas, T Vicsek, Nature 435 814 (2005)
18. The network shown here represents the structure of the product space as
determined from the 1998-2000 periods. Holding the product space as fixed is a
good first approximation, as the dynamics of the network is much slower than the
one of countries. The Pearson correlation coefficient (PCC) between the
proximity of all links present in this network and the ones obtained from the same
network in 1990 and 1985 are 0.69 and 0.66 respectively (see supplementary
material). This indicates that although the network changes over time, after 15
years, the strength of past links still predicts the strength of the current links to a
considerable extent.
19. We repeated the same exercise using the rank of proximity instead of proximity
itself in order to assess whether what matters is absolute or relative proximity. We
found that absolute distance appears to be what matters most. We found that while
transition probability increases linearly with proximity, they decay with rank as a
power-law. Moreover, the rank effect is stronger for products in sparser parts of
12the product space, where transitions are also less frequent. Thus, densely
connected products can develop RCA through more paths than sparsely connected
ones, indicating the importance of absolute proximity
20. We follow the methodology developed in Hausmann, Hwang and Rodrik (2006),
which weighs the GDP per capita of each country exporting that product by the
RCA that the country has in that good. R. Hausmann, J. Hwang, D. Rodrik, What
you export matters (NBER Working Paper 11905, Cambridge MA 2006)
21. J. Gallup, J. Sachs, A. Mellinger, Geography and Economic Development
Gallup et al. International Regional Science Review.1999; 22: 179-232
13You can also read