Impact of the Mortgage Stress Test on the Lethbridge Region Housing Market
←
→
Page content transcription
If your browser does not render page correctly, please read the page content below

Impact of the
Mortgage Stress Test
on the Lethbridge Region
Housing Market
Prepared for Building Industry & Land Development (BILD) - Lethbridge Region
and Lethbridge and District Association of REALTORS®
by Miguel Martinez Santillan, MA. Econ.

February 15, 2019


Preface

This report was commissioned jointly by Building Industry & Land Development (BILD) Association
of Lethbridge Region and the Lethbridge and District Association of Realtors (LDAR) to assess
the impacts of the new Government of Canada mortgage “stress test” on the housing market in
Lethbridge and region. It focuses on the economic strengths of Lethbridge and district and housing
market within the wider context of the Alberta and Canadian economies.

BILD Lethbridge Region is made up of Home Builders, Land Developers and Trade, Renovators,
Suppliers and Service Professionals that support residential construction in Lethbridge and region.
We have 130 members with approximately 3,000 employees. Our members build communities
in Lethbridge, Coaldale, Taber, Picture Butte, Coalhurst and the County of Lethbridge. The
residential construction industry in Lethbridge is a major employer and contributor to our economy.
In 2017 new home building, renovation and repair provided 3,291 on-site and off-site jobs,
contributed $225 million in wages and $504 million in investment value. The Lethbridge and District
Association of REALTORS® is made up of 327 REALTOR® members who support Lethbridge and
rural community residents. In 2018 the Lethbridge real estate board reported 2548 MLS® sales
which equate to $163 million in economic spinoff (CREA stat).

Changes in government policies, including the OSFI-mandated mortgage stress test in 2018, have
increasingly placed constraints on homebuyers and had a perverse effect on the housing market
in Lethbridge. BILD Lethbridge Region homebuilder members reported a dramatic increase in the
number of rejected mortgage applications and a significant decrease in sales. LDAR REALTOR®
members echoed similar sentiments.

Without movement across the housing continuum, land developers and builders do not build;
residents do not buy and sell properties, this has a ripple effect that we are starting to see, including
job losses. Job losses aren’t just hurting big builders and developers. Residential construction
is a unique industry. Eighty percent of it is skilled tradespeople, contractors, subcontractors,
small businesses, and suppliers. Those are the people most deeply affected now because of the
decline. The bottom line is when residential construction fails and the real estate market is stunted,
Lethbridge suffers. This report is an effort to quantify the impact.

We would like to thank Miguel Martinez Santillan, MA Econ, for his work on this report to assess
the economic context of our region, and the impacts of changes of mortgage rules on our housing
market.

Bridget Mearns, Executive Officer on behalf of BILD Lethbridge Region
Cathy Maxwell, Executive Director on behalf of LDAR

                                                                                                    1
Executive Summary – Economic Analysis

Interest rates are expected to increase over
the foreseeable future. The pace of increase
will depend on developments in the oil        In 2016 and again in 2018, the Government of
market, housing, and global trade.            Canada introduced new mortgage stress
                                              tests, embodied in Guidelines B-20 and B-21
                                              issued by the Office of the Superintendent of
                                              Financial Institutions (OSFI). The new
Following implementation of the stress tests, Guidelines were meant to ensure that
it is estimated that homebuyer purchasing     Canadian borrowers take on mortgages they
power in Lethbridge decreased by 17.3%.       can afford. They apply to mortgage loans
There has been an additional decline in       made by all federally-regulated lenders,
affordability of 5.5% due to rising interest  including all chartered banks.
rates as of December 2018.
                                                   Using traditional measures, such as the price
                                                   to income ratio, Lethbridge is one of the
                                                   most affordable housing markets in
The new regulations will likely cause many         Canada.
households to reevaluate their housing
prospects. Some will have to lower their
expectations about what they can afford;
others will put their house hunting on hold        Based on projected interest rate increases,
until they have saved more; still others will be   by December 2020, homebuyers in
“priced out” and forced into or need to            Lethbridge are estimated to be able to
remain in the rental market.                       afford 27.2% less compared to what they
                                                   could prior to the stress test.
In 2018 new home sales are the lowest
since 2001.

                                             Lower income households have been
                                             impacted the most. 65% of the households in
                                             Lethbridge cannot afford to buy an average
Over 12% of the population in the Lethbridge price new single-family home.
has been priced out from purchasing an
average single-family home following the
stress test.

                                                                                                 2
Economic Overview

The Lethbridge Census Metropolitan area
(CMA) has been an outlier in the Alberta
economy. The region continues to attract
and employ people at record levels as a
result of strong economic prospects, a
diversified economy and a lower cost of
living.

Over the past four years, Lethbridge has
seen increased economic growth. By
contrast, most of Alberta continues to
struggle from low oil prices, lasting longer
than expected, and a lack of oil export
capacity to tidewater. Between 2014 and
2016, Alberta’s economy shrank by 7.4%,
whereas Lethbridge’s expanded by 5.3%.
                                                Lethbridge-Medicine Hat Region – Employment by industry
                                                (%) Total employment
Recently, Lethbridge has seen strong
business investment. Currently there are                         Public sector                                       24%
                                                                                                                    23%
over $1.1 billion worth of proposed and                                                                   19%
                                                       Trade and warehousing
under construction projects in the region.                                                                  20%
The $360 million Cavendish Farms potato        Construction & manufacturing                              18%
                                                                                                      16%
plant and the $260 million Science and                                                              15%
                                                                       Others
Academic building at the University of                                                               16%
Lethbridge are the two largest                        Business and profesional               11%
                                                                                                     16%
developments. While these projects are                                                  8%
                                                                   Agriculture
coming to completion in 2019, the region                                         2%
                                                                                      5%         Lethbridge-Medicine Hat
continues to be considered a good place                            Oil and gas         7%        Alberta
to invest.
                                                Source: Statistics Canada
Lethbridge’s economy is driven mainly by
agricultural production and stable
publicly-driven sectors of government           Commodity Prices
such as health-care and education. While       WTI/bbl                                                   Agricultural Index
overall agricultural prices remain stagnant,   $120             Crude Oil        Agricultural Products                 $250
global demand is on the rise for
agricultural commodities produced in the       $100                                                                    $225
area such as meat, oilseeds and                 $80                                                                    $200
plant-based protein. As well, the region
has seen substantial developments in            $60                                                                    $175
renewable energy generation. Over fifty         $40                                                                    $150
projects have been proposed or are under
construction.                                   $20                                                                    $125
                                                   2009 2010 2011 2012 2013 2014 2015 2016 2017 2018
                                                Source: BMO Commodities
                                                                                                                3
The Lethbridge & Medicine Hat economic        Unemployment Rate (%)
region quickly recovered after losing 6,500
and 8,500 jobs in the energy and               9
agricultural sectors, respectively, between    8
October 2014 and June 2016. As of              7
December 2018, the region posted a 4.5%        6
unemployment rate, the lowest in Alberta       5
and well below the national average.           4
                                               3
                                                                           Oil Recession
Continued economic growthin the region         2
has resulted in a higher demand for            1
labour. As of Q3 2018, there were 3,700            2013         2014     2015      2016         2017      2018
job vacancies in the Lethbridge                        Alberta        Lethbridge-Medicine Hat, Alberta       Canada
Medicine-Hat area which represents an         Source: Statistics Canada
increase of 33.3% compared to 2016. The
availability of employment opportunities
has led to sustained population growth in     Lethbridge-Medicine Hat Region - Components of
the region.                                   population growth (No. of people)
                                              8,000
According to the latest Census data
(2016), Lethbridge was the third-fastest      6,000
growing metro area in Alberta with a          4,000
population boom of 10.8% between 2011
and 2016. The region had an estimated         2,000
117,394 inhabitants in 2016 and is                   0
expected to expand by 7.8% between
2016 to 2021. The 30-39 year age group        -2,000
                                                          2002
                                                          2003
                                                          2004
                                                          2005
                                                          2006
                                                          2007
                                                          2008
                                                          2009
                                                          2010
                                                          2011
                                                          2012
                                                          2013
                                                          2014
                                                          2015
                                                          2016
                                                          2017
has seen the fastest population increase,
expanding 25% between 2012 to 2017.
                                                International Migration         Births/Deaths     Domestic Migration
                                              Source: Statistics Canada & own calculations
International migration and natural
increase are the main sources of
population growth. Out-migration,
particularly of recent graduates in their     Lethbridge CMA – Population growth (%)
mid-to-late twenties, is expected to
continue throughout the foreseeable                                                       11.3%           10.8%
future.
                                                                         8.9%
                                                         6.5%

                                                   1996-2001           2001-2006      2006-2011          2011-2016
                                              Source: Statistics Canada & own calculations
                                                                                                             4
Housing Market Overview

Home sales in the Lethbridge area slowed         Lethbridge CMA MLS Sales
down for the second year in a row in 2018.
According to the Lethbridge Real Estate                               Others       Single FamilyDetached
                                                  3,000
Board, residential sales decreased 3.6% in
2018 compared to 2017. This was primarily         2,500
driven by a 7.9% decrease in single-family        2,000
home sales during the same period. While
single- family is still the most sought-after     1,500
property type in Lethbridge, demand for           1,000
more affordable types of housing units is on
                                                   500
the rise. Apartment and townhouse sales
increased 10.4% and 16.8% between 2017                  0
and 2018. This includes properties sold via                 2009 2010 2011 2012 2013 2014 2015 2016 2017 2018
MLS® System. This portion of the market is       Source: Lethbridge Real Estate Board
primarily resale, though some builders may
also market newly-constructed properties via     Lethbridge CMA New Home sales
the MLS.
                                                 1200                                    Others     Single Family
Demand for new residential construction in       1000
Lethbridge continues to decline. 2018 home
sales in the Lethbridge area are at levels not    800
seen since 2001. New home sales are 40%           600
lower compared to highs reached in 2008.
Single family home sales decreased 8.6%           400
in 2018 compared to 2017 with 459 units           200
sold in 2018. New semi-detached homes
                                                    0
decreased 38.3% during the same period
                                                        1994
                                                        1995
                                                        1996
                                                        1997
                                                        1998
                                                        1999
                                                        2000
                                                        2001
                                                        2002
                                                        2003
                                                        2004
                                                        2005
                                                        2006
                                                        2007
                                                        2008
                                                        2009
                                                        2010
                                                        2011
                                                        2012
                                                        2013
                                                        2014
                                                        2015
                                                        2016
                                                        2017
                                                        2018
with only 29 sales. On the positive, while
overall demand continues to soften, prices
                                                 Source: CMHC Housing Information Portal
for new construction have held up. Prices in
2018 are at historical highs with an average
of $418,437 for single-family homes in the       Lethbridge CMA Housing Market Fundamentals
region.
                                              1,600            Household Formation              Housing New Supply
While new home construction increased 6.0% 1,400
in 2018 compared to 2017, it remains below 1,200
the 10-year average. Builders have reacted    1,000
to market conditions by decreasing supply.      800
Additionally, despite the slow down in sales,   600
Lethbridge housing market fundamentals          400
remain strong. Household formation, the
                                                200
number of new families to call Lethbridge
                                                  0
home, outpaces new housing supply. This
                                                        1996
                                                        1997
                                                        1998
                                                        1999
                                                        2000
                                                        2001
                                                        2002
                                                        2003
                                                        2004
                                                        2005
                                                        2006
                                                        2007
                                                        2008
                                                        2009
                                                        2010
                                                        2011
                                                        2012
                                                        2013
                                                        2014
                                                        2015
                                                        2016
                                                        2017
                                                        2018

trend is expected to continue throughout the
foreseeable future due to the region’s strong
employment and economic prospects.               Source: Statistics Canada & Own calculations
                                                                                                            5
Policy Changes – Bank of Canada, CMHC, OSFI

Following the 2007-2009 global financial              Canadian Interest Rates (%)
crisis, The Bank of Canada dropped its
overnight interest rate to a historical low of       8.0
                                                                    Overnight Rate        5-Year Mortgage rate
0.25%, aiming to decrease borrowing costs            7.0
and stimulate economic growth. However,              6.0
disappointing results exacerbated by the             5.0
collapse of oil prices in 2014 kept interest         4.0
rates at low levels, unwinding a near-decade         3.0
long era of cheap money.                             2.0
                                                     1.0
Strong economic growth in 2017 signaled              0.0
the end of the expansionary monetary               2008       2010     2012      2014      2016      2018    2020
policy as the Bank of Canada increased
                                                 Source: Bank of Canada, Conference Board of Canada & RBC
interest rates for the first time in 7 years in
July 2017. The Bank has hiked rates 5 times      Canadian Debt Indicators (%)
since then. Although the rate increases have
been modest, monetary policy is expected        Debt/Income                                       Debt Service Ratio
to continue tightening over the coming          120.0                                                           15.0
years. The pace of increase will depend on
developments in the oil markets, housing,
                                                110.0                                                           14.5
and global trade.
Over the past two years, home prices in              100.0                                                                 14.0
the Greater Toronto and Greater Vancouver
areas have risen substantially, driven by
                                                      90.0                                                                 13.5
strong demand and limited supply. The
                                                                             Debt/Income          Debt service ratio
increase in prices has led some borrowers
to take on high levels of debt pushing                80.0                                                                 13.0
Canadian household liabilities to an all time                2006   2008     2010     2012      2014     2016       2018
high.                                                 Source: Statistics Canada & M. Santillan’s own calculations

As interest rate rises loom over the horizon, a number of new regulations were put in place via the
Office of the Superintendent of Financial Institutions (OSFI) to ensure that Canadian borrowers take
on mortgages they can afford. Prior to October 17, 2016, borrowers could qualify for a larger loan
by selecting a 5-year fixed-rate mortgage which had a low interest rate. The qualification rules for
a 4 years or less mortgage required a “stress test” using the higher Bank of Canada “Benchmark-
Rate” in the affordability calculation. As a lower rate equated to a higher loan amount, borrowers
gravitated to the 5-year fixed rate.
An additional set of OSFI guidelines introduced on January 1, 2018 require buyers, despite a higher
down payment amount, also to undertake a “stress test”. This is to determine if borrowers could
afford to pay back a loan if interest rates were to go higher. Homebuyers are assessed against the
Bank of Canada five-year benchmark standard rate (5.34 per cent as of January 11, 2019). The
mortgage benchmark rate is higher than the rate offered by lenders in the market. Additionally, a
homebuyer must have a Gross Debt Service ratio (cost of homeownership relative to income) no
greater than 35 per cent and a Total Debt Service ratio (cost of homeownership plus all other debts
relative to income) no greater than 42 per cent.                                                6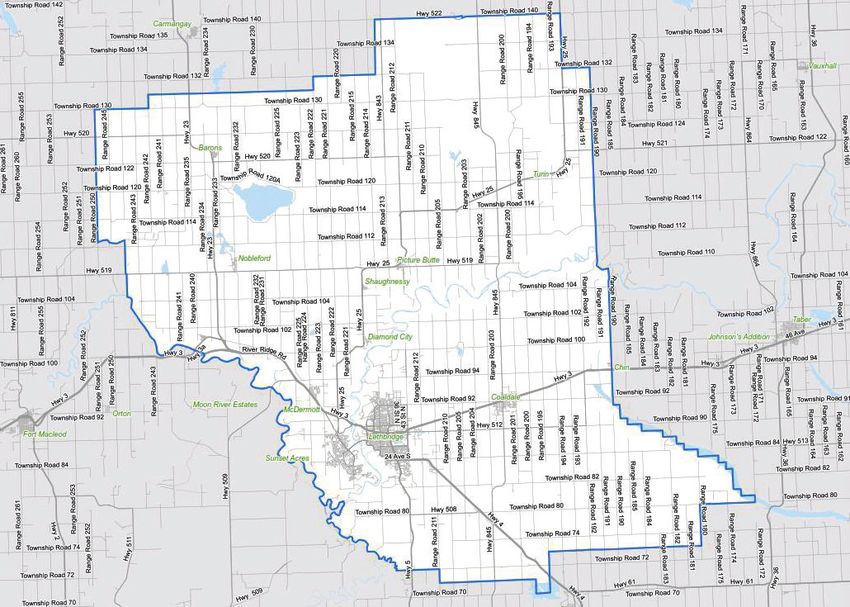
Lethbridge Housing Affordability and the
Stress Test
Since 2012, the federal government has              Price to Income Ratio – Selected Western Canada CMAs
introduced a range of new mortgage rules,
including more stringent GDS and TDS                              Lethbridge             4.0
caps, a $1 million cap on purchase prices,                            Regina             4.1
a 10 percent down payment requirement                             Saskatoon               4.2
on the portion of an insured mortgage over                        Edmonton                4.2
$500,000, OSFI B21 and B20 guidelines,                             Winnipeg               4.2
a restriction on mortgage refinancing and,                           Calgary               4.5
most recently, a stress test for low-ratio loans                    Kelowna                        6.7
based on an interest rate 2 percent higher                Abbotsford-Mission                       6.8
than the actual rates being charged.                                 Victoria                            8.4
                                                                  Vancouver                                      11.0
Using traditional measures such as the             Source: Lethbridge Economic Development
price-to-income ratio, Lethbridge is one
of the most affordable markets in Canada.
However, the new stress tests have
artificially reduced purchasing power in            Maximum Affordability- Lethbridge Median Income
market as shown in the second and third                        Pre-Stress Test                           $400,487
charts.                                            Stress Test - October 2016                     $331,140
                                                                    July 2017                     $324,707
A household earning a median income
in Lethbridge, approximately $75,000, was                       January 2018                     $314,359
able to afford a $400,000 home prior to the                   December 2018                      $309,196
implementation of the stress test.                           September 2019                  $295,761
Immediately after the enactment of the                           March 2020                  $293,151
new rules on October 2016, the same                           December 2020                  $291,470
household earning the same income was
                                                    Source: Calculations based on NAHB "Priced-Out" Methodology
only able to purchase a $331,000 home.
This represents an instant reduction of
17.3% attributed to the new rules. As of
December 2018, that same homebuyer is               Income Required to Buy a New Single Family Home
now only able to afford a $309,000 home.
This represents an additional 5.5%                             Pre-Stress Test                        $77,443
decrease in affordability due to the rising        Stress Test - October 2016                                  $92,584
interest rates. The expectation is that the                          July 2017                                 $94,316
Bank of Canada will continue to raise rates                      January 2018                                   $97,252
over the foreseeable future. By December                      December 2018                                      $98,790
2020, the same household would be able
                                                             September 2019                                      $103,044
to afford only a $291,000 home.
                                                                  March 2020                                     $103,915
                                                              December 2020                                      $104,485

                                                     Source: Calculations based on NAHB "Priced-Out" Methodology

                                                                                                                    7
Further Indicators of Stress-Test Affordability
Impacts
Although the new regulations apply to every
                                                       Lethbridge Maximum Affordability by Income Group
Canadian, lower-income households have
                                              $900,000
been impacted the most. This will further     $800,000
worsen income inequality as the lower income  $700,000
groups traditionally include a larger share   $600,000
                                              $500,000
of vulnerable groups, younger families and    $400,000
newcomers to Canada.                          $300,000
                                              $200,000
                                              $100,000
The bottom line is that 65% of the households       $0
in Lethbridge cannot afford to buy an average                        Under      $ 40,000 - $ 60,000 - $ 80,000 - $100,000 -
price new single-family home. The average                           $40,000      $59,999    $79,999    $99,999 $149,999
price is hovering around $420,000. Over                % of total
                                                                     23%         16%            14%         12%          20%
12% of the population in the region has                Households
                                                               Before StressTest                      Today
been priced out from purchasing an average
                                                               Price New Home                         Average Resale Price
single-family home following the stress test.
Moreover, almost 14% of the population in              Source: Calculations based on the NAHB "Priced-Out" Methodology
Lethbridge has been priced out from buying an
average-priced home in the resale market.              Lethbridge CMA – New Home Sales

The recent increase in economic and                                                                        Stress-Test
                                                                                                         implementation
political uncertainty impacting Alberta is              80
compounded with the effects from the stress
test. Lethbridge new home sales decreased
11% between 2018 and 2017. 2018’s total new
                                                        60
home sales are the lowest since 2001. Only
the more affordable row housing registered
higher sales with a whopping 40% year-over-
year increase. Additionally, the unabsorbed             40
inventory, completed but unsold new homes,                   2009 2010 2011 2012 2013 2014 2015 2016 2017                2018
continues to be above the 10-year average                                     12-Month Moving Average
                                                        Source: CMHC Housing Market Portal & author’s forward projections
with 2,227 homes in 2018. This represents over
an 11% increase from 2017.
                                                        Lethbridge CMA - Unabsorbed Inventory
The new regulation will likely cause many
                                                       300           Single     Semi-Detached         Row       Apartment
households to reevaluate their housing
prospects. Some individuals will have to lower         250
their expectation about what they can afford           200
shifting from the dream of owning a single-
                                                       150
family home to a half-duplex or a condo.
Other families will put their house hunting            100
on hold until they have saved more for a               50
bigger down payment. A larger portion of the
                                                         0
population will be priced out and need to stay in or
                                                             2009 2010 2011 2012 2013 2014 2015 2016 2017 2018
move to the rental market.
                                                        Source: CMHC Housing Market Portal
                                                                                                                     8
Lethbridge Census Metropolitan Area
9References
Affordability Calculation:
Assumes a 10% down payment, a starting B20 stress-test interest rate of 5.34%, a 3.1% insurance
premium, $150/month heating costs and $350/month for other debts. Historical mill rates as per The
City of Lethbridge. Interest rates are projected to continue to increase at recent increments to 2020.
Sources:
• BMO Capital Markets. (December, 2018). The Goods, A monthly commodity watch. At: https://
economics.bmocapitalmarkets.com/.
• City of Lethbridge. Single Family Residential Tax Calculator. At: https://www.lethbridge.ca/living-here/My-Taxes/
Pages/Calculators/Residential.aspx.
• Conference Board. (2017). Mid-Sized Cities Outlook: Economic Insights Into Select Canadian
Cities—2017. Ottawa: The Conference Board of Canada.
• Canada Mortgage and Housing Corporation. CMHC Starts and Completions Survey. Housing Market Information
Portal. (Database).
• Economic Development Lethbridge. At: www.chooselethbridge.ca.
• Gathergood, John and Weber, Joerg. (February, 2017). “Financial Literacy: A Barrier to Home Ownership for the
Young?”. Journal of Urban Economics, Vol. 99.
• Gathergood, John. (2011). "Self-Control, Financial Literacy and Consumer Over-Indebtedness". Journal of
Economic Psychology. Vol. 33.
• Lethbridge and District Association of REALTORS. Historical Database. At: http://www.ldar.ca/content-main.asp?
CatID=3.
• RBC Economic Research. (January 9, 2019). "Rate hikes delayed but not canceled: BoC maintains tightening bias
despite near-term growth wobbles". Daily Economic Update. At: http://www.rbc.com/economics/daily-economic-
update/index.html.
• Statistics Canada. (2017). Focus on Geography Series, 2016 Census. Catalogue no. 98-404-X2016001.
• Statistics Canada. Components of population growth by economic region, age group and sex, annual, based on the
Standard Geographical Classification (SGC) 2011, Table: 17-10-0082-01 (Database).
• Statistics Canada. Debt service indicators of households, national balance sheet accounts. Table: 11-10-0065-01.
(Database).
• Statistics Canada. Employment by industry, annual, provinces and economic regions (x 1,000). Table:
10-0092-01. (Database).
• Statistics Canada. Gross domestic product (GDP) at basic prices, by industry, provinces and territories (x 1,000,000).
Table: 36-10-0402-01. (Database).
• Statistics Canada. Labour force characteristics by economic region, three-month moving average, unadjusted for
seasonality, last 5 months. Table: 14-10-0293-01. (Database).
10You can also read