Impact of UK Welfare Policy on Families with Children - 1st September 2017 - The ...
←
→
Page content transcription
If your browser does not render page correctly, please read the page content below

Impact of UK Welfare Policy
on Families with Children

1st September 2017
Contents
1. Introduction

2. Changes in welfare policy since 2015/16

     2.1 Financial impact of post 2015/16 welfare policy changes

     2.2 List of key welfare policy changes

     2.3 Other changes affecting family incomes

3. Long-term impact of welfare policy changes

4. Emerging short-term evidence of the impact of welfare policies

     4.1 The impact of the lower Benefit Cap

     4.2 The impact of the 2 child limit (Tax Credits and Universal Credit)

5. Long-term impact on households - illustrative case studies

     5.1 Methodology

     5.2 Assumptions

6. Case study 1 – Out-of-work lone parent with 3 children (Ms P)

     6.1 The impact of welfare policy on Ms P

     6.2 The effect of the Benefit Cap on Ms P

     6.3 The effect of moving into work for Ms P

7. Case study 2 – In-work couple with 2 children (Mr and Mrs G)

     7.1 The impact of welfare policy on Mr and Mrs G

     7.2 The impact of the Benefit Cap on Mr and Mrs G

8. Case study 3 – In-work couple with 4 children (Mr and Mrs C)

     8.1 The impact of welfare policy on Mr and Mrs C

     8.2 The impact of Mr C losing employment – application of the Benefit Cap

Technical Annex A – Assumptions in the TABOSH model

Technical Annex B – Poverty Analysis

                                                                                 1
MINISTERIAL FOREWORD

                                    Since 2010, successive UK Governments have
                                    introduced a raft of welfare changes in pursuit of
                                    their austerity approach to deficit reduction. As this
                                    report shows, these changes have targeted people
                                    on low incomes across Scotland, with families with
                                    children the hardest hit.

                                    The scale of the cuts is deeply troubling. UK
                                    Government changes are expected to reduce
welfare spending in Scotland by nearly £4 billion a year by the end of this decade.
And almost £1 billion of this will be a direct result of cuts imposed since 2015.
Hundreds of thousands of people in communities across Scotland will have lost
some financial support. It makes little economic sense to take money and support
from struggling households – causing significant individual and family hardship and
stacking up more problems that need to be addressed through other services. It
means that support has to be provided via another route or we have to invest in
emergency and crisis-management, which is so much more costly – in a range of
ways - than preventative approaches.

The scale of the cuts is a serious concern and just as troubling is how the cuts have
been timed and implemented. The four year freeze to working age benefits, for
example, comes at a time when sustained increases in the cost of living are
expected. This is on top of the introduction of a cap on the amount of benefits a
family can receive, which has now been lowered even for lone parents with very
young children – a policy that a recent High Court judgment said was causing “real
misery” to lone parents’. And then there’s the two child limit for tax credits penalising
larger families, alongside the despicable ‘rape clause’. The cuts make little economic
sense and they make no moral sense whatsoever. These are clearly political choices
by the UK government in pursuit of a policy of cuts, regardless of the emerging state
of the economy or the impact on individuals and communities.

This report shows the stark reality of welfare cuts for different family types across
Scotland, looking behind the averages at the specific impact in hypothetical case
studies and drawing upon emerging evidence of real examples of families affected
by these policies, identified with the help of Child Poverty Action Group. This
analysis also highlights that in some cases, even moving into employment might not
be enough to compensate for the scale of welfare cuts that are coming down the
line. Indeed, the most recent statistics show that 7 in 10 children in poverty are living
in working households. Recent analysis by the Institute of Fiscal Studies has shown
that these UK government welfare policies will cut, on average, more than 10% from
the incomes of poorer families with children.

There is too a growing body of hard evidence that the rollout of full service Universal
Credit, in particular the in-built 6 week wait for the first payment, is causing additional
and unacceptable levels of anxiety, hardship and rent arrears. We have repeatedly
called on the UK Government to halt the rollout until these problems are resolved but
so far they are simply not listening. With Scotland’s local authorities, the recent
damning reports from Citizen’s Advice Scotland and others, we will continue to press

                                                                                         2
the UK government to take the sensible step of pausing their roll-out and fixing the
well evidenced problems, rather than carrying on regardless and imposing a broken
system on more and more people with all the damage that is causing.
In the years 2013/14 to 2016/17, we have invested over £350 million to support low
income families and mitigate against the worst of the damage done by UK
Government reforms. This includes fully mitigating the Bedroom Tax - ensuring more
than 70,000 households save around £650 per year on average and are able to stay
in their own home - and helping 254,000 individual households, a third of which
include children, through the Scottish Welfare Fund.
But mitigation on its own, though it provides vital relief to those worst affected, is
simply a sticking plaster on the chasm of damage being done to our fellow citizens
by the UK government. And every penny we spend on mitigation is money we can’t
then use to invest in tackling poverty and other services.
In Scotland, we are taking a very different approach from that of the UK government.
Our new social security system will be rights based and at its core, the firm belief
that it represents an investment made in ourselves and in each other with the
founding principles of dignity and respect to guide us. To help parents with financial
and practical support in the early years of their children’s lives, we are increasing
free childcare, introducing a new Best Start Grant, universal free school meals for
P1-3, and delivery of the Baby Box of essential items is already underway. And,
while the UK Government has scrapped its targets to reduce child poverty, we have
responded by making those targets stronger and reintroducing them to the Scottish
Parliament, determined as we are to eradicate child poverty once and for all.
The UK Government must end its ideologically-driven assault on those least able to
cope. Our collective ambition must surely be for families to bring up their children
successfully so they can thrive – because it’s in the best interests of our economy,
our society and our country that they can do so. We must do all we can to help –
and, in Scotland, we will.
ANGELA CONSTANCE
CABINET SECRETARY FOR COMMUNITIES,
SOCIAL SECURITY AND EQUALITIES
3Impact of UK Welfare Policy on Families with Children
1. Introduction
The Scottish Government published its annual report on the impacts of welfare reform
in Scotland in June 20171. The report analysed the financial impact of the UK
Government’s welfare policies introduced since 2010 at a Scotland and Scottish local
authority level by 2020/21. It also brought together evidence on the impact of welfare
reform on income inequality, poverty and child poverty and the impact on women and
people with disabilities.
This report is supplementary to the annual welfare reform report in that it focusses on
impacts on families with children. Many of these impacts are still to be fully felt by
households, as many of the changes were brought in recently (April 2017). This report
therefore draws upon emerging evidence of the immediate early impact of these
welfare policy changes through real case studies provided by the Child Poverty Action
Group (CPAG). This section gives examples of families affected by the lower Benefit
Cap and the two child limit to Tax Credits/UC child element.
The main focus of the report is looking at what the full financial impacts of these
welfare policies will be by 2020 through illustrative case studies. In each case study
the overall impact of welfare cuts on the household’s net income is analysed, which is
broken down, where possible, by each welfare policy change. The analysis looks at
how welfare cuts compare to other policies, such as the introduction of the National
Living Wage. It also considers changes in circumstances for these families, such as
gaining or losing employment, and how this will affect net incomes for case study
families.
This report focuses on three illustrative case study families:
Case Study 1 – Ms P is a lone parent, bringing up three 3 children and is not
working due to childcare responsibilities. By 2020/21 Ms P and her family are
estimated to lose £4,080 per year in benefit entitlement compared to what
they could have been entitled to had UK post-2015 welfare policies not
been enacted.
Case Study 2 – Mr and Mrs G are a couple who live with their 2 children and
Mrs G works part-time (16 hours per week) at the National Living Wage. By
2020/21 Mr and Mrs G and their family are estimated to lose £1,540 per year
in benefit entitlement compared to what they could have been entitled to
had UK welfare policies not been enacted.
Case Study 3 – Mr and Mrs C are a couple who live with their 4 children.
Mr C works around 20 hours per week and Mrs C also works two days per
week (12 hours) at the National Living Wage. By 2020/21 Mr and Mrs G and
their family are estimated to lose £1,130 per year in benefit entitlement
1
Scottish Government (June 2017) ‘Welfare Reform (Further Provision) (Scotland) Act 2012: Annual
Report 2017’.
4compared to what they could have been entitled to had UK welfare
policies not been enacted.
These case studies are for hypothetical, illustrative households, and are not based on
actual cases. This complements previously commissioned longitudinal research into
the impacts of welfare reform on real households2, whilst on-going work with Scottish
Government’s experience panels will inform the delivery of new social security
powers3.
In addition to this report, the Scottish Government will also publish two further reports
on the impact of other welfare policies on disabled people and the impact on housing
related policies later this year.
2
Graham, H. et al. (June 2016) ‘The Impact of Welfare Reform in Scotland - Tracking Study - Sweep
4 Report’.
3
For more information on Experience Panels see the following link:
http://www.gov.scot/Topics/People/fairerscotland/Social-Security/Experience-Panels
52. Changes in welfare policy since 2015/16
2.1 Financial impact of post 2015/16 welfare policy changes
During the 2010-15 and 2015-17 parliaments, the UK Government implemented a
programme of significant change in the welfare system, which formed a central part of
a wider policy objective of austerity and deficit reduction.
This report focusses on policies introduced by the 2015-17 UK parliament which will
continue to impact families in Scotland to 2020/21 and beyond. In total, policies
passed in the 2015-17 parliament are expected to reduce welfare spending in
Scotland by around £0.9 billion by 2020/21 (see table 1).
The policies listed in table 1 are in addition to those passed in the 2010-15 parliament,
which are expected to reduce welfare spending by £1.9 billion by 2020/21. Therefore,
the overall impact of welfare policies is to reduce annual welfare spending in Scotland
by £3.9 billion by 2020/214.
Table 1 – Post-2015 welfare policies – impact at a Scotland level
All costings in £ millions 2016-17 2017-18 2018-19 2019-20 2020-21
Four year benefit freeze - 66 194 359 368
UC work allowance reduction 10 97 177 227 254
CTC and UC 2 child limit - 19 46 71 95
Cap social rents to LHA - - - 0 20 68
CTC and UC family element 8 18 31 42 50
removal
Support for Mortgage interest - 2 - 3 22 20 20
loan
ESA WRAG reduction - 4 14 21 26
Pension credit saving credit 15 15 15 15 14
freeze
Benefit Cap 4 9 6 6 6
TC income rise disregard 8 13 14 8 5
HB 18-21 entitlement end - 1 3 4 4
UC conditionality - - 0 - 3 3
UC taper - -3 -14 - 32 - 45
Total 42 235 507 763 867
2.2 List of key welfare policy changes
In the case studies outlined in this report, the focus is on the impact of policies which
have particularly affected families with children, these include:
1. The 2 child limit for tax credits and Universal Credit elements: From April
2017, child tax credit will be restricted to two children for new births after 6 April
20175. This change also applies to child elements in Universal Credit for new
claims.
4
Note – for more information see section 3 of the Welfare Reform (Further Provision) (Scotland) Act
2012: Annual Report 2017’.
5
A number of exemptions to the 2 child limit exist, for more information see page 60 of the Welfare
Reform Report 2017.
62. The removal of the ‘family element’ for child tax credits and Universal
Credit: the ‘family element’ is paid to all households with children and worth
around £545 per year as of 2016/17. New families who make a CTC claim from
April 2017 will not be entitled to a family element. An equivalent change was also
introduced to new claims under UC, where the first child is not entitled to a higher
child element from April 2017.
3. Lower Benefit Cap: the Benefit Cap was first introduced in April 2013. This
restricted the total benefit income of a family with children to around £26,000 per
year. From November 2016 a new lower cap was introduced of £20,000 per year.
4. The four year freeze to working-age benefits: the main working-age rates of
Income Support, Jobseeker’s Allowance, Employment and Support Allowance 6,
Housing Benefit, Tax Credits (Child and Working) and Universal Credit will be
frozen at their 2016/17 level until 2019/20. Previously these rates would have
been uprated by the Consumer Price Index (CPI) measure of inflation. The
impact of this policy is highly dependent on the future path of inflation.
5. The reduction in the Universal Credit work allowance: Under Universal
Credit, some households can earn up to a given amount each month before their
benefit is tapered (i.e. partly or fully withdrawn depending on income). This
amount is called the work allowance. From April 2016, lower work allowances
were introduced. For example, a lone parent family on UC can earn around
£2,300 per year before some of their UC award is withdrawn. Previously, this
level was around £3,150 per year.
6. Change in the Universal Credit taper rate: The taper rate is the rate at which a
UC award is reduced as the claimants net incomes rise. From April 2017, this
rate was cut from 65% to 63%, which means in-work families keep more of their
UC award as their incomes increase. Unlike the other measures listed, this
change makes UC more rather than less generous for some families and is set to
increase welfare spending by £45 million per year by 2020/21.
Of the above measures, 1 and 2 will only affect families with children and 3 will affect
mostly families with children. Other measures will affect a range of different
household types.
2.3 Other changes affecting family incomes
As well as changes in the welfare system, the UK Government also introduced the
National Living Wage in 20167 and has committed to increase the personal tax
allowance to £12,500 by 2020/21. These major changes are modelled alongside
changes to the welfare system to put the overall impact of UK government welfare
policies in context, although the change in personal allowance would only have an
impact on working households whose (taxable) income is above the threshold.
6
Excludes those qualifying for ESA in the ‘Support group’.
7
See https://www.gov.uk/government/publications/national-living-wage-nlw/national-living-wage-nlw
7As part of the UK government’s welfare policy changes, a commitment to increase
the minimum wage to reach 60 per cent of median earnings in 2020 was made.
According to the latest OBR forecast, it is estimated that the National Living Wage
(NLW) will be £8.75 per hour in 2020/21, as opposed to £7.75 had the minimum
wage been uprated by average hourly earnings8.
3. Long-term impact of welfare policy change
This section highlights recent analysis by the Institute of Fiscal Studies and the
Resolution Foundation, who modelled the impact of changes to the tax and welfare
system at a GB level.
Both analyses look at the impacts on income in the long-run, when all cuts are fully
in place. For example, they assume that the 2 child limit applies to all families with
more than 2 children, rather than affecting new births and new claims only, as they
do at the moment.
Analysis by the Resolution Foundation is presented in figure 19. This shows that
change in average annual income (in £ per year and % of average income) across
all income deciles due to all key welfare policies listed in section 2.2 apart from the
Benefit Cap.
Figure 1 - Long run impact of welfare policy changes on net household income
(Source: Resolution Foundation)
8
Office for Budget Responsibility (March 2017) ‘Economic and Fiscal Outlook’ (see supplementary
economic table 1.19)
9
Resolution Foundation (May 2017) ‘Still just about managing? Pre-election briefing on the main
political parties’ welfare policies’. Available here:
http://www.resolutionfoundation.org/app/uploads/2017/05/Still-just-about-managing.pdf
8The analysis shows that households in the bottom 2 deciles are expected to be £800
and £1,000 per year (real terms10) worse off financially in the long-run compared to a
scenario where thee welfare policy changes had not taken place. This is the
equivalent of between 5% to 6.5% of average household income.
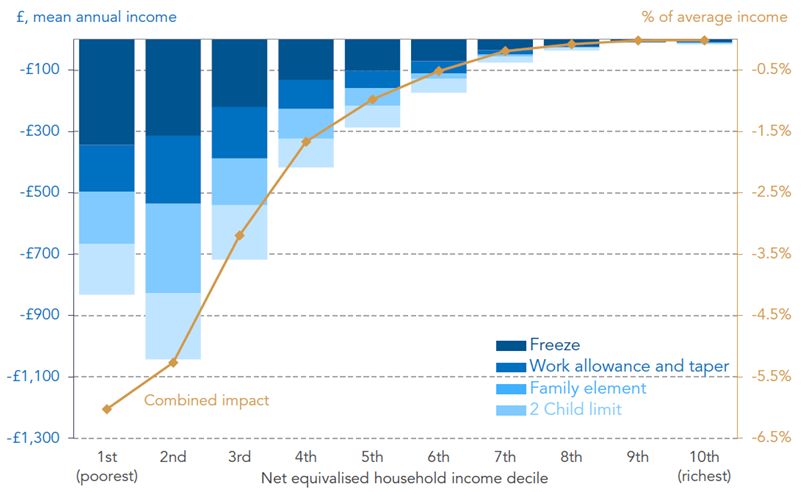
Similar analysis by Institute of Fiscal Studies (at a GB level) highlights the particular
impact on households with children11. Figure 212 shows the impact of 2015-17 tax
and welfare policies, and splits households within each income decile into working-
age families with children, working-age families without children and pensioner
households.
Figure 2 - Long-run impact of planned tax and welfare policies by income
decile and household type
(Source: Institute of Fiscal Studies)
The modelled impact on the net incomes of working-age families with children is
large, with average losses of more than 10% of net income for families in the
bottom two income deciles expected. This is equivalent to a cut in net incomes of
over £1,000 per year (in 2017-18 prices) for these families.
The impact is expected to be worse for families with children and no one in paid
work, with the average loss expected to be around £3,000 per year. Those working
with low earnings and entitled to tax credits (or Universal Credit) are expected to be
worse off by £2,500 per year. In contrast households with children who are in-work
and not claiming benefits are expected to be a marginal £100 worse off per year,
10
Figures calculated in £ per year in 2017–18 prices.
11
This analysis includes a larger range of welfare and tax changes. For a full list of modelled policies
refer to Appendix A in the link below.
12
Hood, A. & Waters, T. (April 2017) ‘The impact of tax and benefit reforms on household incomes’,
IFS. Available at: https://www.ifs.org.uk/publications/9164
9It is important to note that many of the welfare policies changes will not create
immediate losses of benefit income because of protections for existing claimants.
4. Emerging short-term evidence of the impact of welfare policies
The main analysis of this paper is based on hypothetical case studies, which is the
only way to show the full impact of welfare policies by 2020/21. This is because of
the gradual nature of the rollout of these policies, some of which have only been in
force since April 2017 (such as the 2 Child Limit) or only affect new claimants. As
such the impact of these policies on real case studies is somewhat limited.
As part of preparation for this report, the Scottish Government approached the Child
Poverty Action Group (CPAG) to gain insight into the impacts of policies on real
families in Scotland being affected by some of the reforms outlined in section 2.2.
CPAG provided the following examples, taken from case studies submitted to CPAG
in Scotland's Early Warning System13 by frontline workers who have direct contact
with families affected by welfare reform.
4.1 The impact of the lower Benefit Cap
The lower Benefit Cap was introduced from November 2016, and as of February
2017 there were 3,705 households affected by the benefit cap losing an average of
£57 per week14. The following cases indicate the real impact that the Benefit Cap is
having on the quality of life for children in these families.
Case A – A lone parent with four children
A lone parent with four children under the age of 10 has had her housing
benefit reduced from £96.88 to 50p per week following the implementation of
the lower Benefit Cap. She has been awarded a Discretionary Housing
Payment but only until the end of the financial year after which she does not
know if she will need to make a new application. Client already struggles to
buy fresh and healthy food for her children and has had to cancel her internet
subscription which has limited the children's access to information for school
projects.
Case B – A couple with three children
A family containing two adults and three children are affected by the Benefit
Cap. They live in a rural area and struggle with a higher cost of living, as the
cost of basics are already more expensive including heating and food. The
family run a car to allow the family to get about. The family are quite isolated
in the area and the house is very poor. The children attend clubs to give them
a social life and make friends. The Benefit Cap means that the children either
need to stop attending the clubs or the rent will not get paid.
13
The Early Warning System monitors the impact of changes to the social security system on
children, their families and the communities that support them.
14
Source - DWP Stat-Xplore
104.2 The impact of the 2 child limit (Tax Credits and Universal Credit)
The 2 child limit in Tax Credits and Universal Credit has been in place since April
2017. Whilst very few families are currently affected15, as the policy applies to new
births and new UC claims, CPAG are already receiving some cases where the limit
has been applied.
Case C – A couple living with 2 children and expecting a third child
A client has two children and is pregnant with her third child. She wanted to
start a family with her new partner and believed that she would be exempt from
the two child limit because her first child was born when she was 15 and would
therefore be classed as statutory rape. However the exemption for children
conceived without consent does not apply to the child that is about to be born
and therefore the family will be subject to the two child limit.
Case D – A kinship carer with 2 children and looking after a further 2
children
A kinship carer with two children of her own provides kinship care for one child
and has recently taken on kinship care of another child, who was born after 6
April 2017. This situation is not covered by the two child limit exemption and
therefore child tax credit is not payable for the fourth child on the household.
15
HMRC have not published any statistics showing the number of families affected. Once fully rolled
out the policy could affect up to 50,000 households.
115. Long-term impact on households - illustrative case studies
5.1 Methodology
Each illustrative case study has been chosen to highlight the different impacts of
welfare policies on various family types. In each case study the net income (from
benefit entitlement and earned income) of each family in 2020/21 is estimated. This
is done by using the Tax and Benefits of Scottish Households (TABOSH) model,
which is capable of calculating the income of households taking into account income
tax, national insurance contributions and benefit entitlement under both legacy and
UC systems.
Two scenarios are modelled in each case study. The first scenario assumes that all
welfare policy changes, income tax threshold changes and minimum wage policy
changes passed in the 2015-17 parliament are applied. The second ‘counterfactual
scenario’ assumes the welfare system, income tax thresholds and minimum wage
uprating policy remains unchanged, with none of the 2015-17 parliament policies
being applied16.
The net income for a given case study is then calculated under both scenarios. The
difference between both income figures represents the reduction in the amount each
family could have been entitled to in 2020/21 had UK welfare policies not been
enacted.
5.2 Assumptions
For reasons of simplicity in presenting this analysis and because the report focuses
on changes in net income by 2020/21, it is assumed that, in all cases, families are
receiving Universal Credit and not legacy benefits or tax credits that UC is replacing.
Full Service rollout of UC is expected to be complete by September 2018, which
means that all Jobcentre Plus offices are expected to offer UC to all new claims by
that date. Managed migration of existing legacy benefit claimants will start once Full
Service rollout is complete, with all cases expected to be migrated to UC by March
2022.
The analysis disregards the Council Tax Reduction scheme. This is not a social
security benefit, but is likely to be received in full by all case study families, mitigating
their council tax liability.
The analysis assumes that housing costs of each family are below the Local Housing
Allowance rate their Broad Rental Market Area17. This means that these households
will be largely unaffected the housing related welfare changes passed since 2015/16.
These welfare changes will be the subject of a future report on the impact of welfare
policies related to housing. In each case study it is also assumed that each case
study family are renters rather than owner-occupiers.
16
To note - the decision of the Scottish Government to freeze the higher threshold is applied in both
scenarios, but does not affect the overall financial position of case study families.
17
This is based on an average LHA rate across all Broad Rental Market Areas. Therefore, in some
areas the assumed rate may be slightly above the relevant LHA rate.
12The analysis does not take into account any Transitional Protection payments .
Transitional Protection (TP) is an extra 'transitional' amount which tops up a
household’s Universal Credit award so that the households is not worse off
immediately when migrated to Universal Credit compared to their entitlement under
legacy benefits. These payments are only for cases which are ‘managed migrated’, a
process which will not commence until June 2019. Households such as those in the
case studies outlined in this report may be entitled to a TP payment18.
The analysis also disregards entitlements to childcare elements of UC. Under
Universal Credit families with children may claim 85% of their childcare costs up to a
maximum of £646 per month for one child and £1,108 per month for 2 or more
children. This policy was part of UC package, brought in before 2015. Childcare cost
arrangements are more generous than those under the legacy system, however,
since this analysis does not compare families situations between UC and legacy
benefits it is less relevant to include in the analysis.
Further to the above simplifications, to carry out this analysis a number of
assumptions are made about the future economic variables such as the CPI inflation
rate used to uprate benefits and the level of the National Living Wage by 2020/21. A
full list of economic assumptions is provided in Annex A, which are in line with the
latest OBR projections.
Technical details of how the Poverty Thresholds were calculated for each of the case
studies are provided in Annex B.
18
Note – for more information on Transitional Protection Payments see the following link
(http://revenuebenefits.org.uk/universal-credit/guidance/entitlement-to-uc/transitional-protection/)
136. Case study 1 – Out of work lone parent with 3 children (Ms P)
Case study 1
Ms P lives with her three children in a 3 bedroom house. Her rent is £125 per week.
Ms P claims Universal Credit and Child Benefit and does not work due to childcare
duties. As a result of welfare policy changes, she is not entitled to an additional UC
child element for her youngest child, as her youngest daughter was born after April
2017. Her youngest daughter turned 2 in 2020.
Total Net Income (2020/21) without welfare policies – £23,285
Total Net Income (2020/21) with all welfare policies - £19,205
18%
£4,080 less in Net
lower Income per year
6.1 The impact of welfare policy on Ms P
Around 4,900 out-of-work lone parents claimed Income Support or Universal Credit
(as at February 2017)19.
As a result of welfare policy changes introduced since 2015/16, Ms P and her family
would be worse off by around £78 per week or around £4,080 per year by
2020/21 compared to what her income would have been without the changes in
policy. This represents an almost 18% reduction in what Ms P and her family
could have been entitled to in 2020/21 had UK these policies not been enacted.
The most significant impact comes from the removal of the UC child element for Ms
P’s youngest child, which equates to a loss of £2,836 per year, around 70% of the
total reduction (see figure 3). The family would also be expected to lose around
£1,245 per year due to the four year freeze of Universal Credit elements (£1,040 per
year) and Child Benefit (£205 per year) based on latest forecasts of future inflation.
Because Ms P is unable to work due to childcare duties, she has no earnings, so her
total net income is only affected by welfare policies and not by changes to the
National Living Wage. In addition, it is assumed that Ms P has not made a new claim
to Universal Credit, but was migrated over from legacy benefits, and is therefore still
entitled to the family element (or eldest child element in UC) worth £556 per year.
19
This is the latest data available for Income Support (Source DWP Stat-Xplore). Around 1,200 lone
parents households claimed UC in February 2017 in Scotland. DWP data on the number of children in
these families is not published, although the number with 3 children is likely to be small. In August
2014 (before UC rollout), around 20% of households claiming Income Support (5,200 in total) had
three or more children.
14Figure 3 – Change in annual benefit entitlement due to welfare policy changes
by 2020/21 (Case Study 1)
Analysis of future poverty thresholds (see figure 4) suggests that the poverty
threshold (before housing costs) for this household in 2020/21 would be around
£22,000 per year. This means that, on a before housing cost basis, welfare policies
will cause Ms P and her family to have an income below the poverty line by
2020/21.
Figure 4 – Net incomes (with and without welfare policies) against relevant
poverty thresholds by 2020/21 (Case Study 1)
15Alternatively, on an after housing cost basis, Ms P’s net income places her below the
poverty line in both scenarios. However, the impact is still significant in terms of
distance from the poverty threshold on both measures. Without welfare policy
changes Ms P’s income is just 5% lower than the relevant poverty threshold,
whereas with welfare policy changes Ms P’s income is 28% lower.
6.2 The effect of the Benefit Cap on Ms P
Although lone parent families with three children make up 30% of those currently
affected by the Benefit Cap20, increasingly by 2020-21 three child families (such as
Ms P) will not be affected by the Benefit Cap. This is because the removal of the
child element for the 3rd child means Ms P is only entitled to £19,205 per year, which
is less than the new Benefit Cap level of £20,000 per year.
If Ms P was not affected by the 2 child limit, she would be affected by the Benefit
Cap instead. In this scenario, Ms P would still be around £3,230 per year worse off21
compared to a scenario with no welfare policies. This shows that whilst the Benefit
Cap currently disproportionality affects lone parent households, when the full
effects of the 2 child element and removal of the family element are in place,
this will no longer be the case. Instead the Benefit Cap is more likely to affect
households with high housing costs – this shall be explored more in a future paper
on the effect of post 2015 welfare policy changes related to housing.
6.3 The effect of moving into work for Ms P
The analysis above assumed that Ms P would not change her behaviour and so
continue to claim Universal Credit and Child Benefit for her three children and not
move into employment.
Due to childcare duties, it is unlikely that Ms P could fit work around looking after her
three children. For example, DWP current guidance22 on conditionality states that
those with a child under 3 years of age are not expected to be in work immediately.
Although it should be noted that families are lone parents are still affected by the
Benefit Cap with the implementation of the Benefit Cap to those with children
under 3 being the subject of an on-going High Court case23.
However, suppose that Ms P was able to work flexibly for around 10 hours per week.
Assuming that she receives the National Living Wage, the increase in earnings is not
sufficient to compensate for the impact of reductions in benefit generosity introduced
since 2015.
When Ms P moves into part-time work, her net earnings are £4,563 per year if she is
paid the National Living Wage (assumed to be £8.75 in 2020/21) and her benefit
entitlement (Universal Credit and Child Benefit) falls to £17,785 per year due to the
20
If Ms P was in receipt of legacy benefits currently, her benefit income would be subject to the cap.
21
£23,286 – £20,055 = £3,230
22
DWP (July 2015) ‘Welfare Reform and Work Bill: Impact Assessment of the change in conditionality
for responsible carers on Universal Credit’
23
On 22 June a High Court judge ruled that the Benefit Cap on lone parents of children under two
was unlawful and discriminatory. DWP have indicated they will seek to appeal the decision.
16tapering of the UC award. Although she is significantly better off in work , compared
to her net income had no welfare policies been passed, she is still £940 per year
worse off.
This means that despite Mrs P working 10 hours per week, she is not able to
make up the loss from the benefit freeze and the 2 child limit. This is before the
additional cost of childcare, travel expenses and other work related expenses are
considered for this family.
Figure 5 shows the total net income of Ms P in three scenarios:
1. None of the 2015/16 welfare policies or changes to income tax thresholds or
the National Living wage are implemented and MS P does not work any hours.
In this case, by 2020/21 Ms P’s net income is around £23,290.
2. All 2015/16 welfare policies and other changes are implemented and Ms P
does not work. In this case, by 2020/21 her income is around £19,200
3. All 2015/16 welfare policies and other changes are implemented and Ms P
does work around 10 hours per week. In this case, by 2020/21 her income is
around £22,350.
Figure 5 – The impact on net income of Ms P moving into employment
compared to alternative scenarios
177. Case study 2 – In work couple with 2 children (Mr and Mrs G)
Case study 2
Mr and Mrs G live with their 2 children (a boy aged 12 and a girl aged 9) in a 3
bedroom house. Their rent is £125 per week.
Mr and Mrs G have started a new claim to Universal Credit in 2020, after Mr G
became unemployed. Mrs G continues to work part-time (16 hours) and receives
Child Benefit for her two children. As a result of welfare policies, the family is not
entitled to the higher child element for the first child (the equivalent of the family
element).
Total Net Income (2020/21) without policy changes – £25,830
Total Net Income (2020/21) with all policy changes - £24,300
6%
lower £1,540 less in Net
Income per year
7.1 The Impact of Welfare policy on Mr and Mrs G
There were 87,000 in work couple families with children in Scotland who claimed Tax
Credits in 2015/16, with approximately 36,00024 of these families having two
children. As Universal Credit rolls out, these families will transition on to the new
benefit.
As a result of welfare policy changes introduced since 2015/16, Mr and Mrs G and
their family would be worse off by around £30 per week or around £1,540 per
year by 2020/21. This represents almost a 6% reduction in what Mr and Mrs G and
their family could have been entitled to in 2020/21 had these policies not been
enacted.
Unlike in case study 1, the fact that Mrs G is in-work means that analysis of how
worse off the family are due to welfare policies has to take account of the impact on
earnings as well as benefits (see section 2).
Figure 6 shows that, due to the more generous level of the National Living Wage,
Mrs G could earn around £830 more in 2020/21. However, this increase in
outweighed by the fall in benefit entitlement.
24
Note – HMRC statistics do not show family types (couple/lone parent) by the number of children at
a Scotland level. At a GB level 41% of in-work couples with children claiming Tax Credits have two
children.
18Taking into account the increase in the taper rate (which would have marginally
increased the UC award) the cut to UC work allowances and the freeze of UC
standard and child elements means that it is estimated that the family’s UC
entitlement will fall by over £1,140 per year. UC entitlement falls a further £526 due
to the fact that Mrs G’s earnings increase over both scenarios, which reduces the
amount of UC award25. Further losses of benefit come from the removal of the family
element (£556 per year) and the freeze to Child Benefit (£150 per year).
Figure 6 - The change in benefit entitlement, earnings and net income for Mr
and Mrs G due to welfare policies.
Analysis of future poverty thresholds (see figure 7) suggests that the poverty
threshold (before housing costs) for this household in 2020/21 would be around
£24,300 per year. This means that, on a before housing cost basis, the
implementation of welfare policies mean that Mr and Mrs G’s income will just sit at
the poverty line by 2020/21, compared to being £1,540 above the poverty line in the
no welfare policy scenario.
Alternatively, on an after housing cost basis, Mr and Mrs G’s net income places their
family below the poverty line in both scenarios. However, the impact is still significant
in terms of distance from the poverty threshold in both scenarios. Without welfare
policy changes Mr and Mrs G’s income is just 7% lower than the relevant poverty
threshold, whereas with welfare policy changes Ms P’s income is 15% lower.
25
£526 is 63% of the £834 increase in household earnings.
19Figure 7 – Net incomes (with and without welfare policies) against relevant
poverty thresholds by 2020/21 (Case Study 2)
7.2 The Impact of the Benefit Cap on Mr and Mrs G
The Benefit Cap is not applied when the households earns no less than a given
income threshold. Under Universal Credit this earnings threshold is calculated as 16
hours at the National Living Wage. Therefore, by 2020/21, it is estimated that the
Benefit Cap earnings threshold will be £144.80 per week or £7,550 per year. In
section 7.1, Mrs G earned exactly this amount and was therefore exempt from the
Benefit Cap.
The Benefit Cap tends to disproportionately affect families with a lot of children and
high housing costs. Since Mr and Mrs G only have two children and their housing
costs are modest (below the LHA rates for their property type in their area), then
even if Mrs G earned below the earnings threshold, this particularly family will not be
affected significantly by the Benefit Cap.
20Figure 8 - The impact on net income of Mrs G losing employment and the
Benefit Cap applying to the household
Figure 8 shows the impact of the Benefit Cap on the net income of the family when
Mr G does not work:
1. None of the 2015/16 welfare policies or changes to income tax thresholds or
the National Living wage are implemented and Mrs G works 16 hours. In this
case, by 2020/21 Ms P’s net income is around £25,385.
2. All 2015/16 welfare policies and other changes are implemented and Mrs G
works 16 hours. In this case, by 2020/21 her income is around £24,298
3. All 2015/16 welfare policies and other changes are implemented and Mrs G
does not work. In this case, by 2020/21 her income is around £20,055. The
household loses around £100 per year due to the Benefit Cap.
218. Case study 3 – In work couple with 4 children (Mr and Mrs C)
Case study 3
Mr and Mrs C live with their four children (aged 16, 15, 13 and 10) in a 4 bedroom
house. The family currently rent a 4 bedroom property for £175 per week. Mr C has
a zero-hours contract, but on average works around 20 hours per week. Mrs C also
works two days per week (12 hours). Both earn at the National Living Wage.
The family have always claimed a combination of Tax Credits and benefits. They
currently claim Universal Credit and Child Benefit. Because all of their children
were born before April 2017 they are entitled to four child elements under Universal
Credit.
Total Net Income (2020/21) without policy change – £38,410
Total Net Income (2020/21) with all policy changes - £37,280
3% £1,130 less in Net
lower Income per year
7.1 The impact of welfare policy on Mr and Mrs C
In 2015/16 there were around 8,000 in work households in Scotland with 4 or more
children claiming Working Tax Credits and Child Tax Credits. In GB as a whole,
around 80% of families are couples, rather than lone parents26.
As a result of welfare policy changes introduced since 2015/16, Mr and Mrs C and
their family would be worse off by around £22 per week or around £1,130 per
year by 2020/21. This represents almost a 3% reduction in what the family could
have been entitled to in 2020/21 had UK welfare policies not been enacted.
Although Mr and Mrs C have 4 children, they are not affected by the removal of the
family element or the 2 child limit because all of their children were born before April
2017 and they did not make a new claim to Universal Credit but wee migrated over
from legacy benefits.
Due to the freeze to Universal Credit elements, the reduction in the UC work
allowance and the change in the taper rate, the family is around £1,468 per year
worse off compared to a scenario where no welfare policies are applied. The family
loses an additional £264 per year due to the freeze in Child Benefit. Due to the rise
in the National Living Wage, the family does earn around £1,625 more per year,
26
HMRC statistics do not show family types (couple/lone parent) by the number of children for
Scotland. GB level statistics show that 83% of in-work households with 4 or more children claiming
Tax Credits are couples, rather than lone parents.
22however £1,024 per year (63%) of this is lost due to the corresponding reduction of
the UC award27. Overall, the family loses around £1,130 per year by 2020/21.
Figure 9 – Change in benefit income and net earnings due to welfare policies
by 2020/21 (Case Study 3)
Analysis of future poverty thresholds (see figure 10) suggests that the poverty
threshold (before housing costs) for this household in 2020/21 would be around
£35,700 per year. This means that, on a before housing cost basis, in both scenarios
Mr and Mrs C’s net income is above the poverty threshold.
27
Due to the uprating of the Personal Allowance to £12,500 by 2020/21 (compared to assumed
£11,000 in the no change scenario), part of the increase in net earnings is due to a lower amount of
Income Tax paid by the household.
23Figure 10 - Net incomes (with and without welfare policies) against relevant
poverty thresholds by 2020/21 (Case Study 3)
Alternatively, on an after housing cost basis, Mr and Mrs C’s net income places their
family below the poverty line in both scenarios. However, the impact is still significant
in terms of distance from the poverty threshold in both scenarios. Without welfare
policy changes Mr and Mrs C’s income is just 12% lower than the relevant poverty
threshold, whereas with welfare policy changes Mr and Mrs C’s income is 15%
lower.
8.2 The impact of Mr C losing employment – application of the Benefit Cap
Mr and Mrs C are exempt from the Benefit Cap because they earn £1,258 per
month, which is above the Benefit Cap minimum income threshold of £630 per
month28. The cap is set at £20,000 per year, which means if, for example, Mr C lost
his job and the family relied solely on Mrs C 12 hours of work per week (£5475 per
year), the family would lose a considerable amount of benefit income29.
Due to Mr C losing his job, and the fact that he was not able to find a replacement
within the 39 weeks grace period, the family’s net income falls by around £11,745
per year or around £225 per week (compare 2 and 4 in figure 11)30. However, this is
the combined effect of a drop in earnings due to Mrs C’s loss of employment and the
impact of the cap itself. The full impact of welfare policies only is shown in comparing
3 and 4 in figure 11.
28
Uprated to take account of the higher National Living Wage of £8.75 which is assumed in 2020/21.
29
It should be noted that Mr C would have up to 39 weeks to find alternative employment before
being subject to the Benefit Cap.
30
£37,275 - £25,530 = £11,745
24If Mrs C continues to only work 12 hours per week, then her family’s total net income
is £25,530 per year. This is compared to £30,921 had no welfare policies been
passed since 2015/16. In total this represents a reduction of £5,390 per year (a
21% reduction in net income).
Figure 11 - The impact on net income of Mr C losing employment and the
Benefit Cap applying to the household
Figure 11 shows the impact of the Benefit Cap on the net income of the family when
Mr C loses his employment. Four scenarios are presented:
1. None of the 2015/16 welfare policies or changes to income tax thresholds or
the National Living wage are implemented, Mr C and Mrs C work a combined
32 hours per week and are not subject to the Benefit Cap. By 2020/21 the
family’s income is Ms P’s net income is around £38,406 per year.
2. All 2015/16 welfare policies and other changes are implemented, Mr and Mrs
C work a combined 32 hours per week and are not subject to the cap. By
2020/21 her income is around £36,719 per year.
3. No 2015/16 welfare policies or other changes are implemented, but Mr C does
not work and only Mrs C only works 12 hours. They are subject to the old
Benefit Cap (£26,000 per year), with household income being topped up by
earnings to £30,921 per year.
4. All 2015/16 welfare policies and other changes are implemented, but Mr C
does not work and only Mrs C only works 12 hours. They are subject to the
new lower Benefit Cap and the household income is £25,530 per year.
25Technical Annex A – Assumptions in the TABOSH model and CPI assumptions
Table A1 – Assumptions for main parameters in TABOSH model
Main Parameters Counterfactual Scenario
Minimum Wage/National Living Wage (per hour) £7.75 £8.75
Personal Allowance in 2020/21 (annual) £11,000 £12,500
Weekly Benefit Cap (Single, no children) £350 £258
Weekly Benefit Cap (Couples, with children) £500 £385
UC Taper rate 65% 63%
Work Allowance for Universal Credit (per month)
Single person, no children £111 £0
Housing
Costs
With
Couple, no children £111 £0
Couple, with children £222 £192
Lone parent £263 £192
Single person, no children £111 £0
Housing
Without
Costs
Couple, no children £111 £0
Couple, with children £536 £397
Lone parent £734 £397
Table A2 – Consumer Price Index Assumptions
Year Rate
2015/16 -0.1%
2016/17 1.0%
2017/18 2.6%
2018/19 2.2%
2019/20 2.0%
2020/21 2.0%
(Source: Office for Budget Responsibility)
26Technical Annex B – Poverty Analysis
Poverty and income statistics are regularly published by the Scottish Government31
and the methodology underpinning these is used to calculate the net income poverty
thresholds for each case study.
Poverty is measured at the household level. If household income is below the poverty
threshold, all people within the household are in poverty. This is based on the
assumption that income is shared equally across all members of the household, and
they have the same standard of living.
The poverty threshold is usually presented as an equivalised income figure.
Equivalisation adjusts income for household size and composition by means of
equivalence scales, to reflect the extent to which households of different size and
composition require a different level of income to achieve the same standard of living.
This adjusted income is referred to as equivalised income. In this analysis, the poverty
threshold has been unequivalised so that the appropriate threshold for that household
type is used. This is done in order to determine whether a case study household
would be in or out of poverty, which is presented in figures 4,7 and 10.
In terms of the specific analysis for this report, a number of simplifications and caveats
apply to the figures in table B1, The projections of poverty thresholds to 2020/21 are
based on Institute of Fiscal studies projections32 of real terms median incomes before
and after housing costs, which are then converted into nominal prices using CPI so
that they are broadly comparable with net incomes in 2020/21. There is also some
difference in what elements of income are included in the case studies and those used
by the IFS (for example, the case studies exclude council tax reduction and the
calculation of housing costs is based solely on rent and excludes some other
elements).
Table B1: Poverty thresholds for each case study household (before and after
housing costs), 2020/21
31
Scottish Government (March 2017) ‘Poverty and Income Inequality in Scotland: 2015/16’. Available
at: http://www.gov.scot/Publications/2017/03/2213/0
32
Institute of Fiscal Studies (March 2017) ‘Living standards, poverty and inequality in the UK: 2016–
17 to 2021–22’. Available at: https://www.ifs.org.uk/publications/8957
27© Crown copyright 2017
This publication is licensed under the terms of the Open Government Licence v3.0 except
where otherwise stated. To view this licence, visit nationalarchives.gov.uk/doc/open-
government-licence/version/3 or write to the Information Policy Team, The National
Archives, Kew, London TW9 4DU, or email: psi@nationalarchives.gsi.gov.uk.
Where we have identified any third party copyright information you will need to
obtain permission from the copyright holders concerned.
This publication is available at www.gov.scot
Any enquiries regarding this publication should be sent to us at
The Scottish Government
St Andrew’s House
Edinburgh
EH1 3DG
ISBN: 978-1-78851-196-4 (web only)
Published by The Scottish Government, September 2017
Produced for The Scottish Government by APS Group Scotland, 21 Tennant Street, Edinburgh EH6 5NA
PPDAS285386 (09/17)
w w w . g o v . s c o tYou can also read