IMPACT REPORT BERENBERG SUSTAINABLE EURO BONDS - BERENBERG WEALTH AND ASSET MANAGEMENT
←
→
Page content transcription
If your browser does not render page correctly, please read the page content below

BERENBERG WEALTH AND ASSET MANAGEMENT

IMPACT REPORT

BERENBERG
SUSTAINABLE EURO
BONDS

September 2021
Berenberg
Established in 1590, today Berenberg is one of the leading private banks and one of
the most dynamic banks in Europe. Our business is based on client focus, respon-
sibility, first-class knowledge and solution-oriented thinking. Our Wealth Manage-
ment, Asset Management, Investment Banking and Corporate Banking divisions
offer solutions for private and institutional investors, companies and organisations.

CONTACT:
Alina Finkmann
Wealth and Asset Management
Joh. Berenberg, Gossler & Co. KG
Alina.Finkmann@berenberg.com
Contents
Foreword ......................................................................................................................... 1

Impact Spotlights ............................................................................................................ 2

Impact at Berenberg — An Introduction ........................................................................ 4
    The Baseline: ESG Integration ..................................................................................................................4
    Inducing Positive Change via Active Ownership .........................................................................................4
    The Value Add: Our approach to Impact..................................................................................................5

Berenberg Net Impact Model — Our Methodology ....................................................... 6

Demography & Health.................................................................................................. 10
    The Challenge of Demography & Health ................................................................................................ 10
    Contributing to the Solution — Our Portfolio Holdings ......................................................................... 10
    A Case Study — Wellcome Trust .......................................................................................................... 11

Climate Change ............................................................................................................. 12
    The Challenge of Climate Change ........................................................................................................... 12
    Adding to the Solution — Our Portfolio Holdings ................................................................................. 12
    A Case Study - Ørsted ........................................................................................................................... 14

Sustainable Growth & Innovation ................................................................................. 15
    The Challenge of Sustainable Growth and Innovation ............................................................................. 15
    Contributing to the Solution — Our Portfolio Holdings ......................................................................... 15
    A Case Study - CaixaBank ................................................................................................................... 17

Responsible Use of Resources ...................................................................................... 18
    The Challenge of a Responsible Use of Resources ..................................................................................... 18
    Contributing to the Solution — Our Portfolio Holdings ......................................................................... 18
    A Case Study — Xylem ........................................................................................................................ 19

The Sustainable Development Goals ............................................................................ 20

Additional ESG and Impact-related Information.......................................................... 22

Outlook ......................................................................................................................... 28

Appendix – Methodology .............................................................................................. 30

Disclaimer ..................................................................................................................... 31
Foreword Generating measurable positive impact on society and the environment – this is what we look for in companies and issuers when investing for our im- pact-focused investment funds. We live in a time where we face massive economic, social, and environmental chal- lenges. This includes finite resources, a growing world population, increasing ine- quality and climate change. With the rise of these challenges, we recognise and ap- preciate clients’ desire to use their investments as a tool to facilitate solutions to these issues. Therefore, we consider ESG aspects to be one of the key factors in our investment decision-making. By considering ESG factors, we are able to identify and monitor risks arising from controversial business practices as well as identifying responsible and sustainable business models with good corporate governance. In addition, through our active dialogue, we encourage and support companies and issuers in meeting their responsibilities towards society and the environment. In our impact-focused investment funds, we complement the integration of ESG factors with the inclusion of companies and issuers that help to solve global chal- lenges with their products and services. These funds invest in companies and issuers whose business models or dedicated projects create added value for the environ- ment and society based on structural growth trends and sustainable profitability, both in terms of its nature and longevity. This added value – the impact – is what we aim to showcase with this report. We have developed a proprietary approach to measure impact by which we capture the positive effect as well as potential negative externalities that our invested portfolio holdings generate. This is the first year in which we publicly report on our findings based on our proprietary impact approach and, going forward, we will update the report annually. Matthias Born Dr Rupini Deepa Rajagopalan Co-Head Wealth and Asset Management Head of ESG Office Berenberg Wealth and Asset Management Berenberg Wealth and Asset Management 1 Joh. Berenberg, Gossler & Co. KG
Impact Spotlights 1
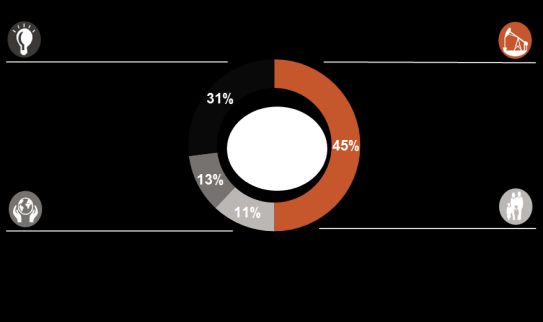
The Four Global Challenges
Via its products or services, every portfolio position contributes to the solution of one of the four
defined global challenges within our impact framework.
13 % Demography & Health
of portfolio positions • Motability provides 635,000 customers with disabilities ac-
address this challenge cess to affordable, worry-free mobility solutions, thereby im-
proving social inclusion
Responsible Use of Resources
11 % • Xylem’s solution prevented more than 7bn cubic meters of
of portfolio positions polluted water from entering local waterways
address this challenge • In 2020, Veolia recycled 391,000 tons of plastic in transfor-
mation plants and treated 5.2bn m3 of wastewater
Sustainable Growth & Innovation
29 % • Proceeds of CaixaBank’s social bond contributed, among oth-
of portfolio positions ers, to the creation of 8,207 jobs in Spain
address this challenge
• Proceeds of Cassa Depositi’s social bond were invested in
235 social housing projects, with an estimated impact of 4,226
additional social housing units and 1,788 assisted living beds
45 % • Climate Change
of portfolio positions • The ERG green bond financed 476MW of renewable energy
address this challenge capacity, leading to estimated CO2 savings of 261,000 tons in
2020
• Ørsted plans to double its offshore wind capacity by 2025 -
enough clean energy to power more than 30m people
The Berenberg Net Impact Score
Via the Berenberg Net Impact Model application, we obtain a Net Impact Score at the portfolio level,
which can range from -3 to 3. A score higher than 0 indicates a net positive impact in relation to the
four defined global challenges. 0
-1 1
-2 2
-3 3
1,9
⎯⎯⎯⎯⎯
1
The Berenberg Net Impact Model is applied to the portfolio as of March 31st 2021. All graphic representations are our own.
2 Joh. Berenberg, Gossler & Co. KGThe ABC Model
Within the classification scheme of the ABC model by the Impact Management Project (IMP)2, we
evaluate the criticality of companies’ or issuers’ solutions and classify them into the categories “Act
to avoid harm” (A), “Benefit stakeholders” (B) and “Contribute to solutions” (C), with C being the
category generating the strongest impact.
Contribute
to solutions
Benefit stake-
holders
Act to 51% of portfolio
avoid harm
34% of portfolio holdings
13% of portfo- holdings
lio holdings
The Sustainable Development Goals
We map our portfolio holdings according to their contribution to ten of the most investible Sustaina-
ble Development Goals by the United Nations. More information on the SDGs can be found in the
dedicated SDG chapter.
25%
20%
Share of the portfolio in %
15%
10%
5%
0%
SDG 2 SDG 3 SDG 4 SDG 6 SDG 7 SDG 8 SDG 9 SDG 11 SDG 12 SDG 13
⎯⎯⎯⎯⎯
2
See “IMP – A Guide to Classifying the Impact of an Investment”, available at https://impactmanagementproject.com/impact-manage-
ment/how-enterprises-manage-impact/.
3 Joh. Berenberg, Gossler & Co. KGImpact at Berenberg — An Introduction At Berenberg Wealth and Asset Management, our impact-focused investment funds apply a holistic approach to sustainability, and we combine several investment pro- cess elements to provide a sound approach to impact. Firstly, we integrate strong ESG aspects in our investment process via exclusions and analysis. Secondly, we make use of active ownership activities such as engagement. Finally, as an additional step exclusive to our impact-focused strategies, we apply an impact framework. The following sections go into further detail. The Baseline: ESG Integration As a solid foundation, our impact-focused investment funds use ESG integration tools such as exclusions, screening and ESG analysis. Generally, we recognise that the integration of ESG helps our portfolio management to adequately analyse risks and returns. We incorporate ESG criteria by analysing ESG risks and opportunities using our own research and via third-party providers. The open dialogue between our investment and ESG professionals allows us to integrate their industry experi- ence and knowledge into our ESG approach and to develop and strengthen it con- tinuously. In addition to our standard ESG exclusions, which apply to the entire Berenberg Wealth and Asset Management platform3, the impact-focused invest- ment funds apply additional exclusion criteria in order to further mitigate the risk of potential adverse effects and to avoid clear negative impact investments. For more information, see our ESG Policy and our Exclusion Policy, which is available at www.berenberg.com/esg. Inducing Positive Change via Active Ownership Active ownership activities such as direct company engagement are part and parcel of our ESG and impact-focused approach and key tools in understanding company behaviour when it comes to sustainability issues. Having an open dialogue with companies and other issuers encourages transparency and allows us to gain better insights. We regularly engage with companies and consistently monitor our engage- ment results. Through our engagement, we are not only able to make investment decisions in regards whether we buy, sell or hold – as an active investor, we also help to improve the sustainability profile of companies in the long term and reduce risks. We believe that our active ownership approach can create positive change in the issuer or company and can, ultimately, benefit society or the environment and help to overcome global challenges. For more information, see our Engagement Policy as well as our Active Ownership Report, which is available at www.beren- berg.com/esg. ⎯⎯⎯⎯⎯ 3 Further information on the application scope of our exclusions can be found in our publicly available Berenberg WAM Exclusion Policy, available at www.berenberg.de/en/esg. 4 Joh. Berenberg, Gossler & Co. KG
The Value Add: Our approach to Impact

For our impact-focused investment funds, we apply an additional impact frame-
work, which consists of targeting specified global challenges with our investments
as well as a proprietary impact measurement and analysis tool. We use this impact
approach to exclusively invest in portfolio holdings that generate a measurable pos-
itive impact on the environment and society.

Our impact approach has developed over time, reflecting our long-standing experi-
ence within this segment. Apart from continuously monitoring ongoing market de-
velopments, we conduct our own studies and compose white papers on relevant
ESG- and impact-related topics, which has helped to form our approach and con-
firmed our impact-related perspectives. We strive to further evolve our approach
and do not shy away from challenging our views.

Confirmed by the findings of our study4 from 2018 and its update from 20215, we
identified the United Nations’ Sustainable Development Goals (SDGs) that are in-
vestible as well as important. Based on these findings, we developed a set of four
key global challenges, namely:

     ❖    Demography & Health;
     ❖    Climate Change;
     ❖    Sustainable Growth & Innovation; and
     ❖    Responsible Use of Resources

These four challenges are at the heart of our impact framework and every portfolio
holding in our impact-focused investment funds undergoes in-depth impact analy-
sis, within which we assess the portfolio holdings’ contributions to the respective
challenges. We also map them to the Sustainable Development Goals based on their
contribution.

A further aspect within our impact-related framework is the development of a pro-
prietary Berenberg Net Impact Model, in which we holistically analyse and assess
the positive as well as potentially negative impact of our portfolio holdings. We
discuss the details and methodology in the next chapter.

 ⎯⎯⎯⎯⎯
4 See Berenberg ESG Office Study on the SDGs “Understanding the SDGs in Sustainable Investing”, available at
  www.berenberg.de/en/esg
5 See Berenberg Wealth & Asset Management Study “Berenberg ESG Survey: Exploring investor sentiment”, available

  at www.berenberg.de/en/esg

5 Joh. Berenberg, Gossler & Co. KG
Berenberg Net Impact Model — Our Methodology
We use our proprietary Berenberg Net Impact Model to comprehensibly quantify
the positive and potentially negative impact that our portfolio holdings generate in
relation to the four defined global challenges of Demography & Health, Climate
Change, Sustainable Growth & Innovation and Responsible Use of Resources. We
defined specific measures in the positive as well as the negative impact space, with
which we aim to holistically capture the net impact of our portfolio holdings. For
each holding, every impact measure is analysed individually and given a score, which
is summed up at the issuer or company level and finally aggregated at the portfolio
level. These scores are based on quantitative and qualitative measures.
Positive Impact Measures Negative Impact Measures
(scale 0 to 3) (scale -3 to 0)
Contro- Lack of
Strategy versial Trans-
Impact Carbon
Stage of & Behavior &
parency
Expo- Assess-
Solutions Credi- Business
sure Involve- ment and
bility Dialogue
ment
=
Berenberg Net Impact Score (scale 3 to -3)
The positive impact measures do not only capture the contribution of the business
model to one of the four global challenges, but also consider the stage of impact as
well as the company’s strategy and credibility. In our view, this provides a more
holistic and forward-looking view on a company’s positive impact. Within specified
assessment frameworks for each pillar, we award scores between 0 and 3.
❖ The pillar Impact Exposure quantifies the extent to which a portfolio holding ad-
dresses one of the four global challenges via its product and service offering.
The measure relies on several financial metrics such as revenue exposure to one
of the global challenges, and accounts for adjustments that capture future-ori-
entated efforts such as R&D spending, capex investments and sector-specific
key performance indicators.
❖ The pillar Stage of Solutions integrates the ABC approach as defined by the Impact
Management Project (IMP)6. The criticality of a company’s or issuer’s solutions
are analysed and classified into the categories “Act to avoid harm” (A), “Benefit
stakeholders” (B) and “Contribute to solutions” (C), with C being the category
generating the strongest impact.
⎯⎯⎯⎯⎯
6
See “IMP – A Guide to Classifying the Impact of an Investment”, available at https://impactmanagementpro-
ject.com/impact-management/how-enterprises-manage-impact/
6 Joh. Berenberg, Gossler & Co. KG❖ On a company level, the pillar Strategy & Credibility considers the depth and am-
bition of ESG-related commitments and targets as well as achieved perfor-
mance that underline the company’s credibility. In a forward-looking way, this
pillar seeks to capture how far companies have embedded their sustainability
and impact-related efforts into their cultures, their DNA and overall business
strategy. This measure relies on publicly available information regarding the
company’s sustainability key performance indicators
Similarly, the negative impact measures seek to quantify the negative externalities of
the issuer or company. Within specified frameworks, we award scores between -3
and 0.
❖ In the pillar Controversial Behaviour & Business Involvement we analyse (potentially)
existing controversial behaviour and conflicts as well as involvements in and
exposure to controversial business sectors and activities. The measure relies on
the data and analysis framework from our external data provider, which is com-
plemented with our own research as well as potential adjustments such as pro-
ductive engagement activities.
❖ The pillar Carbon Assessment quantifies and evaluates a company’s CO2 impact
as well as possibly existing countermeasures such as carbon reduction initiatives.
We rely on data from our external data provider and use publicly available com-
pany information. The specified framework for this measure accounts for
benchmark comparisons and sector-specific CO2 levels.
❖ The pillar Lack of Transparency & Dialogue assesses the overall level of company
transparency regarding ESG and impact data as well as openness to dialogue in
the context of engagement activities.
The result of the model application is a Net Impact Score in a range of -3 to 3,
whereas a score higher than 0 indicates a net positive impact in relation to the four
global challenges. The maximum Net Impact Score of 3 demonstrates a strong pos-
itive impact and no or sufficiently offset negative impact.
Within the fixed income segment, certain adjustments to the Berenberg Net Impact
Model presented above are required to capture the characteristics of fixed income
investments fully and correctly. For this purpose, we differentiate between:
1. regular bonds, for which the proceeds are not exclusively tied to specific
projects or assets and for which we consequently apply the model presented
above based on the issuer’s impact; and
2. use-of-proceeds bonds, such as green, social or sustainability bonds for
which we apply an adjusted model.
7 Joh. Berenberg, Gossler & Co. KGIn case of green, social and sustainability bonds (and similar structures), certain ad-
justments in the evaluation and scoring of the net impact are required. These bonds
are issued under dedicated frameworks that govern the exact use of proceeds and
include further requirements on their allocation and impact reporting. Investing in
a green, social or sustainability bond means that the investor is directly providing
funds to finance a specific environmentally or socially beneficial project – this may
include the financing of a new wind park or the development of a rare disease treat-
ment. Consequently, we incorporate the direct positive impact the investment in a
green, social or sustainability bond has into our scoring approach. This also implies
that the current impact of the issuer and its business model must be evaluated dif-
ferently. Particularly, green and sustainability bonds are often issued by companies
that we would describe as transition stories or as issuers that play a vital role in the
transition to a low-carbon economy. Therefore, the most relevant factor for these
issuers is not the impact they already have through their current business activities,
but the successful transition to being a more sustainable issuer, their future positive
impact as well as the direct impact we can have through the use-of-proceeds feature
of green, social and sustainability bonds.
Positive Impact Measures Negative Impact Measures
(scale 0 to 3) (scale -3 to 0)
Contro- Lack of
versial Tran-
Carbon
Issuer Bond Behavior sparen-
Assess-
Assessment Assessment & Busi- cy and
ness In- ment
Dia-
volve-
ment logue
=
Berenberg Net Impact Score (scale 3 to -3)
Consequently, the positive impact pillar is adjusted, and we assess and score the
issuer as well as the bond itself as below.
❖ The pillar Issuer Assessment only scores the strategy and credibility of the bond
issuer and neglects the (potential) current impact of the business model itself.
We focus on the sustainability strategy, transition ambitions and what role the
issued green, social or sustainability bond plays within the issuer’s overall busi-
ness activities and strategy.
❖ The pillar Bond Assessment evaluates the direct positive impact of the green, social
or sustainability bond that results from the financed projects and assets. We
focus on the actual value-add from the projects or assets (Impact Exposure), the
consistency and quality of the Bond Framework as well as the allocation and im-
pact reporting (Transparency & Impact Reporting). Additionally, we apply the ABC
8 Joh. Berenberg, Gossler & Co. KGapproach mentioned above to score the Stage of Solution that the specific projects
provide.
Similar to the presented standard model, we also include the negative impact and
externalities that the issuer of a green, social or sustainability bond may have on the
environment or society. Hence, the negative impact pillar (“Negative Impact
Measures”) always refers to the issuer and is identical to the negative impact meas-
urement we have already introduced.
Comprehensive and valid data is crucial to our Berenberg Net Impact Model. We
rely on publications from portfolio holdings and data from our external ESG data
provider. We additionally integrate information which we gather through our en-
gagement activities, from sell-side research or other relevant sources.
For our assessments and scoring methodology, we specify clear scoring frameworks
to arrive at objective and comprehensible scoring results. However, there remains a
discretionary part within the model for which we, at this point, cannot establish
specified and reasonable thresholds. We realise that this could be a potential short-
coming of the model, however, we also see benefits in establishing a methodology
which is not entirely rigid and thus able to reflect the unique opportunities or chal-
lenges in specific business models. We discuss our view on this and our envisioned
outlook for future developments in the “Outlook” section.
9 Joh. Berenberg, Gossler & Co. KGDemography & Health
The Challenge of Demography & Health
The United Nations’ Sustainable Development Goal 3 aims at improving the life-
long health and well-being of all people. Although major advances in medicine have
been made over the past decades, inequality regarding the healthcare levels of dif-
ferent countries remains high, and new challenges arise as the global population
becomes wealthier and lives longer. Similarly, the Goal of ending hunger and mal-
nutrition (SDG 2) persists and its hurdles change throughout the decades.
The trend is clear: The World Health Organisation estimates that the share of people
aged 60 years and older will rise from 12% in 2015 to 22% of the world’s population
in 2050.7 With it, typically age-related diseases such as cancer, dementia and cardio-
vascular diseases now represent the by far most common causes of death. Chronic
diseases such as type 2 diabetes and hypertension, which are often lifestyle-related,
are also on the rise.8 At the same time, medical treatments and innovations need to
be distributed more equally. Regarding nutrition, the United Nations estimates that,
in 2019, an estimated 2bn people did not have regular access to safe, nutritious and
sufficient food.9
Contributing to the Solution — Our Portfolio Holdings
In the face of these challenges, there is a strong need for innovative solutions, which
are of high quality but also affordable. Many companies have specialised in offering
exactly that. For example, new technologies in the space of pharmaceuticals and
data-driven solutions already contribute to a better understanding of diseases and
allow for more accurate diagnoses as well as personalised and potentially less inva-
sive treatments. Further, companies offering healthcare services and elderly care so-
lutions are important facilitators to overcome challenges, as are companies focusing
on healthy and environmentally sustainable nutrition.
Our portfolio positions10 11 addressing the challenge:
Amplifon Corporacion Andina (S) Danone (S) Essity
Grifols Icade Sante (S) Kerry LBBW (S)
Motability (S) Wellcome Trust
⎯⎯⎯⎯⎯
7 https://www.who.int/news-room/fact-sheets/detail/10-facts-on-ageing-and-health
8 https://ourworldindata.org/causes-of-death
9 https://www.un.org/sustainabledevelopment/hunger/
10 As of 31 March 2021
11 Supplements behind portfolio positions: (G) = Green Bond, (S) = Social Bond, (ST) = Sustainability Bond
10 Joh. Berenberg, Gossler & Co. KGA Case Study — Wellcome Trust
Company Overview
Wellcome Trust is a London-based independent charitable foundation dedicated to
improving health by funding research into biosciences and the development of
treatments, cures and diagnostics for a wide range of illnesses and diseases. Research
and advocacy are funded through the charity’s endowment of GBP29.1bn.12
Positive Impact
Wellcome Trust’s mission is to improve health through research. The charity di-
rectly funds scientists and researchers around the world to address fundamental
health challenges such as drug-resistant infections or mental health. Since 2017, the
charity has maintained an average funding level of cGBP900m pa for its core activ-
ities: supporting researchers, campaigning for public health issues and public en-
gagement. In the financial year 2019/2020, charitable expenditures amounted to al-
most GBP1.1bn. Recognising the value of international cooperation, Wellcome
Trust is actively partnering with communities, businesses, and organizations in more
than 70 countries with the goal to attract additional funding. Funded or initiated
projects include the development of an Ebola vaccine, the mapping of 30% of the
human DNA sequence (Human Genome Project) or the Covid-19 Therapeutics
Accelerator (CTA) to fund Covid-19 research, clinical trials and product develop-
ment. Through its activities and provision of substantial financial resources, the
charity has a material positive impact on global health and human well-being,
thereby contributing to our challenge of Demography & Health.
Potentially Adverse Impact
Given the type of its business activities, Wellcome Trust has a low carbon footprint
and no material negative environmental impact from its operations. The charity suf-
ficiently reports on relevant sustainability aspects. Additionally, Wellcome Trust
does not face controversies relating to problematic behaviour and is not involved
in any controversial business activities.
Summary
Berenberg Net Impact Score 3,0
Sustainable Development Goals 3
ABC Classification C
⎯⎯⎯⎯⎯
12
Based on Wellcome Trust’s Annual Report for the FY2019/2020: https://cms.wellcome.org/sites/de-
fault/files/wellcome-trust-annual-report-financial-statements-2020.pdf
11 Joh. Berenberg, Gossler & Co. KGClimate Change The Challenge of Climate Change Climate change is humanity’s greatest challenge. Its consequences pose risks for specific sectors, companies, and countries. These include physical risks caused by natural disasters and changing weather patterns as well as more frequent and more extreme weather events, but also so-called transition risks, which relate to the ability of companies to transition to low-carbon or climate-neutral business models. In addition to the direct impacts, progressive climate change and the associated global warming have potentially significant negative effects on the achievement of the United Nations Sustainable Development Goals. The report of the Intergovernmental Panel on Climate Change (IPCC) published in 2018 stresses the relevance of achieving the goal to limit global warming to 1.5°C, since the risks arising from climate change become even greater beyond this.13 An- nual greenhouse gas (GHG) emissions are now more than 50% higher than in 1990. While all countries experience the effects of climate change, countries that are not accountable for high emissions are often hit harder due to missing resources to withstand negative effects.14 Adding to the Solution — Our Portfolio Holdings We recognise our responsibility to contribute to the fight against climate change through our investment decisions and collaboration with our portfolio companies and other investors. We believe that the necessary transition to a low-carbon econ- omy also offers opportunities. For example, we welcome innovations in the renew- able energy and energy efficiency sectors. Especially in industrial applications or the real estate sector, these can induce meaningful positive change. Also, new technol- ogies that optimise the control and regulation of cooling systems in data centres or research in renewable natural gas positively contribute to mitigating climate change. ⎯⎯⎯⎯⎯ 13 See “Global warming of 1.5°C. An IPCC Special Report on the impacts of global warming of 1.5°C above pre-in- dustrial levels and related global greenhouse gas emission pathways, in the context of strengthening the global re- sponse to the threat of climate change, sustainable development, and efforts to eradicate poverty, available at: https://www.ipcc.ch/sr15/chapter/spm/ 14 https://ourworldindata.org/greenhouse-gas-emissions 12 Joh. Berenberg, Gossler & Co. KG
Our portfolio positions15 16 addressing the challenge:

 AIB (G)                      ALD (G)                      Generali (G)                   Banco Sabadell
                                                                                          (G)

 BFCM (G)                     Commerzbank (G)              CPI Property (G)               DeVolksbank (G)

 Digital Realty (G)           DNB (G)                      Drax                           Equinix (G)

 ERG (G)                      ESB (G)                      Eurogrid (G)                   Greenko (G)

 Iberdrola (G)                KfW (G)                      Kommunekredit (G)              LeasePlan (G)

 Mediobanca (G)               NIB (G)                      NordLB (G)                     NRW Bank (G)

 Ontario Teachers             Orsted (G)                   RBI (G)                        Red Electrica (G)
 Finance (G)

 Shinhan Bank (G)             Signify                      Société Générale (G)           Sparebank 1 (G)

 Sparebank Vest               Statkraft                    Sumitomo (G)                   Svenska Handels-
 (G)                                                                                      banken (G)

 Telia (G)                    Tennet (G)                   Volvo (G)

 ⎯⎯⎯⎯⎯
15 As of 31 March 2021
16 Supplements behind portfolio positions: (G) = Green Bond, (S) = Social Bond, (ST) = Sustainability Bond

13 Joh. Berenberg, Gossler & Co. KG
A Case Study - Ørsted
Company Overview
The Danish company Ørsted is globally the largest developer and operator of off-
shore wind farms with an installed capacity of c12GW in renewable energy.17 Over
the past 15 years, Ørsted has been successfully transitioning from a fossil fuel-fo-
cused energy company to a renewable energy pioneer.
Positive Impact
Most of the world’s energy consumption still comes from environmentally harmful
fossil fuels – Ørsted is a pioneer in the offshore wind segment, trying to actively
accelerate the transition towards renewable energy. To achieve this goal, Ørsted is
heavily investing in new technology and the expansion of its wind energy capacity.
It is targeting to spend DKK200bn until 2025 for the expansion of its offshore and
onshore wind, sustainable biomass and solar energy capacity.18 As of 2020, Ørsted
is already supplying green power for more than 15m people and the company esti-
mates that its offshore wind farms helped to avoid 8.1m tonnes of CO2e from being
released, thus materially addressing the challenge of Climate Change. Furthermore,
the company’s ambition is to double its renewable energy capacity by 2025 and sup-
ply clean power to more than 55m people by 2030.
Potentially Adverse Impact
Ørsted comprehensively reports on its sustainability metrics and does not face any
material controversies. As of 2020, Ørsted derives close to 3% of its revenues from
coal power generation19 and thus generates greenhouse gas (GHG) emissions. How-
ever, Ørsted has a clear coal phase-out strategy by 2023. Further, the company sets
highly ambitious climate targets and plans to achieve carbon neutrality for Scope 1
and 2 emissions by 2025 (and include Scope 3 by 2040).
Summary
Berenberg Net Impact Score 2,4
Sustainable Development Goals 7 & 13
ABC Classification C
⎯⎯⎯⎯⎯
17 As of June 2021, per Ørsted’s capital markets day 2021 presentation
18 Ørsted Website: https://orsted.com/en/about-us/about-orsted/powering-the-world-with-green-energy
19 Based on data from MSCI ESG, retrieved 31 March 2021
14 Joh. Berenberg, Gossler & Co. KGSustainable Growth & Innovation The Challenge of Sustainable Growth and Innovation While economic growth might not be an end in itself, it has significant effects on global levels of poverty. However, against the background of climate change and finite natural resources, economic growth needs to be environmentally sustainable while at the same time adhering to and promoting social standards such as fair and inclusive labour practices. As defined by the United Nations’ Sustainable Develop- ment Goal 8, the aim is to achieve sustained, inclusive, and sustainable economic growth with full and productive employment and decent work for all. Innovation is one of the fundamental factors when it comes to both an individual company’s success and stable and sustainable economic growth. Creating and fos- tering corporate cultures that accelerate highly innovative ideas requires ongoing effort – yet only those companies making this effort remain economically viable and can, ultimately, solve global challenges and induce positive change. Further, education and, in a wider sense, social enablement and empowerment are essential aspects in achieving the goal of smart, green and fair growth for the global population. Although major advancements have been made in recent decades, achieving inclusive and equitable quality education, as aimed for by the United Na- tions’ Sustainable Development Goal 4, is still a long way off. Contributing to the Solution — Our Portfolio Holdings Companies offering solutions to this challenge contribute, among other things, to financial inclusion, access to and affordability of public transportation, or the reduc- tion of dependence on non-renewable resources. Easily accessible and low-cost technologies can advance education and skills or help small businesses create jobs sustainably. Further, affordable housing and solutions that advance inclusive, sus- tainable cities are needed. Generally, R&D expenditure and strong innovation capa- bilities can lead to the development of much needed solutions 15 Joh. Berenberg, Gossler & Co. KG
Our portfolio positions20 21 addressing the challenge:

 Adif (G)                      BNG (ST)                     BPER Banca (S)                  CaixaBank (S)

 Caja Rural (ST)               Cassa Depositi (S)           Chile (G)                       Madrid (G)

 Council of Europe             Deutsche Bahn                Eurofima (G)                    EU (S)
 (S)

 Ferrovie (G)                  Hamburger Hoch-              Hypo Tirol (S)                  ICO (S)
                               bahn (G)

 Kookmin (ST)                  Korea Housing                Municipality Finance            KutxaBank (S)
                               Finance (S)                  (G)

 NatWest (S)                   NWB (S)                      West African Devel-
                                                            opment Bank (ST)

 ⎯⎯⎯⎯⎯
20 As of 31 March 2021
21 Supplements behind portfolio positions: (G) = Green Bond, (S) = Social Bond, (ST) = Sustainability Bond

16 Joh. Berenberg, Gossler & Co. KG
A Case Study - CaixaBank
Company Overview
CaixaBank is a large Spanish universal banking group, active in retail, corporate and
investment banking. With c21m customers, 6,300 branches and an extensive geo-
graphical presence, CaixaBank is one of the largest banking groups in Spain and
plays a vital role for the financial inclusion of the country.22
Positive Impact
The social mandate is embedded in the bank’s DNA, as CaixaBank is partially
owned by the “laCaixa” Banking Foundation that channels substantial financial re-
sources towards social and cultural development in Spain. The social mandate is
also explicitly incorporated in the bank’s strategy, targeting further social inclusion
and a contribution to SDGs 1 (No Poverty) and 8 (Decent Work and Economic
Growth). With its entity MicroBank, the leading bank for micro loans in Spain with
a social focus, CaixaBank contributes to the creation of employment and the im-
provement of financial and social inclusion. CaixaBank is funded, among others,
through social bonds, whose proceeds are utilised to provide loans under strict eli-
gibility criteria that ensure financial inclusion and provision of banking services to
socially disadvantaged parts of the population, or companies in economically disad-
vantaged regions of Spain. Proceeds of the invested social bond, for example, were
used to finance more than 147,000 loans to underserved individuals and families
and more than 13,000 loans to self-employed workers, micro-enterprises and SMEs.
These loans contributed to the creation of 8,207 jobs.23
Potentially Adverse Impact
Due to its business activities, CaixaBank has a very low carbon footprint. Neverthe-
less, it is 100% carbon neutral, and has been the first listed bank in Spain to fully
offset its carbon footprint. The bank comprehensively reports on its sustainability
performance and relevant metrics. CaixaBank faces a potential controversy related
to governance practices in its banking business, which we monitor.
Summary
Berenberg Net Impact Score 2,2
Sustainable Development Goals 8
ABC Classification C
⎯⎯⎯⎯⎯
22 As of first quarter 2021 per CaixaBank Website: https://www.caixabank.com/en/about-us.html
23 Social Bond Impact Report: https://www.caixabank.com/en/shareholders-investors/fixed-income-investors.html
17 Joh. Berenberg, Gossler & Co. KGResponsible Use of Resources
The Challenge of a Responsible Use of Resources
The planet’s natural resources are finite. Yet they are central to human wellbeing, as
they form the basis of our health and prosperity. Over time, the global use of re-
sources has increased, accelerated by industrialisation and globalisation. At this
point, some natural resources are overexploited. This in turn threatens livelihoods
and jeopardises whole ecosystems.24
Numbers can give a sense of the extent of this. The global use of freshwater has
increased almost sixfold since 1900 to c4trn m3 in recent years.25 Globally, c368m
tons of plastics were produced in 201926, but only 9% of the plastics manufactured
between 1950 and 2015 was recycled.27
To mitigate the adverse effects of the overuse of natural resources, a drastic change
of consumption and production patterns is required. Resource efficiency during
production processes is often a starting point. Further, innovative technologies that
decouple natural resource use and environmental impact from economic activity are
needed. Measures that mitigate scarcity, reduce losses, and optimise resource man-
agement systems can positively induce change and accelerate a transition towards a
circular economy.
Contributing to the Solution — Our Portfolio Holdings
Companies offering solutions to this challenge contribute, among other things, to a
drastic reduction of resources used and advance their recycling capabilities. This
can, for example, include: avoiding and reducing packaging or replacing it with in-
novating packaging solutions; cutting the amount of food waste; and protecting and
managing water as well as optimising its use. Further, sustainable solutions to treat
and manage waste and new recycling technologies are much needed.
Our portfolio positions28 29 addressing the challenge:
Acea (G) EcoLab FCC Aqualia FCC Medio
Ambiente (G)
JFM (G) Landsbankinn (G) Mondi Suez
UPM-Kymmene Veolia Xylem
(G)
⎯⎯⎯⎯⎯
24 https://www.iisd.org/articles/sustainable-use-natural-resources-governance-challenge
25 https://ourworldindata.org/water-use-stress
26 https://www.statista.com/topics/5401/global-plastic-waste/
27 https://www.oecd.org/environment/waste/policy-highlights-improving-plastics-management.pdf
28 As of 31 March 2021
29 Supplements behind portfolio positions: (G) = Green Bond, (S) = Social Bond, (ST) = Sustainability Bond
18 Joh. Berenberg, Gossler & Co. KGA Case Study — Xylem Company Overview Founded in 2011, US-based Xylem provides water technologies for public, residen- tial and commercial uses. The products offer solutions for water infrastructure, such as wastewater transport and treatment as well as water-related measurement and control devices and building services. Xylem has c17,000 employees worldwide and operates in 150 countries. Positive Impact In 2020, Xylem’s treatment solutions helped its customers to reuse 4.3bn m3 of water, while its efficient products and solutions helped to reduce their carbon foot- print by 0.7m metric tons of CO2. Through dewatering and digital technologies, its customers were able to prevent 1.4bn m3 of polluted water from entering local wa- terways. Partly in collaboration with non-profit partners, Xylem has provided 4.1m people in developing countries with access to clean water and educated 3.6m people to improve their awareness of water challenges. With its highly efficient and innovative solutions along the entire water cycle, Xylem contributes to solving the global challenge of water scarcity and affordability. Addi- tionally, it focuses on providing its products and services in emerging markets, where water can be scarce. The company is thus able to drive positive change and provide a solution to pressing matters. Potentially Adverse Impact Via reducing energy consumption and increasing investments in renewable energy at its facilities, Xylem has significantly lowered its carbon emissions. It is highly transparent regarding its performance on environmental metrics and commitments to them. Xylem does not face controversies relating to problematic behaviour and is not involved in any controversial business activities. Summary Berenberg Net Impact Score 3 Sustainable Development Goals 6 & 12 ABC Classification C 19 Joh. Berenberg, Gossler & Co. KG
The Sustainable Development Goals
In our 2018 Berenberg ESG Office study “Understanding the SDGs in Sustainable
Investing”30 and its 2021 update “A Berenberg ESG Survey 2021” 31, we highlighted
the SDGs that survey participants found most important on the one hand and most
investible on the other hand. Based on this analysis, we developed the four key
global challenges, namely Demography and Health, Climate Change, Sustainable
Growth and Innovation and Responsible Use of Resources. They are at the heart
of our impact framework.

Another part of our impact framework is the mapping of our portfolio holdings
with respect to their contribution to some of the SDGs. As a first step, we assigned
10 investible SDGs to our four core global challenges (Figure 1).

Demography & Health                                             Responsible Use of Resources

                   Climate Change                               Sustainable Growth & Innovation

Figure 1: Core Global Challenges and the SDGs
Source: Berenberg

In a second step, we mapped our portfolio holdings to the respective SDGs of the
specific global challenge (see step one). Based on its primary contribution, each
portfolio position is assigned to 1-3 of the SDGs. We show portfolio weights along-
side the respective SDGs – if an investment contributes to several SDGs, the port-
folio weight is allocated proportionately (Figure 2).

                  25%

                  20%
 portfolio in %
  Share of the

                  15%

                  10%

                  5%

                  0%
                        SDG 2 SDG 3 SDG 4 SDG 6 SDG 7 SDG 8 SDG 9 SDG 11 SDG 12 SDG 13
Figure 2: The portfolio holdings mapped to the SDGs
Source: Berenberg

 ⎯⎯⎯⎯⎯
30 Berenberg ESG Office Study on the SDGs “Understanding the SDGs in Sustainable Investing”, available at
  www.berenberg.de/en/esg
31 See Berenberg Wealth & Asset Management Study “Berenberg ESG Survey: Exploring investor sentiment”, availa-

  ble at www.berenberg.de/en/esg

20 Joh. Berenberg, Gossler & Co. KG
Finally, as an additional view on the fund’s contribution to the SDGs, we compare
the Alignment Scores of the fund’s portfolio with those of its benchmark, as shown
in Figure 3. We use SDG Net Alignment Scoring data from an external data pro-
vider and combine this with our own Net Impact Score data. For constituents not
covered by our internal analysis, we only use data from the external provider.
The graph shows the fund’s relative positive SDG net alignment compared to that
of the respective benchmark. It is important to note that the two methodologies,
namely our own as well as the external data providers’, are not identical. However,
both are based on a similar approach of considering positive and negative contribu-
tions and scoring those respectively. We believe this to be a valuable further indica-
tion of the fund’s performance when it comes to the SDGs.
5
4
3
2
1
0
-1
-2
-3
-4
-5
SDG 10
SDG 11
SDG 12
SDG 13
SDG 14
SDG 15
SDG 16
SDG 17
SDG 1
SDG 2
SDG 3
SDG 4
SDG 5
SDG 6
SDG 7
SDG 8
SDG 9
Sustainable Euro Bonds ICE BofAML Euro Non-Sovereign Index
Figure 3: MSCI ESG Net Alignment of SDG Scores compared to the benchmark
Source: MSCI ESG, own calculations and presentation. Certain information © 2021 MSCI
ESG Research LLc. Reproduced by permission
21 Joh. Berenberg, Gossler & Co. KGAdditional ESG and Impact-related Information
Use of Green, Social and Sustainability Bonds
Share of Green, Social and Sustainability Bonds in the Portfolio
Green Bonds 54,9%
Social Bonds 21,0%
Sustainability Bonds 4,7%
Bonds with a
17,1%
positive impact*
0% 10% 20% 30% 40% 50% 60%
* Bonds from issuers that have a positive impact on the environment and society through their business
model and offered products and services
Source: Bloomberg
Based on holdings as of 31 March 2021
Average Net Impact Score per Global Challenge
Additional to the portfolio level as shown within our “Spotlights” section, we meas-
ure and showcase the average Berenberg Net Impact Score per global challenge.
Demography and Health Responsible Use of
Resources
0 0
-1 1 -1 1
-2 2 -2 2
-3 3 -3 3
2,1 1,7
Sustainable Growth and
Climate Change Innovation
0 0
-1 1 -1 1
-2 2 -2 2
-3 3 -3 3
1,8 2,1
22 Joh. Berenberg, Gossler & Co. KGCarbon Intensity
As reported above, the Berenberg Sustainable Euro Bonds fund uses an impact ap-
proach in which we aim to positively contribute to our four global challenges and
consequently also the SDGs through our portfolio holdings.
While the fund does not specifically target to minimise its carbon intensity, we rec-
ognise the importance of our companies’ carbon exposure and climate impact,
which is also why we explicitly incorporate the introduced Carbon Assessment pillar
in our proprietary Berenberg Net Impact Model.
Additionally, we report on the carbon intensity of the portfolio compared to its
benchmark (ICE BofAML Euro Non-Sovereign Index) in the following section.
Please note that the following analysis and carbon data only refers to non-sovereign
bond issuers within the fund and the benchmark. Hence, sovereign issuers (and
certain sovereign-related issuers such as local authorities or supra-nationals) are not
included in the analysis. In the carbon intensity analysis, 75.7% of the total fund
portfolio, and 76.4% of the total benchmark are considered accordingly.
Carbon Intensity – Fund vs. Benchmark
250
195,5
200 176,1
150
100,2 98,8
100
50
0
Q1 2021 Q4 2020
Berenberg Sustainable Euro Bonds ICE Euro Non-Sovereign Index
The CO2 Intensity (Scope 1 & 2 emissions in tonnes per USDm of revenue) per holding is multiplied by
its scaled portfolio weight (current value of the investment relative to the current portfolio value exclud-
ing sovereign issuers and issuers for which no comparable data is available) and aggregated. The bench-
mark is ICE BofAML Euro Non-Sovereign Index.
Source: MSCI ESG Data, ICE
Based on holdings as of 31 March 2021
This weighted average CO2 intensity provides an indication of the portfolio’s expo-
sure to CO2 –emission-intensive companies. As indicated, the carbon intensity of
the Berenberg Sustainable Euro Bonds stands at 176.1t/USDm in revenues and is
thereby substantially higher than the carbon intensity of the fund’s benchmark.
This fact is explained by the general impact approach of the fund: our impact ap-
proach focuses, among others, on investments in transition stories and green bonds
that provide a positive impact and enable the transition to a more sustainable econ-
omy and society by addressing one of our four global challenges.
23 Joh. Berenberg, Gossler & Co. KGParticularly, green and sustainability bonds are often issued by companies that we would describe as transition stories or as issuers that play a vital role in the transition to a low-carbon economy. This may, for example, include companies from the utility sector that currently begin their transition (or are already in the process) towards a more sustainable business model by refocusing from oil, coal or gas to renewable energies. Another (even though less pronounced) example are real estate companies: the real estate sector is responsible for a material share of global CO2 emissions and real estate companies can substantially contribute to a low-carbon economy by in- vesting in green buildings and energy efficiency improvement of existing buildings. All these companies face substantial investment requirements to transition success- fully, and green and sustainability bonds can play a material role to facilitate this. To have a positive impact on the environment and society, the fund invests in these green and sustainability bonds that enable a transition as well as in companies that follow an ambitious sustainability and climate strategy and positively contribute to the environment through innovative and sustainable products and services. Invest- ing in green and sustainability bonds as well as transition stories in general, however, results in a specific sector exposure within the portfolio. These sectors and bond issuers typically have a high carbon intensity and thus, to some extent, a negative environmental impact, which is why the financing of a quick and smooth transition is essential. Among the sectors with the highest carbon intensity in the fund as well as in the benchmark are, for example, utilities or real estate companies.32 Looking at the contribution of different industry sectors (BICS classification) to the total carbon intensity of the fund, the utility sector makes up the majority contribu- tion of the total CO2 intensity: with a contribution of 102.9t/USDm revenue, utility companies account for c58% of total carbon intensity in the portfolio. Hence, the total and relative contribution of utilities is substantial higher than in the fund’s benchmark. The reason for the higher CO2 intensity contribution is the materially higher weight of the utility sector within the Berenberg Sustainable Euro Bonds fund versus the benchmark (18% versus 6%). As mentioned above, the fund actively focuses on transition stories that often take place in the utilities sector and green bonds, for which utilities are a large issuer group. Taking a closer look, the utility companies invested in the fund actually have a 20% lower average CO2 intensity than companies in the benchmark. Consequently, the high utility sector weight is the primary factor for the fund’s higher carbon intensity. ⎯⎯⎯⎯⎯ 32 Real estate companies are classified as “financials”, according to the BICS classification that is used for the analysis and following charts 24 Joh. Berenberg, Gossler & Co. KG
Carbon Intensity – Contribution by BICS Sector

                                                       41,4
     Utilities                                                                           102,9

   Materials                               24,6
                                    17,1
      Energy                      12,4
                      0,0
                            5,9
  Financials                               25,7

 Industrials           4,3
                                     19,6

       Other                  11,7
                              10,9

                  0                20             40          60          80       100           120
                                             Benchmark             Fund
The CO2 intensity (Scope 1 and 2 emissions in tonnes per USD mn. of revenue) is aggregated by sector
(BICS sector classification is used) for the fund and benchmark, using the carbon intensity of each rele-
vant holding and its scaled portfolio weight per holding (current value of the investment relative to the
current portfolio value excluding sovereign issuers and issuers for which no comparable data is available).
The benchmark is ICE BofAML Euro Non-Sovereign Index.
Source: MSCI ESG Data, ICE
Based on holdings as of 31 March 2021

BICS Sector Weights – Fund vs. Benchmark

     Utilities                    6%
                                                       18%
   Materials                3%
                              4%
      Energy                 3%
                      0%
  Financials                                                                           42%
                                                                                     40%
 Industrials                       6%
                                  5%
       Other                                                                         40%
                                                                          32%
                 0%                 10%                20%          30%         40%            50%
                                             Benchmark             Fund
The scaled portfolio weights of relevant holdings (current value of the investment relative to the current
portfolio value excluding sovereign issuers and issuers for which no comparable data is available) are ag-
gregated by sector (BICS sector classification is used) for the fund and benchmark.
Source: ICE
Based on holdings as of 31 March 2021

25 Joh. Berenberg, Gossler & Co. KG
An additional aspect that should be considered is the focus on green, social and
sustainability bonds and their direct impact that is generated by financing environ-
mentally or socially beneficial projects and assets. As indicated below, c60% of the
fund’s relevant holdings33 are invested in green, social or sustainability bonds, while
these account for only 7% of the relevant benchmark holdings.
Share of Green, Social and Sustainability Bonds34
6%
Green Bonds 47%
1%
Social Bonds 10%
0%
Sustainability Bonds 3%
0% 10% 20% 30% 40% 50%
Benchmark Fund
The scaled portfolio weights of relevant holdings (current value of the investment relative to the current
portfolio value excludes sovereign issuers and issuers for which no comparable data is available) are ag-
gregated by the bond category Green Bond, Social Bond or Sustainability Bond. Weights do not neces-
sarily sum up to 100%. BICS sector classification is used for the fund and benchmark.
Source: ICE, Bloomberg
Based on holdings as of 31 March 2021
The following two examples from the utility and real estate sector explain why we
should take the direct positive impact from green bonds into account and not ex-
clusively focus on the carbon intensity of the underlying bond company.
❖ Utilities: Italian utility company ERG focuses on renewable energy gener-
ation. However, in order to stabilise the Italian electricity network, ERG
additionally operates one natural gas plant, which leads to a high carbon
footprint for the company despite the clear focus on clean energy and de-
spite the fact that the majority of power is generated from wind parks.
ERG’s business expansion strategy is exclusively focused on increasing its
renewable energy capacity – one of the reasons why the company issued a
⎯⎯⎯⎯⎯
33 All holdings that are relevant for the calculation of the carbon intensity (i.e. excluding sovereign (-related) issuers)
34 Please note that the share of green, social and sustainability bonds is only based on portfolio holdings that are rele-
vant for the carbon intensity calculation (for example, excluding sovereign bonds) and consequently does not neces-
sarily match with the share of green, social and sustainability bonds for the total fund, as presented on p.19
26 Joh. Berenberg, Gossler & Co. KGYou can also read