Inclusion in the Music Business: Gender & Race/Ethnicity Across Executives, Artists & Talent Teams
←
→
Page content transcription
If your browser does not render page correctly, please read the page content below
Inclusion in the Music Business:
       Gender & Race/Ethnicity Across
      Executives, Artists & Talent Teams

   Dr. Stacy L. Smith, Dr. Carmen Lee, Marc Choueiti,
Dr. Katherine Pieper, Zoe Moore, Dana Dinh & Artur Tofan

                     with assistance from

           Jaryn Valdry                 Max Thors
          Kameron Brown             Manessah Dechabert
         Samantha Stewart              Bryan Davis

                            June 2021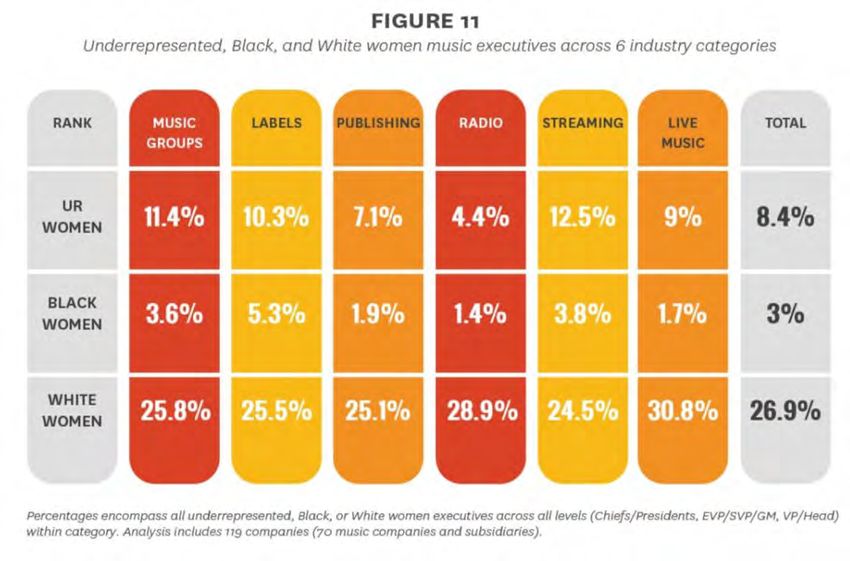
1

                                 Inclusion in the Music Business:
                  Gender & Race/Ethnicity Across Executives, Artists & Talent Teams

                                           Executive Summary

                                      Annenberg Inclusion Initiative
                                                  USC

The purpose of this study was to map the diversity of the U.S. music business across different positions
of power. Focusing on underrepresented racial/ethnic groups and gender in general and Black
executives in particular, we examined the rank and titles of 4,060 executives across 119 companies in
the music space. Those organizations spanned 6 categories of the music business: 1) music groups, 2)
labels/label groups, 3) publishing, 4) radio, 5) streaming and 6) live music and concert promotion.
Additionally, every artist signed with one of the labels studied was assessed for underrepresented status
(White vs. non White; Black vs. non Black) and gender (male, female, non binary) as well as members of
the act’s team (i.e., manager, agent, publicist). The key findings are presented below.

                                               Key Findings

Top Executives & Senior Management Teams

A total of 70 major and independent companies were examined for their top executives. At the pinnacle
of power within these entities (e.g., CEO/Chair/President), 86.1% of top executives were men (13.9%
women, n=10) and 86.1% were White (13.9% underrepresented, n=10). All 10 non white top executives
ran independent companies and only 2 were women of color. In total, just 3 top executives were Black.

Looking at the 9 major music companies (SME, UMG, WMG, Spotify, iHeart Radio, Cumulus, Audacy, Live
Nation, AEG Presents) across categories (music groups, streaming, radio, live music and concert
promotion), 100% of the top executives were white and only 1 was female (11.1%). Adding in the top
music executives at companies whose business encompasses more than music-related revenue streams
(i.e., Amazon Music, Apple Music, YouTube), the profile increases to 11 males and one female (9.1%).

We examined the senior management team or executive board of the aforementioned 9 major music
companies (SME, UMG, WMG, Spotify, iHeart Radio, Cumulus, Audacy, Live Nation, AEG Presents), as
presented on each organization’s website. Music groups had the greatest share of underrepresented
(26.3%) and Black executives (23.7%) on their executive boards. Live music and concert promotion had
the lowest percentage of underrepresented executives (12.5%) and no Black executives (0), but the
highest percentage of women in leadership roles (40.6%). Radio and streaming companies held a middle
ground between the other two categories across all groups (underrepresented=17%, Black=2.1%,
women=23.4%).

We looked more broadly at the senior-most leaders across 6 industry categories: music groups, labels,
publishing, radio, streaming, and live music. This analysis differs from the one above as music groups
and their subsidiaries (e.g., labels/label groups, publishing) were included. This brings the total sample
size of companies up from 70 to 119. Overall, 17.6% of 125 top executives (e.g., CEO, Chair, President)
identify with an underrepresented racial/ethnic group and 10.4% were Black. Women clocked in at
12.8% of all top executives, though women of color filled only 3.2% of all top roles. For
underrepresented executives, labels (21.7%) and streaming (21.4%) were most inclusive. Publishing
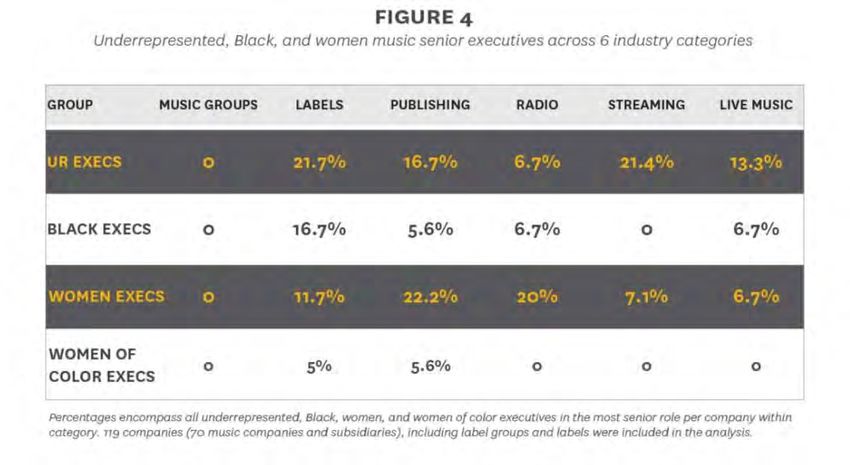
2

(16.7%) and live music (13.3%) held the middle ground for underrepresented executives, while radio
(6.7%) and music groups (0) trailed. However, for Black executives (16.7%), the labels surpassed the
other categories (radio=6.7%, live music=6.7%, publishing=5.6%, music groups=0).

Women were most prevalent at the top of publishing (22.2%) and radio (20%). There were two arenas
where women of color held top leadership positions: labels and publishing. Five percent of top
executives at labels were women of color and 5.6% in publishing. This latter statistic is deceptive, as it
only represents one woman of color leading in publishing. These results demonstrate that white women
and women of color have different access to leadership roles in music.

Executive Ranks: CEOS, EVPs/SVPs/GMs, VP/Heads

Looking at 4,060 executives at the VP level and above across 119 companies, only 19.8% of executives in
this study (males=459, females=341) were underrepresented and 7.5% were Black (males=184,
females=122). Put differently, there were 17.7 white male executives to every 1 Black female executive.

For underrepresented and Black executives, companies show inertia at every level of the hierarchy.
Fewer than 10% of executives at any level were Black. While women’s representation throughout the
executive ranks had a steady and linear decline (VPs/Heads=41.3%, EVPs/SVPs/GMs=31.6%,
CEOs/Chairs/Presidents=20.5%), this pattern differed by race/ethnicity. White women filled slightly
more than one-quarter of all executive positions (26.9%), and their presence declined as the level of
authority within the hierarchy increased. For underrepresented and Black women, the trends mirrored
those for Black executives overall: there are few women of color (8.4%) and Black women (3%) in
particular who fill the executive ranks (underrepresented women as VPs/Heads=9.2%,
EVPs/SVPs/GMs=8.2%, CEOs/Chairs/Presidents=5.6%; Black women as VPs/Heads=3%,
EVPs/SVPs/GMs=3.3%, CEOs/Chairs/Presidents=2.4%).

Executive Ranks by Category

Three industry categories emerged as leaders in hiring and promotion of underrepresented executives
(all ranks): streaming, music groups, and labels/label groups. In each, underrepresented executives filled
roughly a quarter or more of all executive roles, though this still falls well below proportional
representation with the U.S. population (40%). In contrast, only 12.3% of radio executives were from
underrepresented racial/ethnic groups, the lowest across all categories.

The music labels were the only sector where the percentage of Black executives (14.4%) reached
proportional representation with U.S. Census (14%). In every other sector, the percentage was less than
10%: 7.4% in streaming, 7.2% in music groups, 6.1% in publishing, 4% in radio, and 3.3% in live music
and concert promotion.

Turning to women executives, not one sector reached 40%. Live music and concert promotion came
closest (39.1%), but other categories (e.g., music groups, streaming, labels) were similar. One-third or
less of all executives in radio (33.2%) and publishing (31.9%) were women. Yet, examining women
overall masked the erasure faced by underrepresented women. Streaming had the highest percentage
(12.5%) of underrepresented women executives, followed by music groups (11.4%) and labels (10.3%).
The remaining categories (live music=9%; publishing=7.1%; radio=4.4%) each had few underrepresented
women in executive roles.
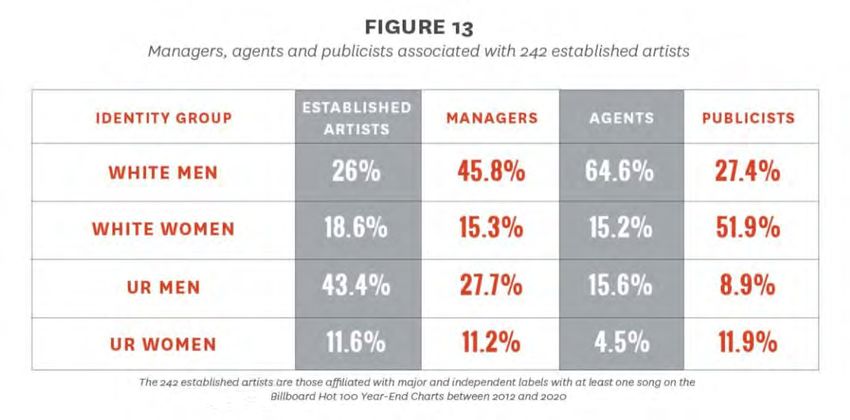
3

The percentage of Black women executives was even smaller-- labels had the highest percentage of
Black women executives at only 5.3%, while radio (1.4%) and live music (1.7%) had the lowest
percentage. Streaming (3.8%), music groups (3.6%), and publishing (1.9%) held the middle ground.

Artists and A&R Executives

We examined the identity of 1,750 solo artists affiliated with the labels/label groups in this study. A total
of 48.3% of these artists were from underrepresented racial/ethnic groups (men=33.8%, women=14.6%)
and roughly one-third (31.2%) of all artists were Black (men=22.7%, women=8.5%). Two-thirds (67.8%)
of artists were men, 31.8% were women and less than 1% were gender non-binary.

Crossing gender and race/ethnicity, 34.2% were White men, 33.8% were underrepresented men, 17.4%
were White women and 14.6% of artists were underrepresented women. The percentages of
underrepresented and Black artists far surpassed the percentage of underrepresented and Black
executives both in the industry overall and specifically as executives at the labels/label groups.

A full 34.2% of A&R executives in the sample were underrepresented—which is close to, but still
below—proportional representation with the U.S. population. Roughly one-fifth (21.2%) of all A&R
executives were Black, surpassing the percentage of the U.S. population that identifies as Black. Slightly
more than one-quarter (26.7%) of all A&R executives were women, and less than 10% of all A&R
executives were women from underrepresented racial/ethnic groups (9.5%). Less than 5% of A&R
executives were Black women (4.8%).

Established Artists and their Managers, Agents & Publicists

A total of 242 solo artists associated with the companies studied had at least one song on the Billboard
Hot 100 across the last 9 years (2012-2020). 43.4% were underrepresented males, 26% were White
males, 18.6% were White females, and 11.6% were underrepresented females. The profile for
managers, agents and publicists deviates in some ways from these artists’ identities.

Beginning with managers, 61.1% were White, and 38.9% were underrepresented. Nearly half of all
managers were White men (45.8%), while just over a quarter were underrepresented men (27.7%).
White (15.3%) and underrepresented women (11.2%) each represented less than one-sixth of managers
for established artists.

Turning to agents, more than three-quarters (79.8%) were White and 20.2% were underrepresented.
Nearly two-thirds of agents were White men (64.6%), with little difference in the percentage of White
women (15.2%) and underrepresented men (15.6%) in this role. Very few women of color (4.5%) worked
as agents for established talent. 79.3% of publicists were White and 20.7% were underrepresented.
Publicity was the arena where White women (51.9%) were most likely to work, followed by White men
(27.4%), with few underrepresented men (8.9%) or women in these positions (11.9%).

Disaggregating the underrepresented percentages, less than one-third of all managers were Black
(30.8%), with significantly more Black men (23.4%) compared to Black women (7.5%) filling this role. This
latter finding became even more dire when we examined how many Black women agents represented
established talent. Only 3 Black women (1.2%) were responsible for the artists in this sample. Further,
less than a tenth of all agents (9.9%) were Black men. Similarly, few publicists were Black (11.9%), with
only 6 (4.4%) Black men working in this capacity and 10 (7.4%) Black women. Despite the percentage of
4

Black artists (43.8%) on the Hot 100 charts, the people who most closely manage their careers are
largely White and often male.

Relationship between Identity of Artists and their Teams’ Identity

Underrepresented artists were far more likely to have team members who were from underrepresented
racial/ethnic groups. More than 80% of underrepresented artists (81.2%) had at least one manager,
agent or publicist from an underrepresented racial/ethnic group, while less than 20% of the established
underrepresented artists (18.8%) only had White team members. The opposite pattern was true for
White artists; three-quarters of White artists had no underrepresented team members (75.2%). Nearly
two-thirds of underrepresented artists (62.4%) had two or more underrepresented team members but
only 2.7% of White artists did.

A similar pattern of results emerged when considering Black and non-Black artists, but differences were
more pronounced. Most non-Black artists (87.5%) had no Black representatives. The reverse was true
for Black artists (79.3%), who were more likely to have one or more Black team members. The trend
continued when we examined whether artists had two or more Black team members. Nearly half
(49.1%) of Black artists but just 2.9% of non-Black artists had two or more Black team members.

Female artists were more likely than male artists to have women representatives. A full 84.9% of women
artists had at least one-woman agent, manager, or publicist compared to 70.8% of male artists. Though
women continued to work with other women—69.9% of women had two or more female
representatives—this was not the case for men. The percentage fell to 38.7% of male artists with two or
more women team members. There were men and women artists with no women team members:
29.2% of male artists and 15.1% of female artists.

In conclusion, the findings in the report show that a lack of inclusion in the music industry is not the
problem of one company or one sector. It involves the entire community of artists, executives, agents,
managers, publicists, distributors, and even the audience. Thus, creating a more inclusive industry
requires the insight, input, and effort of all. By identifying where problems are most pernicious and
offering solutions, this report provides organizations with the opportunity to do more than perform
inclusion-- we hope to see companies and people throughout the music business put effort and
intention into making the industry one in which everyone can thrive.
5

                                 Inclusion in the Music Business:
                  Gender & Race/Ethnicity Across Executives, Artists & Talent Teams

                                           Executive Summary

                                      Annenberg Inclusion Initiative
                                                  USC

The purpose of this study was to map the diversity of the U.S. music business across different positions
of power. Focusing on underrepresented racial/ethnic groups and gender in general and Black
executives in particular, we examined the rank and titles of 4,060 executives across 119 companies in
the music space (see Appendix A).1 Those organizations spanned 6 categories of the music business: 1)
music groups, 2) labels and label groups, 3) publishing, 4) radio, 5) streaming and 6) live music and
concert promotion.2 Additionally, every artist signed with one of the labels studied (n=1,750 performers)
was assessed for underrepresented status (White vs. non White; Black vs. non Black) and gender (male,
female, non binary) as well as members of the act’s team (i.e., manager, agent, publicist). Holistically,
this analysis paints the most comprehensive picture of the inclusivity or lack thereof across a large swath
of the music industry. Six major claims characterize the findings from this investigation, which we review
below.

#1 No Surprises Here: The Very Top is Tilted Towards White Males

We were first interested in the inclusion profile of music executives with the highest clout. For many
companies, that is the CEO, Chairman, or President of the entire organization; for other companies, it
will be the senior most music executive (i.e., VP at Amazon Music) at the organization. In the vast
majority of cases, only one person holds the highest title. The majors have multiple subsidiaries whose
CEOs are not counted as those executives are not the most senior in the music organization.
Consequently, the total number of companies included in this analysis reduces to 70 (i.e., 12 majors, 58
independent companies) by only focusing on parent organizations.

The total number of top executives was 72 (13.9% female, n=10), with 86.1% white (n=62) and 13.9%
underrepresented (n=10). See Figure 1. All 10 underrepresented executives ran independent companies
and 2 were women (Golnar Khosrowshahi, Founder/CEO of Reservoir Media; Desiree Perez, CEO of Roc
Nation). See Figure 2. Only 3 top executives were Black (4.2%): Kevin Liles, Co-Founder/CEO, 300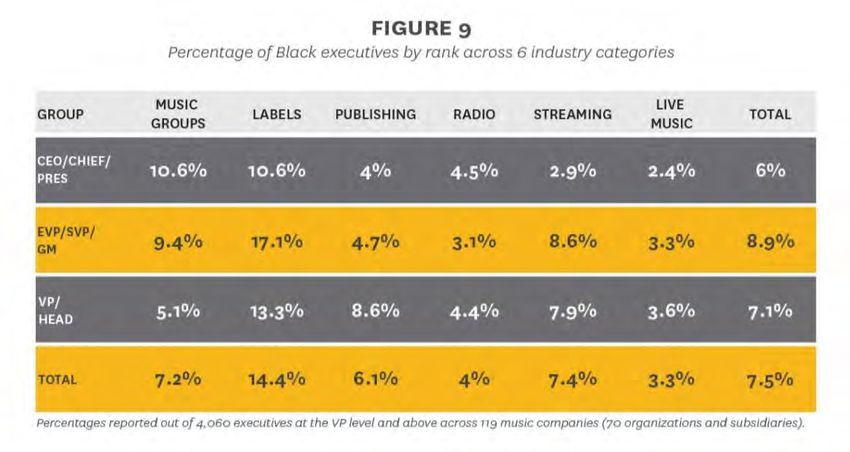
6

Entertainment; Alfred C. Liggins III, CEO, Urban One; Gary Guidry, CEO; G-Squared Productions. All of
these individuals were men.

The results are more dire when we turn to only the major music companies. Here, we only included
those major organizations where music or music-related events were the primary driver of business.
This reduced the overall number of major companies from 12 to 9 (excluding Apple Music, Amazon
Music, YouTube). 100% (n=9) of the top executives at the major companies were white and all but 1
(Mary Berner, Cumulus) was male.

Beyond CEOs/Chairs/Presidents, we were curious about the composition of senior management teams
at major music companies as listed on each organization’s website.3 In total, a full 18.8% of senior
management executives (n=117) of the largest music companies were from underrepresented
racial/ethnic groups, 8.5% were Black and 30.8% were women (see Figure 3). The findings varied by
company, however.

As shown in Figure 3, Music Groups (Sony Music Entertainment, Universal Music Group, Warner Music
Group) had the greatest share of underrepresented and Black executives on their senior management
teams. Live Music & Concert Promotion (AEG Presents, Live Nation) had the lowest percentage of
underrepresented executives and no Black executives, but the highest percentage of women in
leadership roles. Radio and Streaming companies (Audacy, Cumulus, iHeart Radio, Spotify) held a middle
ground between the other two categories across all groups.
7

After examining senior leadership teams across these three groups, we looked more broadly at the
senior-most leaders across 6 industry categories: music groups, labels, publishing, radio, streaming, and
live music. This analysis differs from the one above as music groups and their subsidiaries are both
included. This brings the total sample size of companies up from 70 to 119.

Typically, these top executives hold the title of CEO, Chair, or President. Three caveats must be noted
about this analysis before we begin. First, there were instances where more than one executive held the
senior-most title. In cases where these executives shared the exact same distinction, both executives
were included as top leaders. When titles diverged (e.g., Co-Chair/CEO, Co-Chair/COO), we included only
the executive with the highest title (e.g., CEO, President). The second caveat applied to companies
whose primary focus was not music. The top executive who oversees music within these corporations
was considered to be the senior-most executive, even when not distinguished with a Chief/President/
CEO title. Finally, when a CEO/President was not able to be identified, the most senior C-Suite executive
responsible for a company’s oversight was included.

Using this procedure, the number and percentage of top executives (n=125) was examined across 119
major and independent companies (see Figure 4). Overall, 17.6% of top executives (e.g., CEO, Chair,
President) identify with an underrepresented racial/ethnic group and 10.4% were Black. Women clocked
in at 12.8% of all top executives, though women of color filled only 3.2% of all top roles across the six
categories. As shown in Figure 4, there was notable deviation by sector.

For underrepresented executives, labels and streaming were most inclusive. Publishing and live music
held the middle ground for underrepresented executives, while radio and music groups trailed.
However, for Black executives, the labels surpassed the other categories. Further, the percentage of
Black executives at the labels was above the U.S. Census (14.4%). The remaining categories had few
Black executives in top leadership roles.

Women were most prevalent at the top of publishing and radio. However, this masked important
differences in women’s opportunity to lead for white women and women of color. There were two
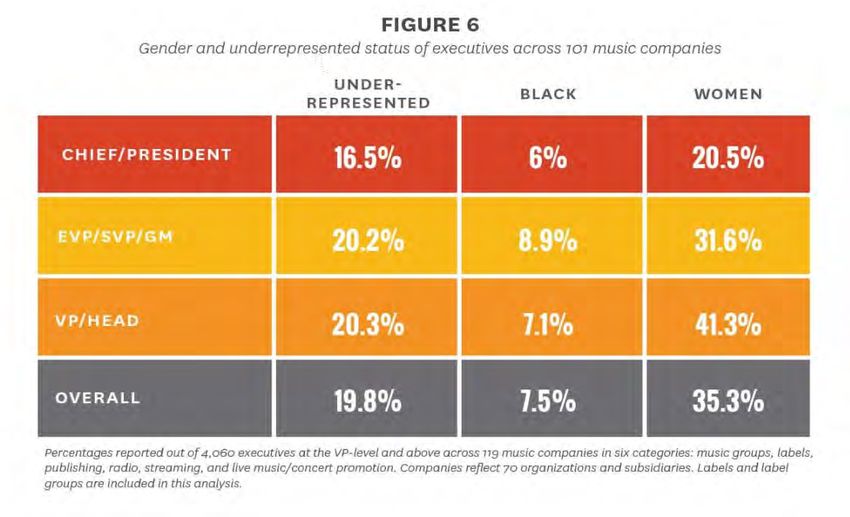
8

arenas where women of color held top leadership positions: labels and publishing. Five percent of senior
executives at labels were women of color and 5.6% in publishing. This latter statistic is deceptive, as it
only represents one woman of color. These results demonstrate that white women and women of color
have different access to leadership roles in music.

#2 The Executive Ranks are Exclusionary for Underrepresented, Black and Women Leaders

There were 4,060 executives with an identifiable race/ethnicity examined at 119 companies. Here, we
also expanded the analysis to include all executives at the VP/head level and above. Overall, only 19.8%
of executives in this study (males=459, females=341) were underrepresented and 7.5% were Black
(males=184, females=122). Put differently, there were 17.7 white male executives to every 1 Black
female executive.

These findings are surprising (see Figure 5), given that a) 40% of the U.S. population identifies with an
under represented racial/ethnic group and 14% are Black, b) 46.7% of all artists across 900 popular
songs from 2012 to 2020 are from underrepresented racial/ethnic groups and 37.7% are Black, and c)
44.4% of music degrees from U.S. postsecondary programs in 2019 were awarded to non white
students.4 Together, the results show that the music business has a workforce crisis on its hands, as the
leadership ranks communicate to non-White individuals that they do not belong. It is important to note
that women fared better in or near the C-suite (35.3% of executives), but are still well below
proportional representation with U.S. Census (51%).5

We were also interested in whether executive ranking (i.e., Chief/President, EVP/SVP/GM, VP/Head)
was associated with identity groups (see Figure 6). For underrepresented and Black executives,
companies show inertia at every level of the hierarchy. Fewer than 10% of executives at any level were
Black. Clearly, there is little room for participation to increase or decrease, given the absence of Black
executives in top management roles.
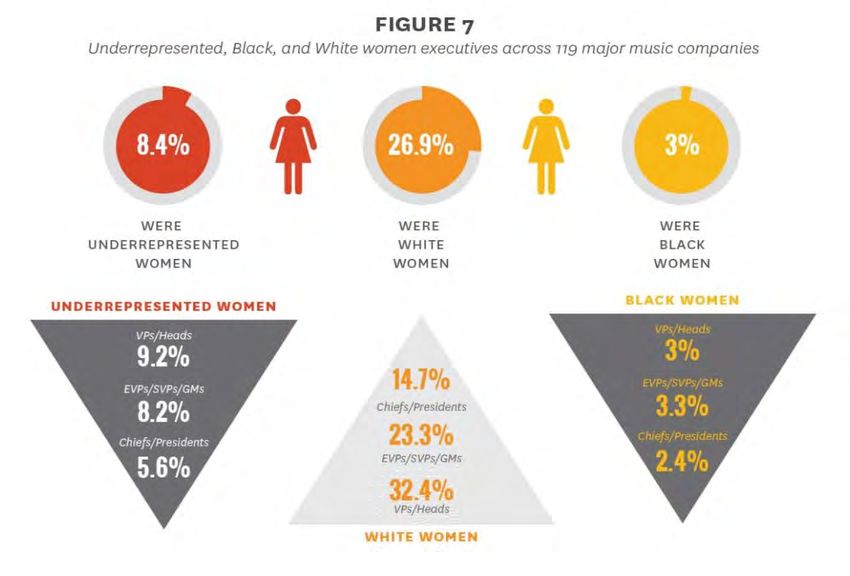
9

While women’s representation throughout the executive ranks had a steady and linear decline (see
Figure 6), this pattern differed by race/ethnicity. As shown in Figure 7, White women filled slightly more
than one-quarter of all executive positions (26.9%), and their presence declined as the level of authority
within the hierarchy increased.
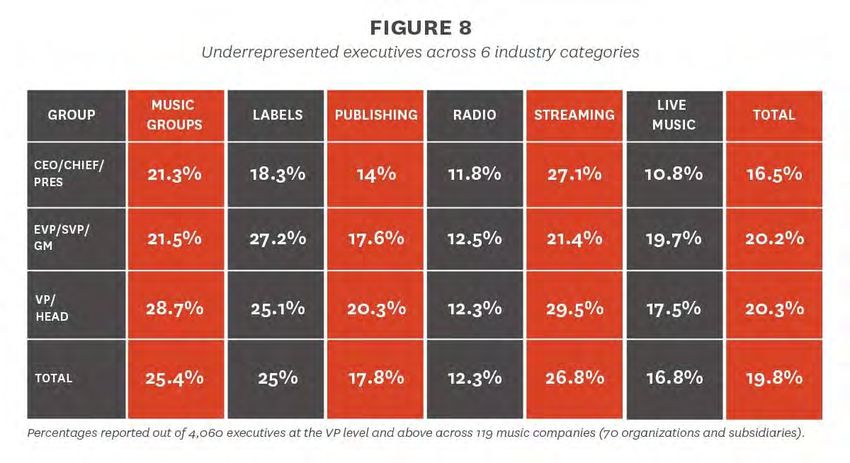
10

For underrepresented and Black women, the trends mirrored those for Black executives overall: there
are few women of color (8.4%) and Black women (3%) in particular who fill the executive ranks. This
offers little opportunity to move up through organizations and little difference by position for women
from these identity groups.

In sum, looking at the data by rank reveals that underrepresented and women executives were pushed
out as they reached the top of organizations, while Black executives held a small percentage of roles at
all levels.

#3 Some Sectors are a Sinkhole for Representation

We further examined differences in the percentage of underrepresented, Black and women executives
across six industry categories and by rank. Three industry categories emerged as the leaders in hiring
and promotion of underrepresented executives: streaming, music groups, and labels/label groups (see
Figure 8). In each, underrepresented executives filled roughly a quarter or more of all executive roles,
though this still falls well below proportional representation with the U.S. population. In contrast, only
12.3% of radio executives were from underrepresented racial/ethnic groups, the lowest across all
categories.

The music labels were the only sector where the percentage of Black executives (14.4%) reached
proportional representation with U.S. Census (see Figure 9). In every other sector, the percentage was
less than 10%: 7.4% in streaming, 7.2% in music groups, 6.1% in publishing, 4% in radio, and 3.3% in live
music and concert promotion. Notably, music labels are the industry sector most closely linked to artists
and the production of creative work-- which is often work by Black artists-- while other categories are
those that primarily profit from an artists’ work.
11

Turning to women executives, not one sector reached 40%. Live music and concert promotion came
closest (39.1%), but other categories (e.g., music groups, streaming, labels) were similar. One-third or
less of all executives in radio (33.2%) and publishing (31.9%) were women (see Figure 10).

Yet, examining women overall masked the erasure faced by underrepresented women (see Figure 11).
Streaming had the highest percentage (12.5%) of underrepresented women executives, followed by
music groups (11.4%) and labels (10.3%). The remaining categories (live music=9%; publishing=7.1%;
radio=4.4%) each had few underrepresented women in executive roles.
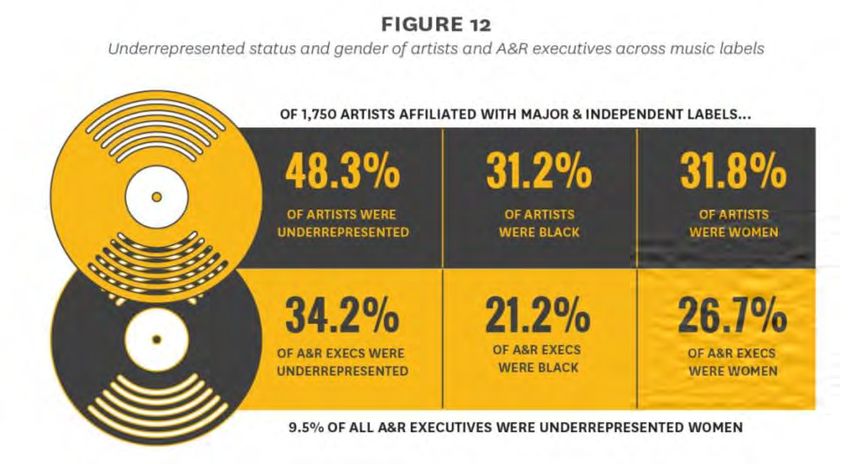
12

The percentage of Black women executives was even smaller-- labels had the highest percentage of
Black women executives at only 5.3%, while radio (1.4%) and live music (1.7%) had the lowest
percentage of Black women executives. Streaming (3.8%), music groups (3.6%), and publishing (1.9%)
held the middle ground. Clearly, the intersection of race/ethnicity and gender creates different
impediments for White women and women of color in the music industry.

#4 Artists and A&R Executives: Spaces Where Some Inclusion is Evident

We examined the identity of 1,750 solo artists affiliated with the labels/label groups in this study (see
Figure 12).6 A total of 48.3% of these artists were from underrepresented racial/ethnic groups
(men=33.8%, women=14.6%) and roughly one-third (31.2%) of all artists were Black (men=22.7%,
women=8.5%). Two-thirds (67.8%) of artists were men, 31.8% were women and less than 1% were
gender non-binary.

Crossing gender and race/ethnicity, 34.2% of artists were White men, 33.8% were underrepresented
men, 17.4% were White women, and 14.6% were underrepresented women. The percentages of
underrepresented and Black artists far surpassed the percentage of underrepresented and Black
executives both in the industry overall and specifically as executives at the labels/label groups.

Given the prevalence of underrepresented artists, we were curious whether the ranks of A&R executives
responsible for signing performers was similarly inclusive. A full 34.2% of A&R executives across the 3
music groups and independent companies in the sample were underrepresented (males=57,
females=22)-- which is close to -- but still under -- proportional representation with the U.S. population.
Roughly one-fifth (21.2%) of all A&R executives were Black, surpassing the percentage of the U.S.
population that identifies as Black.
13

Slightly more than one-quarter (26.7%) of all A&R executives were women, and less than 10% of all A&R
executives were women from underrepresented racial/ethnic groups (9.5%). Less than 5% of A&R
executives were Black women (4.8%). Thus, the profile of women in A&R, as in other areas of the music
industry, is primarily that of White women.

#5 Talent are Surrounded By White Managers, Agents & Publicists

Across the positions evaluated in this report, artists were most likely to be from underrepresented
racial/ethnic groups and Black. Given this, we looked outside the executive ranks and companies across
the 6 categories to other positions that worked closely with talent: managers, agents, and publicists.
Before conducting our analysis, we narrowed the focus and determined whether artists were
established or not. Established refers to whether the artist had at least one song on the Billboard Hot
100 Year-End Charts from 2012 to 2020.7 This reduced our sample size to 242 solo artists. We also
restricted our analysis to managers, agents, and publicists at outside firms (e.g., no in-house publicists)
and looked at the individual to avoid double-counting representatives who worked with more than one
established artist. The results are shown in Figure 13.

A total of 321 managers, 243 agents, and 135 publicists were included in the final sample. The inclusion
profile varied by position. Beginning with managers, 61.1% were White, and 38.9% were
underrepresented. As shown in Figure 13, nearly half of all managers were White men, while just over a
quarter were underrepresented men. White and underrepresented women each represented less than
one-fifth of managers for established artists.

Turning to agents, more than three-quarters (79.8%) were White and 20.2% were underrepresented. As
shown in Figure 13, nearly two-thirds of agents were White men, with little difference in the percentage
of White women and underrepresented men in this role. Very few women of color (4.5%) worked as
agents for established talent.

Finally, 79.3% of publicists were White and 20.7% were underrepresented. Figure 13 demonstrates that
publicity was the arena where White women were most likely to work, followed by White men, with few
underrepresented men or women in these positions.
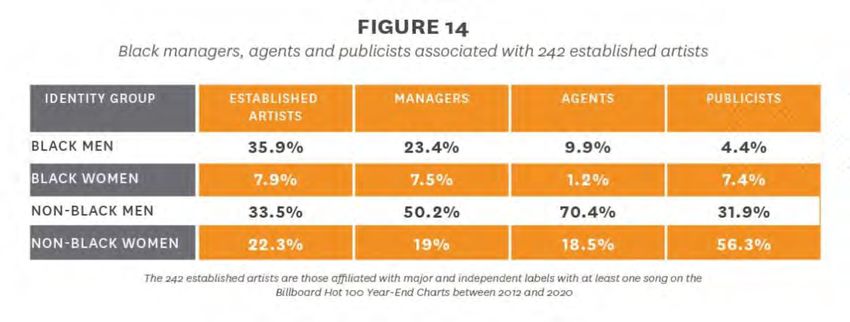
14

Disaggregating the underrepresented percentages, less than one-third of all managers were Black
(30.8%), with significantly more Black men (23.4%) compared to Black women (7.5%) filling this role. This
latter finding became even more dire when we examined how many Black women agents represented
established talent. Only 3 Black women (1.2%) were responsible for the artists in this sample. Further,
less than a tenth of all agents (9.9%) were Black men. Similarly, few publicists were Black (11.9%), with
only 6 (4.4%) Black men working as publicists and 10 (7.4%) Black women in this role. Despite the
percentage of Black artists on the charts, the people who most closely manage their careers are largely
White and often male.

The results in this section demonstrate that talent representation is another area in which the
percentage of underrepresented managers, agents, and publicists falls short of the percentage of
underrepresented artists on the charts. Managers come closest to approximating the inclusion on the
charts-- 27.7% of managers were underrepresented men compared to 43.4% of artists. Yet though
underrepresented women artists were 11.6% of all artists, only 4.5% of agents were. As we will discuss
in the next section, the lack of underrepresented and Black managers, agents, and publicists poses a
challenge for artists who clearly want to work with individuals whose identity is similar to their own.
15

#6 Underrepresented Talent are the Key to Creating Inclusive Teams

After identifying the inclusion profile of managers, agents, and publicists, we were curious whether
underrepresented artists were more likely to work with representatives from underrepresented
racial/ethnic groups. We bifurcated the sample into two groups to examine White artists versus
underrepresented artists. Then, we evaluated whether each artist had no representatives, one (or more)
representatives, or two or more representatives who were from underrepresented racial/ethnic groups.

Underrepresented artists were far more likely to have team members who were from underrepresented
racial/ethnic groups. As shown in Figure 15, more than 80% of underrepresented artists had at least one
manager, agent, or publicist from an underrepresented racial/ethnic group, while less than 20% of the
established underrepresented artists only had White team members. The opposite pattern was true for
White artists; three-quarters of White artists had no underrepresented team members. While not
shown in the figure, nearly two-thirds of underrepresented artists (62.4%) had two or more
underrepresented team members but only 2.7% of White artists did.

A similar pattern of results emerged when considering Black and non-Black artists, but differences were
more pronounced. As shown in Figure 15, most non-Black artists had no Black representatives. The
reverse was true for Black artists, who were more likely to have one or more Black team members. The
trend illustrated in Figure 16 continued when we examined whether artists had two or more Black team
members. Nearly half (49.1%) of Black artists but just 2.9% of non-Black artists had two or more Black
team members. It is clear that Black and underrepresented artists play a role in ensuring that Black and
underrepresented agents, managers, and publicists work in music. As we have reported in other parts of
the entertainment industry, the work of inclusion is often borne by underrepresented individuals rather
than by all, placing an unfair burden on these artists to both foster inclusion in these domains instead of
choosing from a myriad of qualified and available talent.
16

Finally, we examined whether artist gender influenced the composition of teams. Female artists were
more likely than male artists to have women representatives. A full 84.9% of women artists had at least
one woman agent, manager, or publicist compared to 70.8% of male artists. Though women continued
to work with other women-- 69.9% of women had two or more female representatives-- this was not
the case for men. The percentage fell to 38.7% of male artists with two or more women team members.
There were men and women artists with no women team members: 29.2% of male artists and 15.1% of
female artists. The data for artists and their teams reveals that artists’ identity is driving inclusive
choices in team composition.

Conclusion

Commitments, statements, and charitable giving are all important ways for companies to take action to
foster racial justice. However, change begins at home. To truly foster an equitable, inclusive industry,
companies must look carefully at the way they recruit, hire, and promote. This must extend to the way
positions are siloed or stereotyped, and how preference may be given to certain types of people or
experiences that facilitate movement up the proverbial corporate ladder. At the core, this examination
must include a careful look at the attributes and perceptions of leadership embraced by companies and
the people that inhabit these organizations.

The prototype for leadership across companies and industries continues to align with being White and
male.8 Scholars have demonstrated why and how this mental model is perpetuated-- from how
executive roles are defined, to the persistence of traditional gender norms, and stereotypes related to
race/ethnicity.9 Disrupting this cognitive profile is an essential step in diversifying the executive ranks at
corporations. Why? Because simply setting up a recruitment table at an HBCU and believing that this will
change an organization in the long run is more wishful thinking than effective strategy.

In fact, efforts that rely only on recruitment and little on culture change may be setting
underrepresented and Black executives up for failure. This may be particularly important for women,
and women of color, who face two outcomes that stymie their professional advancement. First,
managers seeking to hire or promote at the executive level may discount the skills and talents of women
because their behaviors do not align with historically masculine attributes. Second, women who do
embody more leadership-typical traits may be punished for their lack of adherence to a traditionally
feminine model of behavior.10 This puts women-- and women of color in particular-- in a double bind
regarding their behavior. They cannot be too masculine, and thus are passed over for leadership roles,
17

and they must be feminine enough (and adhere to a model of femininity that may not be culturally
specific) to align with gender roles.

The second cognitive impediment to change is an orientation that values social dominance. Theorists
have demonstrated that individual variation in this psychological characteristic can lead to a variety of
outcomes that make creating diverse and inclusive organizations extremely difficult.11 Namely,
individuals who value hierarchy and defer to the status quo (e.g., those who are ‘high’ in social
dominance orientation) -- independent of their race/ethnicity or gender -- may be more likely to recruit
and hire talent who perpetuate the existing organizational demographic profile. Moreover, those who
are attracted to organizations may be those who are high in social dominance orientation and will do
little to help foster change. This results in an organization that not only lacks inclusion, but one
composed of leaders who are most likely to find moving in an inclusive direction difficult.

How does an industry counter the cognitive and psychological biases that continue to thwart inclusion?
Not through statements and commitments. Instead, several steps must be taken across categories,
throughout executive ranks, and in partnership with artists and their teams (see Figure 17).

    ●   Adopt objective and measurable criteria. Companies can develop specific metrics that rely on
        objective and measurable criteria for managers to evaluate employee performance. This should
        counter the influence of cognitive templates and psychological resistance to inclusion.
        Organizations can also work with managers and evaluators to ensure that a sliding scale that
        favors particular employees is avoided.12

    ●   Provide flexible pathways for employees to reach the C-Suite. Not all employees will follow the
        same track to management, and some may need flexibility and development opportunities
        along the way. Rewarding the achievement of specific, measurable objectives rather than “face
        time” may serve to retain employees during child and family caregiving years. Additionally,
        giving potential leaders experience across different departments that will facilitate their growth
        is a key way to position people for future roles.

    ●   Companies can fast track executives through a system that provides support, mentorship, and
        opportunities for high-achieving talent. This includes hiring underrepresented and women
        executives using a cluster hire model. Strategies like this one are designed to hire women and
        people of color into organizations in a way that does not tokenize them and sets them up for
        success.
18
● Reduce and eliminate cultural and environmental cues that communicate stereotypes. The
experience of underrepresented and women employees in the workplace may be one that
includes repeatedly encountering stereotypes via situational cues, direct statements, or even
environmental signals, such as language and terminology in use across the industry. The
repeated psychological strain that this creates for employees may lead to disengagement or a
lack of desire to pursue leadership. Organizations can work with all employees on giving
feedback, affirming values, and supporting common goals that foster belonging. 13
Beyond general strategies that involve industry-wide change, organizations within different arenas of
the music business must develop sector-specific strategies. Solutions to increase the prevalence of
underrepresented executives cannot be a “one size fits all” proposition, and must account for unique
industry constraints. For example, radio and streaming companies had clear differences in the profile of
leadership in each domain. Thus, solutions for radio will be distinct from those in streaming
organizations. One such change could be to ownership regulations at the federal level. This might
encourage diversity in station ownership and resulting radio company executive ranks. This solution,
however, would not apply to internet-based music distribution platforms.
In the area of representation, it is critical to ensure the talent pipeline reaches talent. Qualified and
available agents, managers, and publicists from underrepresented racial/ethnic groups exist. Yet, the
evidence in this report suggests that these representatives may reach some Black or underrepresented
talent but rarely work on White artists’ teams. This makes inclusion in these roles both the problem and
responsibility of Black and underrepresented talent, instead of an industry-wide concern. Rather,
increasing the number of underrepresented and Black agents, managers, and publicists is needed
throughout the industry so that teams for underrepresented and White artists can benefit from the
knowledge and expertise of these team members.
A more diverse set of representatives has implications for other areas of the business. Publicists from
diverse backgrounds may be more likely to advocate for journalists and critics from underrepresented
communities. Agents may be more likely to book venues or work with suppliers and vendors that are
women or minority-owned. In other words, changing the constellation of who works closely with and
advocates for artists can have ripple effects throughout the industry at large. When everyone takes
responsibility and initiative to create inclusion, the add-on effects can impact more than one
organization or one sector of an industry.
Limitations
As with all research studies, a few limitations must be noted. First, much of the information on
executives was obtained via publicly available sources. Companies were given the opportunity to
participate and confirm information, especially of senior management teams. Roughly a dozen
companies did so. The vast majority did not. Transparency is an important value in creating change, and
something any company should consider when approached with requests like this. However, any errors
arising from these sources will necessarily impact the quality of the data in this study. While every effort
has been made to ensure that valid results are presented here, some discrepancies are inevitable.
Second, given that the data were collected throughout the Fall of 2020 and Spring of 2021, some
executives may have new positions, left the industry, or otherwise changed since the project began.
While efforts were made to confirm executives were still in their roles before publication, the data in
this report should be regarded as a snapshot of an industry at one point in time and updated19 accordingly. Finally, further work should examine the presence of underrepresented executives from other communities. While this study focused on the prevalence of Black executives, Hispanic/Latino, Asian/Pacific Islander, and Native/Indigenous executives also experience barriers and impediments in music. Extending the findings from this study to explore the prevalence of executives from these groups is imperative. Overall, despite these limitations, we believe this report offers a critical, timely examination of inclusion in music’s executive ranks, particularly in the absence of current data released by each company on its executive and management teams. Final Statement The lack of inclusion in the music industry is not the problem of one company or one sector. It involves the entire community of artists, executives, agents, managers, publicists, distributors, and even the audience. Thus, creating a more inclusive industry requires the insight, input, and effort of all. By identifying where problems are most pernicious and offering solutions, this report seeks to provide organizations with the opportunity to do more than perform inclusion-- we hope to see companies and people throughout the music business put effort and intention into making the industry one in which everyone can thrive.
20

                           APPENDIX A - Companies and Subsidiaries

300 Entertainment                   Disney Music Group’s             Premier Productions
313 Presents                        Hollywood Records                Primary Wave Music
4AD                                 Downtown Music                   Professional Facilities
AEG Presents                        Publishing                       Mgmt.
Alpha Media                         Educational Media                Provident Label Group
Amazon Music                        Foundation                       Pulse Music Group
Another Planet                      Elektra Music Group              RCA Inspiration
Entertainment                       Elektra Records                  RCA Records
Anthem Entertainment                Entertainment One Music          Republic Records
Apple Music                         Epic Records                     Reservoir Media
Arista Records                      Epitaph Records                  Roc Nation
Asylum Records                      Flicker Records                  Roc Nation Records
ATCO Records                        G-Squared Productions            Round Hill Music
Atlantic Records                    Glassnote Records                Saga Communications
Audacy                              Harvest Records                  Sire Records
Audiomack                           Hipgnosis                        SiriusXM’s Pandora
Beasley Broadcast Group             Hubbard Radio                    Sony Music Entertainment
Beaver Productions                  I.M.P.                           Sony Music Latin
Beggars Group                       iHeartMedia                      Sony Music Nashville
Big Loud Records                    Interscope Records               Sony Music Publishing
Big Machine Label Group             Island Records                   SoundCloud
Blue Note Records                   John Gore Organization’s         Spotify
BMG Rights Management               Broadway Across America          Sub Pop Records
BMLG Records                        Kobalt Publishing                Summit Media
Bonneville International            Live Nation                      The Valory Music Company
Corporation                         LiveXLive Media, Inc.            TIDAL
Canvasback Music                    Madison Square Garden            Townsquare
Capitol Christian Music             Entertainment                    UMG Nashville
Group                               Masterworks                      Universal Music Enterprises
Capitol Music Group                 Matador Records                  Universal Music Group
Cardenas Marketing                  Maybach Music Group              Universal Music Latin
Network                             MediaNet                         Entertainment
Cash Money Records                  Messina Touring Group            Universal Music Publishing
Columbia Nashville                  Mid-West Family                  Univision Communications
Columbia Records                    Broadcasting                     Inc
Concord Music Publishing            Motown Records                   Urban One
Concord Records                     MPL Music Publishing             Verve Label Group
Cox Media Group                     My Mixtapez                      VEVO
Cumulus Media                       Napster Group                    Warner Chappell Music
Curb | Word                         Nederlander Concerts             Warner Music Group
Entertainment/Curb                  Nonesuch Records                 Warner Music Latina
Records/Curb Word                   Notting Hill Music Group         Warner Music Nashville
Publishing                          Limited                          Warner Records
Decca Records US                    Outback Presents                 XL Recordings
Def Jam Recordings                  OWSLA                            YouTube Music
                                    Peermusic
21 Footnotes 1. The names and titles of over 4,000 executives across all categories were collected for this study. Outside of data provided by Universal Music Group (UMG), the gender of each executive (male, female, non-binary) was researched online using industry databases as well as publicly available information across news sources and social media. Individuals were categorized based on pronouns as well as gender expression. One executive identified as gender non-binary (they/them pronouns). Once all research methods were exhausted, attempts were made to contact executives directly via email or phone to request information regarding how they identify. Lastly, if these avenues did not yield a decision, gender was inferred based on first name. The racial/ethnic background was sought for each executive in the study across all categories. The same databases and outlets utilized for gender research were accessed to review information related to racial/ethnic identification. Individuals were categorized in two ways, first by underrepresented status (No=white, Yes=Black/African American, Hispanic/Latinx, Asian/Asian American, Native Hawaiian/Pacific Islander, Middle Eastern/North African and Multiracial/Multiethnic) and secondly as Black (Yes or No), alone or in combination with any other group (e.g., Multiracial). As detailed in other Annenberg Inclusion Initiative reports, we have established a high degree of confidence in deducing the underrepresented status of individuals using familial, biographical, visual, and group membership- based information. Statistically, we found a .90 correlation between the actual underrepresented status of series regulars and our research team’s judgements of the same individuals. Thus, we are assured in our data collection methodology related to these categories. It is important to note that when an executive’s race/ethnicity was impossible to ascertain, the judgment was rendered can’t tell. As with all our reports, these entries were excluded from the data file before analysis. Our undergraduate and graduate team consisted of a leadership group with 6 individuals who helped oversee multiple facets of the investigation and assisted the larger research team. Five of these leading research assistants were women and 1 was male. In terms of race/ethnicity, 4 were Black/African American, 1 was Hispanic/Latinx, and 1 was Asian. Including the leadership group, a total of 21 female and 8 male undergraduate and graduate research assistants contributed to the data collection and 21 out of the 29 were part of an underrepresented racial/ethnic group. The breakdown of race/ethnicity is as follows: 8 (27.6%) were White, 7 (24.1%) Black/African American, 1 (3.5%) Hispanic/Latinx, and 13 (44.8%) Asian. These numbers and percentages do not include the full time staff at the Initiative who contributed to this project. Including our leaders would only increase the diversity of the larger team. 2. Music Groups consisted of the “Big Three” (i.e., Universal Music Group, Sony Music Entertainment, Warner Music Group) major music companies. To capture labels, we assessed US-based labels and label groups associated with the Big Three. To gather the independent labels we used a Billboard published ranking of 12 independent companies, compiled with Nielsen financial data, based on revenue generated in 2018. Independent labels may have deals or agreements with the three major music companies but are understood to operate separately from them and are not majority-owned by SME, UMG, or WMG. Depending on the source, the independent status of labels may not be fully clear. For example, the ownership status of the top ‘independent’ label according to Billboard (Cash Money) was contested in court. We subsumed Cash Money under UMG and not as an independent label in all analyses. In addition to the 11 on the Billboard list, we sought the expertise of 4 notable music agents from CAA, WME, UTA and Paradigm. Upon their confirmation of the indie label list, they offered insight on independent publishing as well as additional companies to examine. This translated into 2 additional independent labels as part of our examination, thus bringing the final total of independent label groups to 13. In totality, here is the list of the 38 labels and label groups (including subsidiaries) assessed in this study: UMG (Capitol Music Group, Cash Money Records, Def Jam Recordings, Interscope Records, Island Records, Republic Records, Universal Music Enterprises, UMG Nashville, Universal Music Latin Entertainment, Verve Label Group), SME (Arista Records, Columbia Records, Epic Records, Masterworks, Provident Label Group, RCA Inspiration, RCA Records, Sony Music Latin, Sony Music Nashville), WMG (Atlantic Records, Elektra Music Group, Nonesuch
22

Records, Warner Music Latina, Warner Music Nashville, Warner Records), 300 Entertainment, Beggars Group, Big
Loud Records, Big Machine Label Group, BMG Rights Management, Concord Records, Curb Records, DMG’s
Hollywood Records, Entertainment One Music, Epitaph Records, Glassnote Records, Roc Nation, and Sub Pop.

The music publishing companies included the Big Three and 15 independents. To collect the sample of the top
independent publishing companies (in terms of revenue), we sought the expertise of one notable music industry
news veteran who provided a list of companies and their estimated annual revenue in 2019. This list was verified
with popular press articles and the volume of titles per company in music repertoires. The group of radio
broadcasting companies was based on the 2020 list of U.S. music stations whose ratings and audience are
measured by Nielsen. Quantifying the number of stations per company, the 15 top companies broadcasting
programmed music content were sampled for this sector. Public sources corroborated the 3 companies identified
as the ‘major’ radio companies in this particular sector. The remaining 12 companies were designated as
‘independent.’ Sirius was not included in this sector as the focus was on terrestrial rather than satellite radio.

For the music streaming service companies, we began with the list of 15 web-based platforms for on-demand
music content studied by MRC Data (2020), which account for roughly 95% of the U.S. market share. One company
on the list had sunsetted (Google Play) and another was nested inside a radio company (iHeartRadio) thereby
reducing the sample to 13 streaming companies. Information gathered from press outlets was used to categorize
the four ‘major’ companies in the streaming sector (Apple Music, Amazon Music, Google’s YouTube Music, &
Spotify) versus the 9 independent streaming platforms. Lastly, the live music sector consisted of the 2 major
conglomerates Live Nation and AEG Presents in addition to 13 independent U.S.-based concert promotion
companies. The 15-company sample was based on data from Pollstar’s rank of the 100 top promoters by the
number of tickets sold worldwide in 2019. Independent companies were defined by their lack of association with
major conglomerates Live Nation and AEG, who own subsidiaries that oversee a majority of live concerts. The
companies on the list were sorted from highest to lowest gross revenue to compose the list of 15 companies. Live
music promoters based outside of the U.S. as well as companies that did not primarily present live music
performances were not included in this sector.

3. Data were collected across all companies between October, 2020 and May of 2021. Three passes were made
across each company by research assistants, with accuracy-checking and adding additional information in each
examination. Attempts were made to contact the more than 70 companies in the sample and verify executive
listings (names, titles) - roughly a dozen companies responded and provided confirmation of their executives.

4.Smith, S., Pieper, K., Choueiti, M., Hernandez, K., & Yao, K. (2021, March). Inclusion in the Recording Studio?
Gender and Race/Ethnicity of Artists, Songwriters & Producers across 900 Popular Songs from 2012-2020. USC
Annenberg; USC Annenberg Inclusion Initiative. https://assets.uscannenberg.org/docs/aii-inclusion-recording-
studio2021.pdf U.S. Census Bureau (n.d.) Quick Facts: Population Estimates. Retrieved May 27, 2021 from
https://www.census.gov/quickfacts/fact/table/US/PST045219
The National Center for Education Statistics. (2019). Awards/degrees conferred by program , award level, race/
ethnicity, and gender: July 1, 2018 to June 30, 2019. National Center for Education Statistics (NCES); The US
Department of Education. https://nces.ed.gov/ipeds/datacenter/DataFiles.aspx

5. U.S. Census Bureau (n.d.) Quick Facts: Population Estimates. Retrieved May 27, 2021 from
https://www.census.gov/quickfacts/fact/table/US/PST045219

6. The artists featured on the websites or publicly available reports of the major and independent labels and label
groups were collected to compose the sample for this investigation. All sub-labels and imprints of the labels in the
sample were sourced for their artist rosters and added to their respective label group. Research assistants
gathered the gender and racial/ethnic identity of each individual musician (including members of duos and groups)
consistent with the methodology described above. Data was collected between October and November of 2020,
and a final check was completed in December of 2020.
23

Research assistants searched for information regarding each artist’s manager, agent, and publicist identity. Names
and titles were gleaned from the artist’s and label’s websites, social media, press releases, news articles, as well as
industry sources (e.g., BookingAgentInfo.com). When information was not available, research assistants
communicated directly with any contacts associated with artists or their companies to determine artist
representation. In line with the methodology described above, research assistants determined the gender and
racial/ethnic identity of each representative. Furthermore, we gathered the current employer of each
representative or determined that they were self-employed. Representatives in publicity that were working for
record companies were considered ‘in-house’ and excluded from publicist analyses. At times, individuals held
multiple roles when representing artists (e.g., Manager & Publicist). These individuals were counted only once
across an artist's team when examining the makeup of each artist's representation.

7. Smith, S., Pieper, K., Choueiti, M., Hernandez, K., & Yao, K. (2021, March). Inclusion in the Recording Studio?
Gender and Race/Ethnicity of Artists, Songwriters & Producers across 900 Popular Songs from 2012-2020. USC
Annenberg; USC Annenberg Inclusion Initiative. See https://assets.uscannenberg.org/ docs/aii-inclusion-recording-
studio2021.pdf

8. Rosette, A.S., Leonardelli, G.J., & Phillips, K.W. (2008). The white standard: Racial bias in leader categorization.
Journal of Applied Psychology, 93(4), 758-777.

9. Eagly, A.H., & Karau, S. J. (2002). Role congruity theory of prejudice toward female leaders. Psychological
Review, 109(3), 573.

10. Eagly & Karau (2002).

11. Umphress, E.E., Smith-Crowe, K., Brief, A.P., Dietz, J., & Watkins, M.B. (2007). When birds of a feather flock
together and when they do not: status composition, social dominance orientation, and organizational
attractiveness. Journal of Applied Psychology, 92(2), 396.

12. Uhlmann, E.L. & Cohen, G.L. (2005). Constructed criteria: Redefining merit to justify discrimination.
Psychological Science, 16(6),474-480.

13. Casad, B. J., & Bryant, W. J. (2016, January 20). Addressing Stereotype Threat is Critical to Diversity and
Inclusion in Organizational Psychology | Psychology. Frontiers in Psychology; Frontiers in Psychology.
https://www.frontiersin.org/articles/10.3389/fpsyg.2016.00008/full

Some graphics in this publication use images sourced from: https://www.vecteezy.com/free-vector/mic
24

                                               Acknowledgements

An undertaking of this measure requires substantial input and assistance. We are greatly indebted to a number of
people who provided their help, insight, and advice over the past year, and whose enthusiasm for this project
sustained us. Gratitude goes to our longtime partners at Universal Music Group, including Sir Lucian Grainge, Eric
Hutcherson, Will Tanous, Jeffrey Harleston, Ethiopia Habtemariam, Jody Gerson, Liliahn Majeed, Peggy Huck,
Annie Innamura, Eric Berman, and many others whose comments, questions, and commitment to this work have
been invaluable to this project and so many others in the space.

Our regular team of music informants and supporters also played a role, including Samantha Kirby Yoh, Vivien
Lewit, Marlene Tsuchi, Lara Christie, Ally Glerum, and others who we pestered, cajoled, or begged for help in the
course of the last year. Your assistance made this project stronger, as always we are grateful for it! We also
contacted many, many companies, individuals, and team members with requests to confirm information and we
offer our sincere thanks to those who took the time to reply and provide their help.

Finally, our team at USC Annenberg remains a group of individuals whose commitment, passion, and curiosity fuel
our ongoing work. Even though this project was conducted without the benefit of being in a shared space, the
camaraderie you brought to this effort was a bright spot. Thank you to our staff team who pitched in where they
could, including Ariana Case and Kevin Yao even in the midst of your other work.

Special distinction goes to Karla Hernandez and Zoily Mercado whose work on this project ensured both its
completion and its quality.

Finally, to our team of students, who we hope to share this report with in person at some point—thank you!

                  Barbara Rasin                                                   Stacy Gunarian
                   Katie Sunada                                                      Ha Hoang
                    Josie Bullen                                                    Justin Marks
                     Evelyn Luo                                                   Drew Norman
                   Brandon Tam                                                       Erin Ewalt
                     Yasuko Yui                                                      Wendy Liu
                  Matt Garfinkel                                               Elizabeth Berkovich
                    Lisi Schauer                                                   Kenneth Yim
                  Maria Takigawa                                                   Jenna Richter
                   Elizabeth Lee                                                    Aron Cohen
You can also read