Integrating inflammatory serum biomarkers into a risk calculator for prostate cancer detection
←
→
Page content transcription
If your browser does not render page correctly, please read the page content below
www.nature.com/scientificreports
OPEN Integrating inflammatory serum
biomarkers into a risk calculator
for prostate cancer detection
Amirhossein Jalali1,2,3,8*, Michael Kitching1,4,8, Kenneth Martin5, Ciaran Richardson5,
Thomas Brendan Murphy6, Stephen Peter FitzGerald7, Ronald William Watson1,2,8 &
Antoinette Sabrina Perry1,4,8
Improved prostate cancer detection methods would avoid over-diagnosis of clinically indolent
disease informing appropriate treatment decisions. The aims of this study were to investigate the
role of a panel of Inflammation biomarkers to inform the need for a biopsy to diagnose prostate
cancer. Peripheral blood serum obtained from 436 men undergoing transrectal ultrasound guided
biopsy were assessed for a panel of 18 inflammatory serum biomarkers in addition to Total and Free
Prostate Specific Antigen (PSA). This panel was integrated into a previously developed Irish clinical
risk calculator (IPRC) for the detection of prostate cancer and high-grade prostate cancer (Gleason
Score ≥ 7). Using logistic regression and multinomial regression methods, two models (Logst-RC
and Multi-RC) were developed considering linear and nonlinear effects of the panel in conjunction
with clinical and demographic parameters for determination of the two endpoints. Both models
significantly improved the predictive ability of the clinical model for detection of prostate cancer
(from 0.656 to 0.731 for Logst-RC and 0.713 for Multi-RC) and high-grade prostate cancer (from
0.716 to 0.785 for Logst-RC and 0.767 for Multi-RC) and demonstrated higher clinical net benefit.
This improved discriminatory power and clinical utility may allow for individualised risk stratification
improving clinical decision making.
Prostate cancer (PCa) is the most common non-cutaneous cancer in men in the Western w orld1. A prostate tissue
biopsy is a key step in the diagnosis of PCa. However the decision to refer a patient for a biopsy is challenging, as
TRUS biopsies are associated with significant morbidity2. Clinicians usually base this decision on serum prostate
specific antigen (PSA), abnormal digital rectal exam (DRE)3 and increasingly multiparametric magnetic reso-
nance imaging (mpMRI) as well as other factors, such as family history and previous biopsy results. PSA lacks
specificity1 and has led to over-diagnosis and over-treatment of clinically indolent disease and a large number
of unnecessary biopsies in m en4 and the mpMRI PROMIS trial did show that there is still a chance of missing
clinically significant disease at PI-RADS scores of 1 or 2 5.
Improved detection methods for high-grade significant disease that would reduce unnecessary biopsies are
highly sought. Risk stratification of men suspected of PCa and high-grade significant disease would allow clini-
cians and patients to make a more informed decision on whether or not to biopsy. Risk calculators that utilise
patient clinical data have already been developed for cardiovascular disease6 and stroke7. There are several guide-
lines which suggest a risk adapted approach that considers clinical information along with serum PSA should be
used to predict PCa risk8. Previous risk calculators have been developed and assessed such as the European Ran-
domised Study of Screening for Prostate Cancer Risk Calculator (ERSPC-RC)9 and the Prostate Cancer Preven-
tion Trial Risk Calculator (PCPT-RC)10,11 in large multi-institutional cohorts. However, the accuracy of the risk
score nomograms to detect high grade cancer (Gleason score ≥ 7) are ~ 69–79% for both PCPT and the ERSPC.
The use of multiple serum biomarkers may be the key to improving the identification of significant disease.
Commercial tests that utilise serum biomarkers are already on the market, such as the Prostate Health Index
1
UCD Conway Institute of Biomedical and Biomolecular Science, Dublin, Ireland. 2UCD School of Medicine,
University College Dublin, Dublin, Ireland. 3School of Mathematical Sciences, University College Cork, Cork,
Ireland. 4UCD School of Biology and Environmental Science, University College Dublin, Dublin, Ireland. 5Randox
Teoranta, Co, Donegal, Ireland. 6School of Mathematics and Statistics, University College Dublin, Dublin,
Ireland. 7Randox Laboratories Ltd, 55 Diamond Road, Crumlin, Co., Antrim BT29 4QY, Ireland. 8These authors
contributed equally: Amirhossein Jalali, Michael Kitching, Ronald William Watson, and Antoinette Sabrina
Perry. *email: amir.jalali@ucc.ie
Scientific Reports | (2021) 11:2525 | https://doi.org/10.1038/s41598-021-81965-3 1
Vol.:(0123456789)www.nature.com/scientificreports/
All Patients Biopsy positive Biopsy negative P Value High-grade PCa Low-grade PCa P Value
Patients, n (%) 436 211 (48.4) 225 (51.6) 146 (69.2) 65 (30.8)
Age in years
Median 63.9 65.2 63.2 0.096† 65.6 62.2 0.045†
Mean 63.3 63.8 62.8 0.156* 64.4 62.2 0.051*
Range (41.70–84.96) (41.70–84.96) (41.77–79.13) (41.7–85.0) (45.6–77.0)
DRE, n (%)
Normal 263 (60.3) 110 (52.1) 153 (68.0) 0.002¥ 70 (48.0) 40 (61.5) 0.184¥
Not recorded 9 (2.1) 7 (3.3) 2 (0.9) 5 (3.4) 2 (3.1)
Abnormal 164 (37.6) 94 (44.6) 70 (31.1) 71 (48.6) 23 (35.4)
PSA in ng mL−1
Median 6.5 7.0 6.0 < 0.001† 8.2 5.9 < 0.001†
Mean 14.0 21.9 6.6 28.4 7.0
Range (0–1,400) (0–1,400) (0.5–31.40) 0.027* (0–1,400) (0.54–29.3) 0.032*
Family history of PCa, n (%)
Positive 75 (17.2) 4 (20.9) 31 (13.8) 0.067¥ 33 (22.6) 11 (16.9) 0.451¥
Negative 361 (82.8) 167 (79.1) 194 (86.2) 113 (77.4) 54 (83.1)
Previous negative biopsy, n (%)
Yes 87 (20.0) 29 (13.7) 58 (25.8) 0.002¥ 17 (11.6) 12 (18.5) 0.266¥
No 349 (80.0) 182 (86.3) 167 (74.4) 129 (88.4) 53 (81.5)
Gleason score, n (%)
6 – 63 (29.9) – – – 63 (100) –
7 99 (46.9) – 99 (67.8) –
8 26 (12.3) – 26 (17.8) –
9 20 (9.5) – 20 (13.7) –
10 3 (1.4) – 3 (2.1) –
Table 1. Clinical Features of the Patient Cohort. *Student’s T-test. ¥ Pearson’s chi squared test. † Wilcoxon Rank
test.
(PHI)12, which comprises total PSA, free PSA and [-2] p roPSA13 and the 4 K score, which assesses total PSA,
free PSA, intact PSA, and human kallikrein-related peptidase 214. Although promising, these commercial tests
are currently not widely routinely used, as there is still uncertainty as to their utility and interpretation in a
clinical setting. Previous studies have shown that the inclusion of serum and Urine biomarkers improves on risk
calculators. Our own studies have shown that the addition of the PHI score to an Irish clinical risk calculator
improved the accuracy of the Irish risk c alculator15. The urinary biomarkers prostate cancer antigen 3 and the
gene fusion product of transmembrane protease serine 2 with the transcription factor v-ets erythroblastosis virus
E26 oncogene homolog (TMPRSS2-ERG) also improved the accuracy of ERSPC-RC16. It is clear that the use of
multiple biomarkers improves on the accuracy of risk calculators.
It is well recognised that inflammation plays a causal role in the development of several types of cancer17
and there is direct evidence of an inflammatory m icroenvironment18 and higher inflammatory marker levels
effecting a greater PCa r isk19. This environment is associated with impaired differentiation of prostate epithelial
cells20 and aberrant basal to luminal differentiation promoting cancer i nitiation21.
The aim of this study was to investigate the utility of inflammatory serum biomarkers combined with clinical
information for the detection of (i) PCa and (ii) high-grade PCa in patients that are suspected of having PCa.
Materials and methods
Patient cohort and sample collection. The study cohort consisted of 436 Caucasian Irish men referred
for a TRUS biopsy on the basis of an elevated PSA and/or abnormal DRE between April 2012 and June 2016.
Blood samples (9 mL) were collected in a serum separator tube prior to biopsy and processed within 3 h of col-
lection. Samples were centrifuged at 1500×g for 15 min at room temperature. Serum (~ 3 mL) was removed and
stored at − 80 °C until further analysis. Patients were classified as either biopsy-negative (having no detectable
PCa) or biopsy-positive (having detectable PCa) and further sub-divided into low-grade (Gleason score 6) and
high-grade (Gleason score 7 or above)15 disease. The clinicopathologic details of the cohort are summarised in
Table 1.
Sample collection and processing were ethically approved by the St James Hospital and Mater Misericordiae
University Hospital ethics committees. The patient information leaflet and consent form were written and con-
structed in line with best practice and the EU Data protection Directive and Data protection Acts 1988 and 2018
and approved by the two ethics committees. All patients gave written informed consent agreeing to participate
in the study. All steps were carried out in accordance with national guidelines and regulations.
Scientific Reports | (2021) 11:2525 | https://doi.org/10.1038/s41598-021-81965-3 2
Vol:.(1234567890)www.nature.com/scientificreports/
Biomarker analysis. In total, analysis of 20 biomarkers was performed. The Evidence Investigator platform
(Randox) uses sandwich chemiluminescent immunoassay methods for the simultaneous detection of multiple
analytes. Two multiplexed Evidence Investigator biomarker panels were employed; the Cytokine and Growth
Factors High Sensitivity Array (Cat. No. EV 3623) for IL-1α, IL-1β, IL-2, IL-4, IL-6, IL-8, IL-10, VEGF, IFN-
γ, TNF-α, MCP-1 and EGF22 and the Adhesion Molecules Array (Cat. No. EV3519) for VCAM-1, ICAM-1,
E-Selectin, P-Selectin, L-Selectin23. Biochip analyses were performed according to the manufacturer’s instruc-
tions. Briefly, serum samples diluted where appropriate, reconstituted calibrators and assay specific quality con-
trols utilised in duplicate were incubated on the biochip. Following washing, detector conjugate solution was
applied to the biochip and binding was revealed using chemiluminescent detection. Concentration of all ana-
lytes in the samples were calculated using a nine-point calibration curve by the Evidence Investigator analyser.
Individual assay runs were deemed to have passed if the measured values for the quality control samples were
within the specified range for each of the target values for each analyte, as per kit instructions. Values measured
below the lower limit of detection were taken as zero.
IL-18 was measured in all serum samples by ELISA (Cat. No. ILE10068, Randox) according to the manufac-
turer’s instructions. Serum samples, calibrators and quality control samples were added to each well in duplicate.
The IL-18 standard provided in the kit was reconstituted in deionised water to make up the calibrators and the
two quality control samples (312.5 pg mL−1 and 56.25 pg mL−1). Total PSA and Free PSA were determined in
all samples using the Roche COBAS 8000 system according to manufacturer’s instructions at Randox Clinical
Laboratory Services (Antrim, UK).
Even though PSA values were available for each patient we included its analysis as the patients were recruited
from different clinics and the pre-biopsy PSA values attained using various platforms. Therefore, serum PSA of
the patients were reanalysed on the single platform.
Clinical information: Age, Family history, DRE and prior negative biopsy were collected as part of the study
from the patients chart or at time of recruitment.
Statistical analysis. Basic analysis of patient information. Basic statistical analysis of the study popula-
tion’s characteristics was performed using GraphPad Prism (ver. 5.0). Descriptive statistics were performed in
the dataset, which was divided into those with and without a PCa diagnosis and high-grade PCa (> = Gleason 7)
versus all other patients. The unpaired Student’s t-test and the Wilcoxon Rank test were used to investigate the
significant difference in means and medians of continuous variables, respectively. Pearson’s chi-squared test was
also performed to studying the significant difference for categorical variables.
Risk calculator model development and performance. Development of the risk calculator for the prediction
of PCa and high-grade PCa were performed in R software version 3.4.324. Logistic and multinomial regres-
sion methods were used to model the linear and nonlinear effects of serum biomarkers combined with clinical
information (age, DRE, family history of PCa, previous negative biopsy). These two modelling strategies are
considered as relevant approaches to stratify patients to high-grade PCa, low-grade PCa or those without PCa.
The stepwise method was applied as the variable selection technique to integrate potentially relevant biomarkers
into the risk calculator. In both methods, the probabilities for each patient were modelled through the log odds
of risk factors which were then transformed into probabilities and assigned a percentage risk for each patient.
Internal validation is built into the cross-validation approach to prevent overfitting of the data by using tenfold
cross validation.
The final models for diagnosis of PCa and/or high-grade PCa were compared to the Irish prostate risk
calculator (IPRC) which has been previously developed and outperformed the available risk calculators in the
Irish population25. Accuracy of the models was determined using the area under the curve (AUC) calculated
from the Receiver Operator Curve (ROC) by plotting the sensitivity and specificity at each of its risk thresholds.
Comparison of ROC curves took place via the method described by DeLong et al.26. Decision-curve analysis
was undertaken to examine the potential net benefit of the application of each model over the benefit offered by
the strategies of performing a biopsy in all patients and performing a biopsy in n one27. Calibration plots were
plotted to represent the agreement between the observed incidence of cancer visually and predicted r isk28. The
Chi-Square Hosmer–Lemeshow test was used to assess the goodness of fit of models, where a p < 0.05 indicates
a poor agreement between the predicted risk and observed incidence of cancer and a poorly calibrated model.
Results
Baseline cohort characteristics. This was a retrospective biomarker study intended to improve the detec-
tion of clinically relevant disease. The clinical endpoint of the study was the histopathological findings from the
TRUS biopsy. The study cohort consisted of 436 patient biopsies, of which 211 (48%) were diagnosed with PCa
with different Gleason scores (Table 1).
In Table 1, the univariate effects of ’DRE’ and ’Previous negative biopsy’ were statistically significant in
detecting PCa, and ’age’ for detecting high-grade PCa. The effect of ’PSA’ was also significant in both cases. This
implies that if patients are older, have higher PSA, abnormal DRE or did not have a previous negative biopsy,
(on average) they have more chance of PCa and high-grade PCa.
Statistical modelling. Descriptive analysis of all biomarkers assessed is presented in Table 2.
Integrating serum biomarkers with the clinical risk factors using multinomial and logistic models identified 8
biomarkers (TNFα, VEGF, IL1α, IL1β, ICAM-1, E-selectin, P-selectin, L-selectin) with 4 (IL1α, IL1β, E-selectin,
P-selectin) biomarkers identified in both models, to confer significant additional predictive ability. Two separate
risk calculators were developed to predict PCa and high-grade PCa using a multinomial model (Multi-RC) and a
Scientific Reports | (2021) 11:2525 | https://doi.org/10.1038/s41598-021-81965-3 3
Vol.:(0123456789)www.nature.com/scientificreports/
High-grade PCa
Median (IQR) All patients (n = 436) Biopsy positive (n = 211) Biopsy negative (n = 225) P Value (n = 146) Low-grade PCa (n = 65) P Value
tPSA (ng mL−1) 6.28 (4.87) 7.15 (5.72) 5.51 (4.13) < 0.001 7.92 (9.11) 5.69 (3.10) < 0.001
fPSA (ng mL−1) 1.02 (0.95) 1.03 (1.20) 1.01 (0.82) 0.112 1.10 (1.69) 0.85 (0.65) 0.017
IL-1α (pg mL−1) 0.09 (0.14) 0.09 (0.14) 0.09 (0.16) 0.655 0.09 (0.14) 0.09 (0.14) 0.988
IL-1β (pg mL−1) 0.44 (0.75) 0.49 (0.80) 0.16 (0.73) 0.389 0.44 (0.75) 0.56 (0.82) 0.253
IL-2 (pg mL−1) 0.0 (1.15) 0.0 (1.08) 0.0 (1.21) 0.645 0.0 (1.14) 0.0 (0.98) 0.916
IL-4 (pg mL−1) 1.33 (0.57) 1.34 (0.56) 1.28 (0.58) 0.730 1.36 (0.62) 1.28 (0.45) 0.074
IL-6 (pg mL-1) 1.12 (1.05) 1.16 (1.26) 1.04 (0.88) 0.069 1.34 (1.51) 0.95 (0.51) 0.005
IL-8 (pg mL−1) 7.24 (5.17) 7.38 (5.07) 7.05 (5.18) 0.395 7.60 (4.78) 6.86 (5.23) 0.176
IL-10 (pg mL−1) 0.54 (0.34) 0.57 (0.33) 0.51 (0.35) 0.145 0.56 (0.32) 0.59 (0.40) 0.911
IL-18 (pg mL−1) 185 (165) 193 (148) 179 (174) 0.216 205 (152) 179 (105) 0.105
VEGF (pg mL−1) 72.1 (78.9) 76.3 (78.6) 68.2 (80.0) 0.193 78.8 (80.2) 75.6 (69.8) 0.630
IFN-γ (pg mL−1) 0.18 (0.30) 0.18 (0.31) 0.18 (0.28) 0.242 0.20 (0.22) 0.16 (0.29) 0.208
TNF-α (pg mL−1) 1.92 (0.90) 1.94 (0.84) 1.86 (0.95) 0.391 1.98 (0.88) 1.82 (0.77) 0.391
MCP-1 (pg mL−1) 155 (96.1) 154 (97.9) 155 (94.9) 0.751 150 (92.2) 166 (117) 0.350
EGF (pg mL−1) 5.34 (12.8) 5.82 (12.4) 4.64 (13.4) 0.794 5.51 (12.9) 6.48 (10.2) 0.630
VCAM-1 (ng mL−1) 645 (211) 666 (212) 635 (199) 0.121 692 (208) 612 (190) 0.016
ICAM-1 (ng mL−1) 272 (80.6) 275 (76.2) 270 (78.9) 0.283 283 (79.2) 265 (66.7) 0.010
E-Selectin (ng mL−1) 23.3 (10.7) 25.2 (12.9) 22.7 (9.47) 0.016 26.4 (12.5) 22.3 (10.9) 0.027
P-Selectin (ng mL−1) 164 (60.8) 197 (50.5) 192 (72.8) 0.301 198 (51.0) 193 (46) 0.993
L-Selectin (ng mL−1) 896 (230) 898 (214) 894 (251) 0.977 899 (210) 890 (207) 0.486
Table 2. Descriptive analysis of serum biomarkers (median and interquartile range) grouped by biopsy and
grading outcomes. The p-value of Wilcoxon Rank test indicates whether the observed differences in median for
each biomarker is significant.
logistic model (Logst-RC) where Table 3 presents the models and Table 4 evaluates the model performances. We
also built models using the biomarkers alone for both the multinomial model (Multi-bio) and a logistic model
(Logst-bio) presented in Table 4 which showed no significant improvement over the clinical model (IPRC).
The odd ratios of the Multi-RC model for detecting low-grade (column A) and high-grade PCa (column B)
compared to not detecting PCa are presented in Table 3. We combined odd ratios of low grade and high grade
PCa to evaluate the performance of the Multi-PC model for detecting PCa and High-grade PCa and these are
presented in Table 4 and show a significant improvement above the IPRC model. The model variables consist
of Age, DRE, Family History, previous biopsy, PSA, TNF-a, IL-1a, IL-1b, ICAM-1, E-Selectin, P-Selection, Free
PSA (FPSA) and Free to total PSA (FTPSA).
The odd ratios of the Logst-RC model for detecting PCa compared to not detecting PCa (column C) and
detecting high-grade PCa compared to low-grade or not detecting PCa (column D) are presented in Table 3.
The model performance for detecting PCa and High grade PCa are presented in Table 4 and showed a significant
improvement above the IPRC model. The model variables consist of Age, DRE, Family History, previous Biopsy,
PSA, VEGF, IL-1a, IL-1b, E-Selectin, P-Selectin, L-Selectin and FPSA.
To give some insight into the clinical significance of the study, we selected thresholds manually based on
the Youden index criteria. Using the threshold of 0.3 for high-grade Logst-RC (and the threshold of 0.275 for
high-grade Multi-RC) with would have resulted in saving 71.2% (72.6%) of the biopsies at the cost of delaying
the diagnosis of 27.9% (33.8%) of the high-grade cancers. The negative predictive value of the test results below
this threshold would be 0.833 (0.828).
Model performance. Table 4 represents the discriminative abilities of both risk calculators for the diagno-
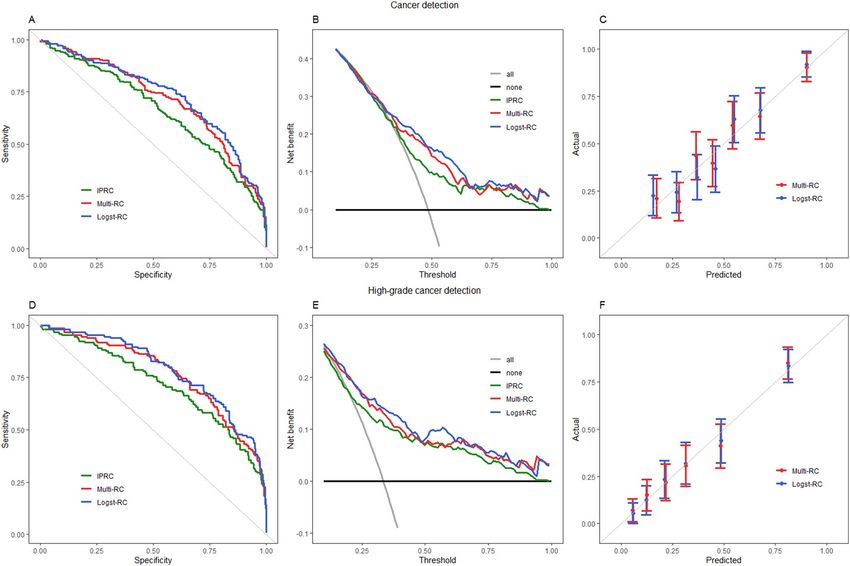
sis of PCa and high-grade PCa using AUC. Multi-RC showed an AUC of 0.7126 and 0.7671 and Logst-RC an
AUC of 0.7308 and 0.7847 for diagnosis of PCa and high-grade PCa respectively. This significantly improved the
predictive ability of the IPRC model, as demonstrated in the ROC in Fig. 1A,D.
Figure 1 shows the decision curve analyses of the clinical utility of both models in detecting PCa (Fig. 1B) or
high-grade PCa (Fig. 1E). For detecting PCa there was an improved net benefit for the threshold ranges of 0.35
to 1.0 and for detecting high-grade PCa there was an improved net benefit for the threshold ranges of 0.15 to 1.0
compared to the IPRC—clinical model alone. The calibration curves (Fig. 1C,F) show good agreements between
predicted probabilities and the actual outcome indicating that all models are well calibrated, which have been
confirmed by the (non-significant) Hosmer–Lemeshow results.
Integrating the panel of serum biomarkers with the clinical risk factors outperform the previously developed
Irish risk calculator25. Logst-RC has shown slightly higher improvement when internally validated; however, fur-
ther validation in an independent cohort will be required in order to confirm improvements and identify the most
appropriate model and could be employed to select the best clinically accepted threshold to be used in practice.
Scientific Reports | (2021) 11:2525 | https://doi.org/10.1038/s41598-021-81965-3 4
Vol:.(1234567890)www.nature.com/scientificreports/
Multi-RC (A) Multi-RC (B) Logst-RC (C) Logst-RC (D)
Odds ratio Std. Error p-value Odds ratio Std. Error p-value Odds ratio Std. Error p-value Odds ratio Std. Error p-value
Age 0.997 0.023 0.884 1.031 0.020 0.137 1.021 0.017 0.238 1.038 0.020 0.058
DRE (Abnormal) 1.203 0.324 0.569 1.545 0.276 0.115 1.498 0.240 0.093 1.501 0.265 0.125
DRE (Missing) 4.084 1.051 0.181 2.790 1.016 0.313 3.250 0.949 0.214 1.659 0.905 0.576
Family history (Posi-
1.339 0.408 0.475 1.341 0.342 0.392 1.251 0.296 0.450 1.303 0.322 0.412
tive)
Previous biopsy (Yes) 0.605 0.385 0.192 0.318 0.344 < 0.001 0.426 0.284 0.003 0.366 0.333 0.003
TNFα 0.213 0.891 0.083 1.022 0.075 0.770 – – – – – –
TNFα¥ 22.06 1.848 0.094 1.108 0.178 0.564 – – – – – –
VEGF – – – – – – – – – 1.003 0.002 0.104
VEGF¥ – – – – – – 1.214 0.108 0.073 – – –
IL1α 1.605 0.282 0.093 1.578 0.258 0.077 1.527 0.253 0.095 – – –
IL1α¥ 0.921 0.072 0.257 0.856 0.065 0.017 0.894 0.055 0.041 – – –
IL1β¥ 1.115 0.049 0.028 1.057 0.042 0.193 1.068 0.036 0.06 – – –
ICAM-1 0.954 0.004 < 0.001 0.991 0.002 < 0.001 – – – – – –
ICAM-1¥ 89,574.6 0.409 < 0.001 11.806 0.341 < 0.001 – – – – – –
E-selectin 1.006 0.020 0.768 1.052 0.016 0.001 1.029 0.013 0.029 1.052 0.014 < 0.001
P-selectin 1.004 0.003 0.232 0.996 0.003 0.129 0.983 0.009 0.084 0.995 0.003 0.057
P-selectin¥ – – – – – 22.22 1.963 0.114 – – –
L-selectin – – – – – – 0.993 0.003 0.037 0.993 0.003 0.028
L-selectin¥ – – – – – – 404.6 2.961 0.043 1088.2 3.213 0.030
FPSA 0.813 0.510 0.685 1.634 0.345 0.155 – – – 1.709 0.303 0.077
FPSA¥ 1.056 0.394 0.891 0.487 0.319 0.024 0.285 0.277 < 0.001 0.103 0.474 < 0.001
TPSA – – – – – – 1.092 0.041 0.034 – – –
TPSA¥ 1.357 0.238 0.200 2.704 0.238 < 0.001 3.400 0.384 0.001 11.43 0.342 < 0.001
FTPSA¥ 0.778 0.307 0.414 0.180 0.252 < 0.001 – – – – – –
Table 3. Summary of Multi-RC and Logst-RC models using odds ratio, standard error and p-value for each
risk factor in the model. ¥ The non-linear effect of the predictor using a log transformation.
Risk calculators AUC 95% CI P-value (compared to IPRC)
IPRC
PCa 0.656 (0.609–0.711) –
High-grade PCa 0.716 (0.663–0.769) –
Multi-bio
PCa 0.686 (0.637–0.735) 0.392
High-grade PCa 0.749 (0.701–0.798) 0.271
Logst-bio
PCa 0.708 (0.659–0.756) 0.127
High-grade PCa 0.770 (0.724–0.816) 0.068
Multi-RC
PCa 0.713 (0.664–0.761) 0.038
High-grade PCa 0.767 (0.719–0.815) 0.036
Logst-RC
PCa 0.731 (0.684–0.778) 0.006
High-grade PCa 0.785 (0.738–0.831) 0.003
Table 4. The discriminative ability of IPRC, Multi-bio, Logst-bio, Multi-RC and Logst-RC using the areas
under the curve (AUC) and 95% confidence interval of the calculated probabilities. The p-values indicate if
each model significantly improve the IPRC.
Discussion
In this study, we have utilised a retrospective approach to show that the integration of inflammatory serum bio-
markers into the clinical risk factors significantly improves the discriminatory power and clinical utility of the
clinical risk factors alone for PCa and high-grade PCa (Gleason Score ≥ 7). This suggests that the Multi-RC or
Logst-RC models would improve the detection rate and/or reduce unnecessary biopsies compared to the IPRC
Scientific Reports | (2021) 11:2525 | https://doi.org/10.1038/s41598-021-81965-3 5
Vol.:(0123456789)www.nature.com/scientificreports/
Figure 1. The receiver operating characteristic (ROC) curves (A,D) and decision curves (B,E) represent the
discriminative ability of IPRC (green), Multi-RC (red) and Logst-RC (blue) in diagnosis of cancer (A,B) and
high-grade cancer (D,E). Calibration curves are represented in (C,F).
risk calculator based on clinical features alone. These models demonstrated consistently higher net benefits over
different preferences of wanting or avoiding a b iopsy29 and following further validation and threshold selection
could have clinical utility.
Chronic inflammation is associated with the development of many cancers including PCa and is possibly
playing a role in its formation and development30. In the current study we identified a number of inflammatory
mediators that increased the prediction of PCa and high-grade PCa when integrated with the current clinical
features compared to clinical features alone. These included TNF-α, VEGF, IL-1α, IL-1β, ICAM-1, E-Selectin,
P-Selectin and L-selectin. There is evidence in the literature that some of these mediators are associated with
tumour development and progression including PCa. VEGF has been shown to be overexpressed in patients with
colorectal31 and PCa. Fryczkowski et al. demonstrated that VEGF concentrations were significantly higher in
the PCa groups compared to the BPH patient group however on multiple logistic regression analysis VEGF was
not an independent predictor of PCa and did not add to the clinical features alone32. Soluble adhesion molecules
ICAM-1 and the selectins have been shown to be increased in Breast33 and colorectal cancer31 but there is no
evidence in PCa to date. TNF-α levels have also been correlated with disease stage in breast cancer34 but there
is no evidence that TNF-α serum levels are associated with high grade of lethal PCa at the time of diagnosis of
localised disease as well as IL-1α and IL-1β35. The power of our study is that we evaluated a number of inflam-
matory serum mediators and built a model selecting the biomarkers that gave the best prediction of PCa and
high-grade PCa.
The multinomial regression modelling approach identified a single combination of biomarkers for the risk
assessment of PCa and high-grade PCa. However, two different sets were selected to estimate the risk of PCa
and high-grade PCa in the logistic regression approach. The use of logistic regression helps to access the partial
effect of the biomarkers on either detecting PCa or high-grade PCa, while the use of multinomial regression
reduces the standard e rrors36. Both of these methods are employed in previous studies, including, the European
risk calculator (ERSPC-RC9) used the logistic regression approach, and two American risk calculators (PCPT-
RC10 and PBCG-RC11) are developed using the multinomial regression.
The use of a logarithm transformation for some biomarkers in the model (e.g. IL-1β) represents a nonlinear
effect of the biomarker on the risk, which indicates that a small change in the biomarker is critical. In contrast,
the linear effect of some biomarkers in the model (e.g. E-selectin) represents that a change in any value of the
biomarker has the same importance. The use of both linear and logarithm effects of the biomarkers in the model
Scientific Reports | (2021) 11:2525 | https://doi.org/10.1038/s41598-021-81965-3 6
Vol:.(1234567890)www.nature.com/scientificreports/
(e.g. IL-1α) indicates that, although any change in the biomarker is important, a small change in the values of
the biomarkers are more critical.
A limitation of the study is not having PSA density as a variable which is part of the ERSPC-PC8. We did not
have access to the prostate volume data for this study at the time of patient recruitment as the Irish health care
setting did not facilitate the collection of prostate volume until the TRUS biopsy was carried out.
Conclusion
Our study has demonstrated that as both models are well calibrated and utilise variables that are available from
the patient (Age, Family history, DRE and Previous Biopsy) and assessed from their blood sample they are
appropriate for individualized risk assessment. Both models show a statistically significant improvement above
the IPRC justifying the addition of the serum biomarkers and their clinical use. Selecting the best model requires
additional validation cohorts which would be used to independently validate and identify the best model and
select the appropriate thresholds which are clinically accepted and maximize their discrimination and clinical
benefit.
Data availability
Data is available to other researchers on written request to the corresponding author.
Received: 2 September 2020; Accepted: 13 January 2021
References
1. Prensner, J. R., Rubin, M. A., Wei, J. T. & Chinnaiyan, A. M. Beyond PSA: The next generation of prostate cancer biomarkers. Sci.
Transl. Med. 4(127), 127rv3 (2012).
2. Loeb, S. et al. Systematic review of complications of prostate biopsy. Eur. Urol. 64(6), 876–892 (2013).
3. van Vugt, H. A. et al. Prediction of prostate cancer in unscreened men: external validation of a risk calculator. Eur. J. Cancer 47(6),
903–909 (2011).
4. Schröder, F. H. et al. Screening and prostate-cancer mortality in a randomized European study. N. Engl. J. Med. 360(13), 1320–1328
(2009).
5. Ahmed, H. U. et al. Diagnostic accuracy of multi-parametric MRI and TRUS biopsy in prostate cancer (PROMIS): A paired
validating confirmatory study. The Lancet. 389(10071), 815–822 (2017).
6. Ruff, C. T. et al. Cardiovascular biomarker score and clinical outcomes in patients with atrial fibrillation: A subanalysis of the
ENGAGE AF-TIMI 48 randomized clinical trial. JAMA Cardiol. 1(9), 999–1006 (2016).
7. Oldgren, J. et al. Performance and validation of a novel biomarker-based stroke risk score for atrial fibrillation. Circulation 134(22),
1697–1707 (2016).
8. van Vugt, H. A. et al. Compliance with biopsy recommendations of a prostate cancer risk calculator. BJU Int. 109(10), 1480–1488
(2012).
9. Roobol, M. J. et al. Prediction of prostate cancer risk: the role of prostate volume and digital rectal examination in the ERSPC risk
calculators. Eur. Urol. 61(3), 577–583 (2012).
10. Ankerst, D. P. et al. Prostate Cancer Prevention Trial risk calculator 2.0 for the prediction of low-vs high-grade prostate cancer.
Urology 83(6), 1362–1368 (2014).
11. Ankerst, D. P. et al. Evaluating the PCPT risk calculator in ten international biopsy cohorts: Results from the Prostate Biopsy
Collaborative Group. World J. Urol. 30(2), 181–187 (2012).
12. White, J. et al. Clinical utility of the Prostate Health Index (phi) for biopsy decision management in a large group urology practice
setting. Prostate Cancer Prostatic Dis. 21(1), 78–84 (2018).
13. Loeb, S. & Catalona, W. J. The Prostate Health Index: A new test for the detection of prostate cancer. Ther. Adv. Urol. 6(2), 74–77
(2014).
14. Parekh, D. J. et al. A multi-institutional prospective trial in the USA confirms that the 4Kscore accurately identifies men with
high-grade prostate cancer. Eur. Urol. 68(3), 464–470 (2015).
15. Foley, R. W. et al. Improving multivariable prostate cancer risk assessment using the Prostate Health Index. BJU Int. 117(3), 409–417
(2016).
16. Leyten, G. H. et al. Prospective multicentre evaluation of PCA3 and TMPRSS2-ERG gene fusions as diagnostic and prognostic
urinary biomarkers for prostate cancer. Eur. Urol. 65(3), 534–542 (2014).
17. Ahmad, A. S., Ormiston-Smith, N. & Sasieni, P. D. Trends in the lifetime risk of developing cancer in Great Britain: Comparison
of risk for those born from 1930 to 1960. Br. J. Cancer 112(5), 943–947 (2015).
18. Sfanos, K. S., Hempel, H. A. & De Marzo, A. M. The Role of Inflammation in Prostate Cancer 153–181 (Springer, Basel, 2014).
19. Watson, J., Salisbury, C., Banks, J., Whiting, P. & Hamilton, W. Predictive value of inflammatory markers for cancer diagnosis in
primary care: A prospective cohort study using electronic health records. Br. J. Cancer 120(11), 1045–1051 (2019).
20. Liu, X. et al. Low CD38 identifies progenitor-like inflammation-associated luminal cells that can initiate human prostate cancer
and predict poor outcome. Cell Rep. 17(10), 2596–2606 (2016).
21. Kwon, O. J., Zhang, L., Ittmann, M. M. & Xin, L. Prostatic inflammation enhances basal-to-luminal differentiation and accelerates
initiation of prostate cancer with a basal cell origin. Proc. Natl. Acad. Sci. USA 111(5), E592-600 (2014).
22. FitzGerald, S. P., McConnell, R. I. & Huxley, A. Simultaneous analysis of circulating human cytokines using a high-sensitivity
cytokine biochip array. J. Proteome Res. 7(01), 450–455 (2008).
23. McAleer, D., McPhillips, F. M., FitzGerald, S. P., McConnell, R. I. & Rodriguez, M. L. Application of evidence InvestigatorTM for
the simultaneous measurement of soluble adhesion molecules: L-, P-, E-Selectins, VCAM-1, ICAM-1 in a Biochip Platform. J.
Immunoassay Immunochem. 27(4), 363–378 (2006).
24. R Core Team. R: A Language and Environment for Statistical Computing. (R Foundation for Statistical Computing, Vienna, Austria,
2017). http://www.R-project.org/
25. Jalali, A. et al. A risk calculator to inform the need for a prostate biopsy: A rapid access clinic cohort. BMC Med. Inform. Decis.
Mak. 20(1), 1–1 (2020).
26. DeLong, E. R., DeLong, D. M. & Clarke-Pearson, D. L. Comparing the areas under two or more correlated receiver operating
characteristic curves: A nonparametric approach. Biometrics 44, 837–845 (1988).
27. Vickers, A. J. & Elkin, E. B. Decision curve analysis: A novel method for evaluating prediction models. Med. Decis. Making 26(6),
565–574 (2006).
28. Steyerberg, E. W. Clinical Prediction Models (Springer International Publishing, Berlin, 2019).
Scientific Reports | (2021) 11:2525 | https://doi.org/10.1038/s41598-021-81965-3 7
Vol.:(0123456789)www.nature.com/scientificreports/
29. Vickers, A. J., van Calster, B. & Steyerberg, E. W. A simple, step-by-step guide to interpreting decision curve analysis. Diagn. Progn.
Res. 3(1), 1–8 (2019).
30. Sfanos, K. S., Yegnasubramanian, S., Nelson, W. G. & De Marzo, A. M. The inflammatory microenvironment and microbiome in
prostate cancer development. Nat. Rev. Urol. 15(1), 11–24 (2018).
31. Dymicka-Piekarska, V., Guzinska-Ustymowicz, K., Kuklinski, A. & Kemona, H. Prognostic significance of adhesion molecules
(sICAM-1, sVCAM-1) and VEGF in colorectal cancer patients. Thromb. Res. 129(4), e47-50 (2012).
32. Fryczkowski, M., Bułdak, R. J., Hejmo, T., Kukla, M. & Żwirska-Korczala, K. Circulating levels of omentin, leptin, VEGF, and HGF
and their clinical relevance with PSA marker in prostate cancer. Dis. Mark https://doi.org/10.1155/2018/3852401 (2018).
33. O’hanlon, D. M. et al. Soluble adhesion molecules (E-selectin, ICAM-1 and VCAM-1) in breast carcinoma. Eur. J. Cancer 38(17),
2252–2257 (2002).
34. Ma, Y. et al. IL-6, IL-8 and TNF-α levels correlate with disease stage in breast cancer patients. Adv. Clin. Exp. Med. 26(3), 421–426
(2017).
35. Vicier, C. et al. Elevated serum cytokines and Trichomonas vaginalis serology at diagnosis are not associated with higher Gleason
grade or lethal prostate cancer. Clin. Genitourin. Cancer 17(1), 32–37 (2019).
36. Agresti, A. Categorical Data Analysis (Wiley, New York, 2003).
Acknowledgements
This project was supported by the Enterprise Ireland Innovation Partnership Programme Project IP 20160464.
We which to acknowledge the contribution of the clinicians and research nurses of the Rapid Access clinic and
all the patients who were involved.
Author contributions
R.W.W., A.S.P. K.M., C.R. and T.B.M. developed the central concept of the paper. M.K., K.M., C.R., S.P.F. ana-
lysed the samples. A.S.P. and R.W.W. supplied the samples. A.J. analysed the data. M.K. contributed to the data
analysis. T.B.M. supported data analysis. A.J., R.W.W. and M.K. drafted the manuscript. All authors contributed
to the interpretation of the data and contributed to the editing of the manuscript. R.W.W. and A.S.P. directed
and supervised the study. All authors read and approved the final manuscript.
Competing interests
KM and CR are employed at Randox Teoranta. SPF is employed at Randox Holdings Ltd. Randox Teoranta
provided financial and in-kind contributions to the project under the terms of the Enterprise Ireland Innovation
Partnership Programme award. The other authors declare no competing interests.
Additional information
Correspondence and requests for materials should be addressed to A.J.
Reprints and permissions information is available at www.nature.com/reprints.
Publisher’s note Springer Nature remains neutral with regard to jurisdictional claims in published maps and
institutional affiliations.
Open Access This article is licensed under a Creative Commons Attribution 4.0 International
License, which permits use, sharing, adaptation, distribution and reproduction in any medium or
format, as long as you give appropriate credit to the original author(s) and the source, provide a link to the
Creative Commons licence, and indicate if changes were made. The images or other third party material in this
article are included in the article’s Creative Commons licence, unless indicated otherwise in a credit line to the
material. If material is not included in the article’s Creative Commons licence and your intended use is not
permitted by statutory regulation or exceeds the permitted use, you will need to obtain permission directly from
the copyright holder. To view a copy of this licence, visit http://creativecommons.org/licenses/by/4.0/.
© The Author(s) 2021
Scientific Reports | (2021) 11:2525 | https://doi.org/10.1038/s41598-021-81965-3 8
Vol:.(1234567890)You can also read