International Journal for Business Education - April 2018 Number 158 - la Société Internationale pour l'Enseignement Commercial - International ...
←
→
Page content transcription
If your browser does not render page correctly, please read the page content below
ISSN 2164-2885

 International Journal
for Business Education
 April 2018
 Number 158

la Société Internationale pour l'Enseignement Commercial
 The International Society for Business Education
International Journal for Business Education, No 158 ISSN 2164-2877 (print)
 April 2018 ISSN 2164-2885 (online)

 International Journal for Business Education
 Number 158
 ISSN 2164-2877 (print)
 ISSN 2164-2885 (online)

 Copyright © 2018 by the International Society for Business Education

 P.O. Box 84
 Pardeeville, Wisconsin 53954
 USA

 All rights reserved. No part of this journal may be reproduced or transmitted in any form or by any
 means, electrical or mechanical, including photocopying, recording, or by information storage and
 retrieval, without written permission from the publisher.

 Any views or recommendations expressed in this journal do not necessarily constitute official policy of
 the International Society for Business Education.

 The International Journal for Business Education is a peer-reviewed journal. Articles that are included
 have been subjected to a blind-review by external peers.

 2
 Supporting Global Business Education since 1901
 © 2018 SIEC-ISBE
International Journal for Business Education, No 158 ISSN 2164-2877 (print)
 April 2018 ISSN 2164-2885 (online)

 The Web addresses listed were accurate when this journal was written, but may have changed since its
 publication.

 Message from the
 International President
 Dear SIEC-ISBE Friends,

 Welcome to the 158th edition of The International Journal for Business Education, formerly known
 as The Review. Our journal is a double blind, peer-reviewed publication for global business educators by
 global business educators. The journal is published once per year. ISBE members provide in-depth
 research articles that can be helpful in the classroom or with administrative responsibilities. Each
 article, based upon research conducted by our members, adds to the body of knowledge in global
 business education. As in the past, information about the upcoming conference will be included.

 I want to thank Tamra Davis, Ph.D. of the USA Chapter and Michaela Stock, Ph.D. of the Austrian
 Chapter for taking on the task of editors. I also want to take a moment to thank our reviewers. The
 complete list of reviewers can be seen on our Editoral Board page. Your expertise was beneficial in
 helping improve the quality of the accepted manuscripts and offering guidance for improvement to
 those authors whose work was not accepted this year.
 Our international conference 2018 will be located in Reykavik, Iceland. The conference theme,
 Start-Ups, is an exciting theme that is very appropriate in today´s business and Business Education. I
 hope to see you at the 2018 conference and our future conferences as well. Future conferences are
 planned in the following maritime locations:

 2019—The Island of Cefalonia, Greece
 2020—Baltic Sea Cruise Stockholm-Helsinki-St Petersburg-Tallinn-Stockholm
 2021—An Asian location

 With warmest SIEC-ISBE regards until we meet again, digitally or face-to-face

 Cege Ekström

 SIEC-ISBE International President
 Sweden
 sergeije2@gmail.com
 http://lawandsociety.net

 3
 Supporting Global Business Education since 1901
 © 2018 SIEC-ISBE
International Journal for Business Education, No 158 ISSN 2164-2877 (print)
 April 2018 ISSN 2164-2885 (online)

 Review Process
 The International Journal for Business Education is a double-blind, peer-reviewed journal. Due to the
 international nature of the journal, two or more editors work together to facilitate the review process.
 The editor from outside of the United States handles all manuscripts that originate from the United
 States. This editor assigns the manuscripts to the appropriate reviewers, handles all correspondence
 with the author(s) and reviewers, and makes the final decision on acceptance. The editor from the
 United States handles manuscripts that originate from outside the United States. Again, this editor
 assigns the manuscripts to the appropriate reviewers, handles all correspondence with the author(s) and
 reviewers, and makes the final decision on acceptance. By following this process, it is possible that one
 or more of the editors will also have a manuscript published in the journal. Additionally, it is also
 possible that someone who has submitted a manuscript is also selected to be a reviewer by the editor
 from outside their geographic area.

 4
 Supporting Global Business Education since 1901
 © 2018 SIEC-ISBE
International Journal for Business Education, No 158 ISSN 2164-2877 (print)
 April 2018 ISSN 2164-2885 (online)

 Editorial Review Board

 Robert Blair SokPal (Joe) Cho
 Middle Tennessee State University Korea Institute of Science and Technology
 Murfreesboro, TN USA Information
 Seoul, Korea

 Anna Dubel Karina Fernandez
 AGH University of Science and Technology University College of Teacher Education
 Krakow, Poland Styria, Austria

 H. Roger Fulk Gerhard Geißler
 Wright State University Vienna University of Economics and Business
 Ohio, USA Vienna, Austria

 Karl-Heinz Gerholz Dana Gray
 University of Bamberg Rogers State University
 Germany Claremore, OK, USA

 Leszek Preisner Elisabeth Riebenbauer
 AGH University of Science and Technology University of Graz
 Krakow, Poland Graz, Austria

 Max Rittner Bernadette Robins
 BizEdLogic The College of the Bahamas
 Canada School of Business
 Oakes Field Campus
 Nassau, Bahamas

 Peter Slepcevic-Zach George Tafner
 University of Graz University of Teacher Education
 Graz, Austria Styria, Austria

 Pirjo Tikkanen-Korperich Irina Weisblat, Ed.D.
 HAAGA-HELIA University of Applied Sciences The Forbes School of Business at Ashford
 Helsinki, Finland University
 California, USA

 Hely Westerholm Gregg Whyte
 Helsinki, Finland Salem State University
 Salem, MA USA

 Elisha Wohleb, Ph.D.
 Auburn University
 Auburn, Alabama USA

 5
 Supporting Global Business Education since 1901
 © 2018 SIEC-ISBE
International Journal for Business Education, No 158 ISSN 2164-2877 (print)
 April 2018 ISSN 2164-2885 (online)

 Table of Contents
 Message from the International President .................................................................................................. 3
 Review Process.............................................................................................................................................. 4
 Editorial Review Board .................................................................................................................................. 5
 Membership Information ............................................................................................................................. 7
 SIEC Journal Editors ....................................................................................................................................... 7
 Preface .......................................................................................................................................................... 8
 SIEC Executive Committee: 2018—2019 ..................................................................................................... 9
 Understanding Graduation Rates at Higher Education Institutions: A Forecasting Model ....................... 10
 Revenge of the Nerds Revisited: Do Accounting and Finance Majors Differ from other Business Majors in
 Their Learning Styles, and do They Earn Higher Grades in a General Business Course? ............................ 24
 Management Strategies for Active Learning in AACSB accredited STEM discipline of CIS: Evidence from
 Traditional and Novel Didactic Methods in Higher Education .................................................................... 41
 Providing Entrepreneurship Education to Business and Non-Business Students: A Holistic View on
 Different Approaches .................................................................................................................................. 57
 What must a lecturer/instructor (teacher) be able to do to inspire entrepreneurship and business
 students?..................................................................................................................................................... 70
 Call for Papers ............................................................................................................................................. 95

 6
 Supporting Global Business Education since 1901
 © 2018 SIEC-ISBE
International Journal for Business Education, No 158 ISSN 2164-2877 (print)
 April 2018 ISSN 2164-2885 (online)

 Membership Information
 Membership in SIEC-ISBE is open to everyone with an interest in Business Education. SIEC-ISBE has
 many national chapters.

 Visit http://www.siecisbe.org to find out if a chapter exists in your country. You can contact the national
 chapter from this website. If a chapter does not exist, contact the General Secretary for information to
 join as an international member. Contact information: Dr. Lila Waldman, waldmanl@uww.edu.

 Permanent Office:
 P.O. Box 84
 Pardeeville, Wisconsin 53954
 USA
 http://www.siec-isbe.org

 SIEC Journal Editors

 Tamra S. Davis, Ph.D. Michaela Stock, Ph.D.
 Illinois State University University of Graz
 Dept. of Marketing/Business Education Dept. of Business Education and Development
 Normal, IL USA Graz, Austria, Europe
 Tdavis2@illinoisstate.edu Michaela.stock@uni-graz.at

 7
 Supporting Global Business Education since 1901
 © 2018 SIEC-ISBE
International Journal for Business Education, No 158 ISSN 2164-2877 (print)
 April 2018 ISSN 2164-2885 (online)

 Preface
 We would like to thank the wonderful professionals who filled the role of reviewers for this
 year’s journal. Due to the number of manuscripts received, multiple reviewers were needed. Without
 their assistance, the job of editor would have been much more difficult. Thank you to the entire
 Editorial Board who are SIEC-ISBE members and volunteered to help when asked. Thank you.
 We hope that you find the articles included in this year’s The International Journal for Business
 Education interesting. Thank you to everyone who submitted a manuscript for consideration. Without
 your submissions, we would not have had a journal.

 Tamra S. Davis, Ph.D. and
 Michaela Stock, Ph.D.
 SIEC-ISBE Editors 2018

 8
 Supporting Global Business Education since 1901
 © 2018 SIEC-ISBE
International Journal for Business Education, No 158 ISSN 2164-2877 (print)
 April 2018 ISSN 2164-2885 (online)

 SIEC Executive Committee: 2018—2019
 International President .............................................................................................. Cege Ekström, Sweden
 sergeije2@gmail.com

 General Secretary .............................................................................................................Lila Waldman, USA
 waldmanl@uww.edu

 Nordic Speaking Chapters Vice-President............................................................................ Monica Tengling
 Monica.tengling@TeDak.se

 German Speaking Chapters Vice-President Hans Dietrich, Germany
 Bes.1@web.de

 US Chapter Vice-President ...........................................................................................................Judee Timm
 jtimm@mpc.edu

 Professional Development Committee Chair ......................................................................... Mona Engberg
 info@monaengberg.de

 Website .................................................................................................................. http://www.siec-isbe.org

 9
 Supporting Global Business Education since 1901
 © 2018 SIEC-ISBE
International Journal for Business Education, No 158 ISSN 2164-2877 (print)
 April 2018 ISSN 2164-2885 (online)

 Understanding Graduation Rates at Higher Education Institutions:
 A Forecasting Model

 Serina Al-Haddad, Rachael Boone and Emma Campbell
 School of Business Administration
 Stetson University

 Corresponding Author: Serina Al-Haddad, Shaddad1@stetson.edu

 ABSTRACT

 Graduation rates and degree completion have always been a concern for students, students’
 families and universities. Moreover, many consider college degree completion rates to be
 among one of the most important indicators of institutional quality according to a report from
 the Higher Education Research Institute published in the United States of America. This research
 studied factors that can explain graduation rates which include student-faculty ratio, financial
 factors, and enrollment status. Data was collected and analyzed for state and private
 universities, and a Multiple Regression Model (MLR) was built to forecast graduation rates. The
 model was able to highlight variables that significantly relate to graduation rates. Researchers
 can use this article to understand the different factors that correlate with degree completion
 and to forecast graduations rates at Higher Education Institutions. The international researcher
 can explore replicating the forecasting model at universities outside the United States of
 America.

 Introduction

 Graduation rates are usually defined as the time to complete a degree program within four to
 six years of starting the degree (Paterson & Gordon, 2010), and graduation rate has become
 one of the commonly regarded statistics as a primary indicator of institutional performance for
 higher education (DeAngelo, Franke, Hurtado, Pryor, & Tran, 2011). In the DeAngelo, et al.
 (2011) report published by the Higher Education Research Institute, the authors stated that
 high graduation rates are important to society because greater degree attainment is associated
 with higher salaries and lower unemployment rates; therefore, impacting the economic health
 of the United States. Recent research has shed the light on the importance of increasing
 graduation rates at higher education institutions (Haynes, 2016; Joy, 2017). Before 1985,
 institutional statistics on universities’ graduation rates did not exist (Cook & Pullaro, 2010), and
 now graduation rates have come to reflect overall quality of student learning, intellectual
 involvement, how well students are integrated into campus life, and how effectively a campus
 delivers what students expect and need. For instance, in a study performed on Texas high
 schools, concluded that the accountability pressure on schools affected college graduation
 rates. In 1993, a test-based accountability system was introduced in Texas resulting in sanctions

 10
 Supporting Global Business Education since 1901
 © 2018 SIEC-ISBE
International Journal for Business Education, No 158 ISSN 2164-2877 (print)
 April 2018 ISSN 2164-2885 (online)

 put in place for underperforming schools (Deming, Cohodes, Jennings, & Jencks, 2016). This
 caused school officials to pressure students to achieve high test scores to avoid government
 punishments. The study found that this pressure affected students’ college enrollment and
 completion rates as well as their job earnings as adults. Subsequently, students enrolled in
 underperforming schools had more pressure to do well on state tests which resulted in an
 increase in students’ college enrollment and competition rates. Thus, the study found that high
 school accountability influences graduation rates. However, this paper proposes that the
 relative size of the college’s student population, financial factors, and enrollment statuses has a
 statistically significant relationship with the institutional dedication to the student and
 ultimately the graduation rate. This paper chose to focus on these factors to determine
 whether our hypothesis holds true for over 1000 higher education institutions universities in
 the United States of America as shown in the conceptual model section.

 This paper is divided into six sections. The first section introduces the topic and the need for a
 model to forecast graduation rates. The second section reviews and integrates the available
 literature history and the main authors that addressed graduation rates. The third section
 proposes a conceptual model that addresses the variables that predict graduation rates. The
 fourth section explains the data collection and analysis processes, the fifth section discusses the
 results and its implications, and the sixth section summarizes the paper with an overall
 conclusion and areas for future research.

 Literature Review

 Graduation rates have continued to be a popular indicator of institutional performance. Other
 studies have been performed about college graduation rates using different variables than this
 study. For instance, eight cohorts of undergraduate college students in the 1990s were studied
 resulting in the conclusion that there is a positive correlation between state funding and college
 graduation rates (Zhang, 2009). It was found that for every 10% increase in state funding, there
 was a 0.64% increase in graduation rates per full-time student. The author concluded that “it is
 the interaction between student characteristics (including commitments to their educational
 goals and institutions and the academic and social contexts of the institutions that ultimately
 determines students’ college persistence and graduation” (Zhang, 2009, p. 716).

 Additionally, Montgomery and Beronda (2012) used this same study as a resource for their
 study on graduation rates. In their study, they compared graduation rates of ten historically
 black colleges and ten predominately white institutions. While their main independent variable
 was race, they also used other variables such as geographical location, socioeconomic factors,
 and population size. Their results suggested that historically black colleges have lower
 graduation rates; thus, affecting state funding. Both Zhang’s, and Montgomery’s and Beronda’s
 studies used graduation rates as a performance measure for determining funding levels.
 Furthermore, both studies used the Integrated Postsecondary Education Data System which

 11
 Supporting Global Business Education since 1901
 © 2018 SIEC-ISBE
International Journal for Business Education, No 158 ISSN 2164-2877 (print)
 April 2018 ISSN 2164-2885 (online)

 this paper also utilized with the difference being that this study used data from more recent
 years.

 Similar to Montgomery’s and Beronda’s study, Mooring and Mooring (2016) hypothesized that
 the graduation rates for minority community college transfer students vary and that the factors
 that best predict timely graduation also vary by ethnicity. They found that their hypotheses
 were valid. The results concluded that the most predictive factor for African American transfer
 students was enrollment in a four-year transfer program at the community college while the
 predictive factor for Hispanic Americans was obtaining a credential before transferring.
 Furthermore, a high GPA was the best predictive factor for Asian American transfer students.

 Another study utilized prediction models using graduation rates as a performance indicator of
 community colleges (Moosai, Walker, & Floyd, 2011). Therefore, this study was not focused on
 what specific variables impact graduation rates, but was more concerned with how graduation
 rates could predict a higher education institution’s performance. From this study using data
 from California, Florida, and Michigan community colleges, the results concluded that
 graduation rates could predict whether a college was exceeding, meeting, or below
 expectations. Yet, the researchers warned that the performance of an institution consists of
 numerous factors, not just graduation rates. Thus, this study will determine which major
 variables are significantly related to graduation rates which can predict institutional
 performance.

 Another community college study used a regression model to compare the differences in
 graduation rates between students who transferred from community colleges to students who
 stayed at the college for all four years (Friedl, Pittenger & Sherman, 2012). They examined 417
 University of Tennessee students and compared the performance of students who had
 previously taken an intermediate math course at a community college with those who had
 taken the same course at a four-year institution. It was found that the students who transferred
 performed poorer in college-level math courses at the university suggesting that community
 college transfer students may result in decreasing a university’s four-year graduation rate.

 Additionally, Melguizo (2008) found that the selectivity of institutions impacted graduation
 rates. In her study, Melguizo sampled 3,000 students across the nation. While this study used
 three specific independent variables, Melguizo used three sets of variables: student
 characteristics, pre-college achievement, and postsecondary institutional characteristics. Her
 regression analysis concluded that students who attended the most selective universities were
 more likely to graduate with a bachelor’s degree.

 Instead of just focusing on student characteristics, Crawford’s (2015) study solely focused on
 the impact on institutional expenses. From his study using ANOVA, Crawford discovered that
 library and instruction expenses had a strong, positive correlation with college retention and
 graduation rates. Thus, he concluded that since private schools typically have larger funds for

 12
 Supporting Global Business Education since 1901
 © 2018 SIEC-ISBE
International Journal for Business Education, No 158 ISSN 2164-2877 (print)
 April 2018 ISSN 2164-2885 (online)

 library and instruction expenses, more students graduate from private than public colleges, on
 average. Additionally, Crawford’s results can support Melguizo’s study about the impact of the
 selectivity of schools. From both studies, it can be hypothesized that since private schools tend
 to be more selective and have more funding that they have higher graduation rates than public
 colleges and universities.

 Conceptual Model

 Previous studies have successfully determined factors that impact graduation rates and how
 graduation rates impact institutional performance. However, none of the studies specifically
 focused on areas related to the number of applications received and accepted, student
 enrollment size, financial factors, enrollment statuses and student/faculty ratio. Furthermore,
 none of the studies had a similar scope as this research since this paper is using data from 1,155
 higher education institutions across the United States.

 This research proposed a framework that will predict graduation rates based on multiple
 independent variables including applications received, applications accepted, new students
 enrolled, part-time undergrads, out-of-state tuition and student/faculty ratio.

 Figure 1 shows the multiple variables addressed in this paper. As shown in the conceptual
 model, this research focused on understanding the potential relationships between graduation
 rates (dependent variable) and the six independent variables in order to forecast the
 graduation rates.

 13
 Supporting Global Business Education since 1901
 © 2018 SIEC-ISBE
International Journal for Business Education, No 158 ISSN 2164-2877 (print)
 April 2018 ISSN 2164-2885 (online)

 Figure 1: The Conceptual Model Dependent and Independent Variables

 Variables Definitions

 The six independent variables are defined as follows:

 • Number of applications received: Total number of applications that were submitted to
 the school in the school year documented.
 • Number of applications accepted: Number of applications that were submitted and
 accepted for spring or fall entry by the university or college.
 • Number of new students enrolled: Number of new students entering the university at
 the start of the August or fall semester.
 • Number of part time undergraduate: Total number of undergraduates in the program
 that are part-time students as defined by the university or college (typically less than 12
 credits).
 • Out of state tuition: Amount of tuition paid by students that are commuting out of state.
 • Student/faculty ratio: Ratio of students to faculty members in the university.

 The dependent variable in this paper is Graduation Rate. This variable is the percentage of a
 higher education institution’s first-time, first-year undergraduate students who complete their
 program within 150% of the published time. In this proposed conceptual model, graduation
 rate is considered exclusively for four-year programs.

 The following section describes the data collection and the analysis processes this study
 implemented.

 14
 Supporting Global Business Education since 1901
 © 2018 SIEC-ISBE
International Journal for Business Education, No 158 ISSN 2164-2877 (print)
 April 2018 ISSN 2164-2885 (online)

 Data Collection and Analysis

 Research Main Question.

 The main question in this research paper was what can forecast graduation rates? To answer
 this question, the following hypothesis was proposed and tested:

 • Research Hypothesis
 o H0 (null hypothesis): There is no correlation between “Applications Received,
 Applications Accepted, New students Enrolled, Part-time undergrads, Out-of-state
 Tuition and Student/faculty Ratio” and “Graduation Rates.”
 o H1 (alternative hypothesis): There is a correlation between “Applications Received,
 Applications Accepted, New students Enrolled, Part-time undergrads, Out-of-state
 Tuition and Student/faculty Ratio” and “Graduation Rates.”

 15
 Supporting Global Business Education since 1901
 © 2018 SIEC-ISBE
International Journal for Business Education, No 158 ISSN 2164-2877 (print)
 April 2018 ISSN 2164-2885 (online)

 Data Collection Approach.

 Data from 1,155 colleges across the nation was collected from the U.S News and World Report
 (National Universities Ranking, 2016), universities’ websites, and phone calls to the universities
 made to verify any old/missing data. The number of higher education institutions collected
 grouped per state is shown in Table 1.

 Table 1
 Number of Higher Education Institutions per State
 State # of HE Institutions State # of HE Institutions
 Alaska 2 Montana 7
 Alabama 24 North Carolina 44
 Arkansas 12 North Dakota 7
 Arizona 4 Nebraska 14
 California 61 New Hampshire 11
 Colorado 13 New Jersey 26
 Connecticut 16 New Mexico 8
 District of Columbia 6 Nevada 2
 Delaware 4 New York 89
 Florida 25 Ohio 44
 Georgia 35 Oklahoma 13
 Hawaii 2 Oregon 13
 Iowa 28 Pennsylvania 78
 Idaho 6 Rhode Island 7
 Illinois 47 South Carolina 24
 Indiana 36 South Dakota 9
 Kansas 20 Tennessee 30
 Kentucky 21 Texas 51
 Louisiana 20 Utah 5
 Massachusetts 48 Virginia 37
 Maryland 21 Vermont 13
 Maine 12 Washington 15
 Michigan 33 Wisconsin 27
 Minnesota 24 West Virginia 15
 Missouri 31 Wyoming 1
 Mississippi 14

 16
 Supporting Global Business Education since 1901
 © 2018 SIEC-ISBE
International Journal for Business Education, No 158 ISSN 2164-2877 (print)
 April 2018 ISSN 2164-2885 (online)

 The detailed statistics of the six interdependent variables: applications received, applications
 accepted, new students’ enrolled, part-time undergrads, out-of-state tuition and
 student/faculty ratio, are shown in Table 2.

 Table 2
 Statistics of the Six Interdependent Variables per State

 Student/facul
 Sum of Part-
 Sum of app.
 Sum of app.

 Sum of new

 AVG of out-
 Undergrads
 Accepted
 Received

 Students
 Enrolled
 State

 of-state

 ty Ratio
 Tuition

 AVG of
 time
 Alaska 339 263 144 2,718 $ 6,393 10.7
 Alabama 48,797 36,839 17,795 23,264 $ 5,368 16.6
 Arkansas 19,603 17,078 10,808 11,181 $ 5,161 16.3
 Arizona 33,276 27,870 10,432 15,615 $ 7,121 18.6
 California 266,518 172,911 54,577 82,157 $ 11,461 14.4
 Colorado 51,705 36,058 14,420 18,811 $ 8,821 19.7
 Connecticut 60,265 35,503 11,497 18,359 $ 12,936 12.7
 District of Columbia 35,380 16,348 6,201 4,473 $ 13,989 8.9
 Delaware 17,334 13,066 4,521 6,980 $ 7,893 18.2
 Florida 77,542 53,498 21,190 56,376 $ 8,843 16.3
 Georgia 95,097 59,786 28,922 36,455 $ 6,756 15.2
 Hawaii 5,079 3,382 2,127 3,282 $ 3,690 13.8
 Iowa 44,683 37,977 15,875 15,137 $ 10,783 13.8
 Idaho 10,945 9,050 5,333 10,292 $ 6,836 13.9
 Illinois 122,948 86,174 34,133 39,473 $ 10,202 13.6
 Indiana 101,685 81,821 37,576 49,032 $ 9,651 14.4
 Kansas 28,339 21,788 12,443 16,025 $ 7,349 14.8
 Kentucky 41,229 32,340 16,667 24,066 $ 6,863 14.5
 Louisiana 52,691 45,484 25,335 27,746 $ 5,744 18.0
 Massachusetts 159,329 100,911 34,191 46,978 $ 12,830 13.3
 Maryland 63,458 39,904 13,379 19,927 $ 10,117 13.9
 Maine 17,376 11,453 4,731 6,674 $ 9,865 15.9
 Michigan 110,967 86,944 37,324 62,464 $ 9,085 17.7
 Minnesota 52,159 37,924 19,580 34,144 $ 10,212 14.5
 Missouri 60,632 48,425 22,156 38,318 $ 8,183 14.9
 Mississippi 29,305 18,985 9,172 8,120 $ 5,582 16.0
 Montana 9,782 8,241 5,045 5,175 $ 6,692 16.6
 North Carolina 127,170 76,746 31,553 27,820 $ 8,395 13.8
 North Dakota 7,911 6,546 4,550 3,400 $ 5,548 16.4
 Nebraska 21,724 20,423 10,792 13,563 $ 6,808 15.0
 New Hampshire 33,547 22,531 6,498 8,689 $ 12,276 16.2
 New Jersey 129,267 66,899 18,576 39,184 $ 9,094 15.5
 New Mexico 12,487 10,581 5,469 11,478 $ 6,071 16.1
 Nevada 3,068 2,569 1,624 2,989 $ 6,995 11.5
 New York 336,847 210,346 67,668 94,222 $ 11,037 14.0

 17
 Supporting Global Business Education since 1901
 © 2018 SIEC-ISBE
International Journal for Business Education, No 158 ISSN 2164-2877 (print)
 April 2018 ISSN 2164-2885 (online)

 Ohio 131,720 103,317 48,317 53,355 $ 1,117 14.4
 Oklahoma 21,597 18,859 10,540 14,509 $ 5,803 17.0
 Oregon 25,936 20,742 7,369 5,034 $ 12,046 14.2
 Pennsylvania 226,449 145,665 50,958 56,339 $ 11,784 13.7
 Rhode Island 36,655 21,950 7,106 9,640 $ 12,896 14.8
 South Carolina 45,498 33,852 14,203 12,738 $ 7,947 15.7
 South Dakota 8,605 7,719 5,474 4,972 $ 6,146 16.1
 Tennessee 59,939 42,992 20,739 25,894 $ 7,497 14.3
 Texas 134,473 99,820 53,111 83,262 $ 6,431 17.0
 Utah 17,694 14,762 9,834 16,728 $ 5,505 17.6
 Virginia 118,319 72,610 27,200 21,749 $ 10,084 13.6
 Vermont 19,847 13,944 4,769 4,038 $ 13,164 11.9
 Washington 45,755 31,896 12,982 11,046 $ 10,718 14.9
 Wisconsin 71,058 55,233 23,701 28,221 $ 9,722 15.6
 West Virginia 28,214 23,631 10,762 10,803 $ 7,881 14.6
 Wyoming 2,029 1,516 1,073 1,488 $ 5,988 15.1

 Data Analysis.

 Standard multiple regression analysis was performed to test the research hypothesis. A
 multiple linear regression (MLR) model was constructed with the six interdependent variables
 discussed in section 0 all 1,155 higher education institutions and the dependent variable
 “Graduation Rate”. The results of the hypotheses testing using standard multiple regression are
 shown in Table 3 and the detailed MLR output is shown in Table 4 and Table 5.

 Table 3
 Results of Hypothesis Testing
 Relationship Significant Significance
 Significant Contribution
 Strength Relationship Level
 • Number of applications received
 R2 = 0.426 Yes 0.00 < 0.05 • Number of Part-time undergrad
 • Out-of-state tuition

 Table 4
 The Results of the Multiple Linear Regression Model for Graduation Rates
 Regression Statistics
 Coefficient of Determination (R2) 0.425752

 Table 5
 Multiple Linear Regression Output
 Coefficients Standard Error t Stat P-value
 Intercept 39.77871 2.27782 17.4635 0.00000
 Number of applications received 0.001411 0.000361 3.908984 0.00010

 18
 Supporting Global Business Education since 1901
 © 2018 SIEC-ISBE
International Journal for Business Education, No 158 ISSN 2164-2877 (print)
 April 2018 ISSN 2164-2885 (online)

 Number of application accepted -0.00055 0.000659 -0.83221 0.40547
 Number of new student enrolled -0.00039 0.001087 -0.35874 0.71986
 Number of Part-time undergrad -0.00242 0.000296 -8.1865 0.00000
 Out-of-state tuition 0.002337 0.000122 19.09706 0.00000
 Student/faculty ratio -0.10323 0.101047 -1.0216 0.30718

 The results in Table and Table 4 show that this research conceptual model that includes
 applications received, applications accepted, new students enrolled, part-time undergrads, and
 out-of-state tuition and student/faculty ratio explains almost 43% of the variation in the
 graduation rate.

 The Refined Conceptual Model.

 In order to find the significant unique contribution of individual variables on the dependent
 variable, the observed levels of significance (p-value) were examined. The three variables that
 significantly relate to the dependent variable (graduation rate) are number of applications
 received, number of part-time undergrads and out-of-state tuition.

 To improve the forecast of the developed MLR model, only the significant variables with p-
 value of 0.0 (in bold italic in Table 5) were included and a refined MLR model was built as
 shown in Table 6 and Table 7.

 Table 6
 The Results of the Refined Multiple Linear Regression Model for Graduation Rates
 Regression Statistics
 Coefficient of Determination (R2) 0.424297

 Table 7
 Refined Multiple Linear Regression Output
 Coefficients Standard Error t Stat P-value
 Intercept 37.37284 1.175189 31.80155 0.00000
 Number of applications received 0.000997 0.000125 7.978915 0.00000
 Number of PT undergrad -0.00254 0.000279 -9.10238 0.00000
 Out-of-state tuition 0.002421 0.000107 22.71887 0.00000

 The results in Table 6 and Table 7 show that the conceptual model that includes number of
 applications received, number of part-time undergrads and out-of-state tuition explains almost
 42.4 % of the variation in the graduation rate and the three independent variables significantly
 relate to graduation rate.

 19
 Supporting Global Business Education since 1901
 © 2018 SIEC-ISBE
International Journal for Business Education, No 158 ISSN 2164-2877 (print)
 April 2018 ISSN 2164-2885 (online)

 The regression model shown in Equation 1 intended to forecast graduation rate. Equation 1
 demonstrates the interrelationship between the research variables of graduation rate, number
 of applications received, number of part-time undergrads and out-of-state tuition.

 ≅ 37.373 + 0.000997 ( ) −
 0.00254 ( . ) + 0.00242 ( − −
 ) (1)

 The positive contributions of number of applications received and out-of-state tuition
 demonstrate that the increase in these two variables positively correlates with an increase in
 graduation rate. The negative contribution of number of part-time undergraduates, however,
 demonstrates that the increase in the number of part-time undergraduates negatively
 correlates with graduation rate.

 Discussion

 Standard multiple regression analyses were performed to test the research hypothesis and
 found that the six variables discussed in this paper (applications received, applications
 accepted, new students enrolled, part-time undergrads, out-of-state tuition and
 student/faculty ratio) were able to explain almost 43% of the variation in the graduation rate.

 The conceptual model was refined to include the three significant variables only (with p-value
 of 0.0) and the refined multiple regression model that includes number of applications
 received, number of part-time undergrads and out-of-state tuition was able to explain almost
 42.4 % of the variation in the graduation rate.

 The coefficient of determination (R2) which explains how much variation in the dependent
 variable (graduation rate) was explained by the independent variables is almost the same when
 including all six variables; the significant and insignificant ones. Therefore, the significant
 variables were considered only when building the refined conceptual model.

 The refined conceptual model showed that the number of applications received and out-of-
 state tuition positively relates to graduation rate while part-time undergraduates negatively
 relates to graduation rate.

 To test the applicability and practical use of our model in forecasting graduation rates, the
 developed conceptual model in this research paper was used to forecast the graduation rates
 for two universities in Florida, USA as shown in Table.

 20
 Supporting Global Business Education since 1901
 © 2018 SIEC-ISBE
International Journal for Business Education, No 158 ISSN 2164-2877 (print)
 April 2018 ISSN 2164-2885 (online)

 Table 8
 A Forecasting Example
 No. of No. of PT Out-of-state Actual Forecasted
 Applications undergrad tuition Graduation Graduation
 rec'd rate Rate
 Stetson University 1557 81 12315 73% 69%
 University of Central 6986 7152 6618 46% 42%
 Florida

 The results in Table show that the multiple regression model developed in this research was
 able to forecast with close proximity the graduation rates at Stetson University and the
 University of Central Florida.

 The ability to forecast graduation rates with such proximity could predict whether the
 educational institution was exceeding, meeting, or below expectations. This helps in
 institutional planning and reflects overall quality of student learning, intellectual involvement
 and how effectively a campus delivers what students expect and need.

 Conclusion and Future Research

 This section summarizes the results of this paper and how the research conceptual model, data
 collection and data analysis were able to predict graduation rates. The data collection and
 analysis performed in section 4 led to three significant variables that relate to graduation rate:
 number of applications received, number of part-time undergrads and out-of-state tuition.
 These three variables were able to explain 42.4 % of the variation in the graduation rate.

 This research was able to reject the null hypothesis and support at 5% level of significance the
 alternative hypothesis that states: there is a correlation between “Applications Received,
 Applications Accepted, New students Enrolled, Part-time undergrads, Out-of-state Tuition and
 Student/faculty Ratio” and “Graduation Rates.” The analysis showed that the increase in
 number of applications received and out-of-state tuition significantly increases graduation rate,
 while the increase in the number of part-time undergraduates significantly decreases
 graduation rates. Since the increase in the number of part-time undergraduates negatively
 relates to graduation rates, future research can look into institutional policies for hiring their
 part-time students to work on-campus as an incentive for them to become full-time students.
 In addition to the positive relationship this might have on graduation rates, students who work
 on-campus do not have to worry about commuting to work and have the opportunity to build
 strong connections with the institutions’ faculty and staff. Further research can look into the
 commitment students work on-campus feel toward their degree completion and graduation
 when they have a secured job on-campus.

 21
 Supporting Global Business Education since 1901
 © 2018 SIEC-ISBE
International Journal for Business Education, No 158 ISSN 2164-2877 (print)
 April 2018 ISSN 2164-2885 (online)

 Future research can consider developing a “Linear Optimization” model. Optimization is the
 process of selecting values of decision variables that minimize or maximize a quantity of
 interest. The objective function can be to maximize graduation rate where the decision
 variables are: applications received, applications accepted, new students’ enrolled, part-time
 undergrads, out-of-state tuition and student/faculty ratio. Each higher education institution can
 identify the appropriate constraints and limitations for each of the decision variables. For
 example the lowest acceptable value for out-of-state or the highest ratio of student/faculty.
 Higher education institutions can find the right combination of decision variables that maximize
 their graduation rates.

 Since graduation rates have come to reflect overall quality of higher education institutions and
 how effectively a campus delivers what students expect and need, future research can also
 focus on gathering more data from universities as well as validating the data obtained to make
 sure it is up to date and correct. Additionally, a different study could be done specifically
 focusing on the graduation rates of four-year institutions since multiple studies have already
 been conducted only on two-year colleges as noted in this paper’s references. Then, research
 could be executed to compare the variables that impact four-year graduation rates to two-year
 rates. Furthermore, a comparison could be made between graduation rates in public versus
 private universities or certain schools, colleges. Future research can replicate the forecasting
 model at universities outside the United States of America. And finally, future research can
 investigate further the interaction between the independent variables and how the interaction
 might relate to graduation rates.

 References

 Crawford, G.A. (2015). The Academic Library and Student Retention and Graduation: An
 Exploratory Study. Portal: Libraries and the Academy, 15(1), pp. 41-57.
 Cook, B., & Pullaro, N. (2010). College graduation rates: Behind the numbers. Washington, DC:
 American Council on Education.
 DeAngelo, L., Franke, R., Hurtado, S., Pryor, J.H. & Tran, S. (2011). Completing College: Assessing
 Graduation Rates at Four-Year Institutions. Los Angles: Higher Education Research
 Institute.
 Deming, D.J., Cohodes, S., Jennings, J. & Jencks, C., (2016). When Does Accountability Work?
 Texas System Had Mixed Effects on College Graduation Rates and Future Earnings.
 Education Next, 16(1), pp. 71-76.
 Friedl, J., Pittenger, D.J. & Sherman, M. (2012). Grading Standards and Student Performance in
 Community College and University Courses. College Student Journal, 46(3), pp. 526-532.
 Haynes, K. S. (2016). College access as vital as improving graduation rates. San Diego Union-
 Tribune, The Web Edition Articles (CA).

 22
 Supporting Global Business Education since 1901
 © 2018 SIEC-ISBE
International Journal for Business Education, No 158 ISSN 2164-2877 (print)
 April 2018 ISSN 2164-2885 (online)

 Integrated Postsecondary Education Data System (2016). National Center for Educational
 Statistics.
 Joy, S. P. (2017). College graduation rates depend mainly on the students--but colleges matter
 too. Here’s how much. Online Submission. ERIC. Institute of Education Science.
 Melguizo, T. (2008). Quality Matters: Assessing the Impact of Attending More Selective
 Institutions on College Completion Rates of Minorities. Research in Higher Education,
 49(3), pp. 214-236.
 Montgomery, R. & Montgomery, B.L. (2012). Graduation Rates at Historically Black Colleges and
 Universities: An Underperforming Performance Measure for Determining Institutional
 Funding Policies. Journal of Continuing Higher Education, 60(2), pp. 93-109.
 Mooring, R.D. & Mooring, S.R. (2016). Predictors of Timely Baccalaureate Attainment for
 Underrepresented Minority Community College Transfer Students. Community College
 Journal of Research and Practice, 40(8), pp. 681-694.
 Moosai, S., Walker, D.A. & Floyd, D.L. (2011). Using Student and Institutional Characteristics to
 Predict Graduation Rates at Community Colleges: New Developments in Performance
 Measures and Institutional Effectiveness. Community College Journal of Research and
 Practice, 35(10), pp. 802-816.
 National Universities Ranking (2016). U.S News and World Report. Retrieved February 22, 2016,
 from http://colleges.usnews.rankingsandreviews.com/best-colleges.
 Paterson, N. & Gordon, G. (2010). How one university examined graduation rates of its
 undergraduate student population. Association for Institutional Research.
 Zhang, L. (2009). Does State Funding Affect Graduation Rates at Public Four-Year Colleges and
 Universities? Educational Policy, 23(5), pp. 714-731.

 23
 Supporting Global Business Education since 1901
 © 2018 SIEC-ISBE
International Journal for Business Education, No 158 ISSN 2164-2877 (print)
 April 2018 ISSN 2164-2885 (online)

 Revenge of the Nerds Revisited: Do Accounting and Finance Majors Differ from
 other Business Majors in Their Learning Styles, and do They Earn Higher Grades
 in a General Business Course?
 Todd J. Hostager
 Department of Management & Marketing
 University of Wisconsin-Eau Claire

 Corresponding Author: Todd J. Hostager, hostagtj@uwec.edu

 ABSTRACT

 Decades of research spanning a range of educational domains have confirmed that students differ in
 their learning styles and that student performance is impacted by the degree of fit between these styles
 and the teaching and assessment methods deployed in courses (Allinson & Hayes, 1988; Cegielski, Hazen
 & Rainer, 2011; Drissi & Amirat, 2017; Honn & Ugrin, 2012; Visser, McChlery & Vreken, 2006.) In this
 study, the researchers investigate whether a capstone business course— designed to accommodate a
 diverse range of learning styles— can succeed in leveling the playing field, yielding results showing no
 significant differences in course grades as a function of students’ learning styles. The second focus is
 examining the myth of bookish, nerdy accountants (Brighenti, 2010; Tuttle, 2016). The findings ‘bust’ the
 myth that more ‘bookish’ accounting and finance majors will earn higher course grades in a general
 business course. The paper concludes by noting some important implications of our study for future
 research and practice.

 Introduction

 Decades of research have confirmed that students differ in their learning styles and that student
 performance is impacted by the extent to which the teaching and assessment methods that are deploy
 in courses fit these styles (Allinson & Hayes, 1988; Cegielski, Hazen & Rainer, 2011; Drissi & Amirat,
 2017; Honn & Ugrin, 2012; Visser, McChlery & Vreken, 2006.) The implication for practice is clear:
 Learning style research is relevant to all educators who are concerned with designing and implementing
 effective course curricula addressing the diverse learning preferences that students bring to real and
 virtual classrooms of the 21st Century (Al-Omari, Carter & Chiclana, 2016; Coffield, Mosely, Hall &
 Ecclestone, 2004; Hayes & Allinson, 1996; Yang, Hwang & Yang, 2013.)

 Learning style refers to a student’s preferred modality for learning, including types of learning materials,
 media, tasks, processes, and assessments (Drissi & Amirat, 2017; Visser, McChlery & Vreken, 2006.)
 Although several learning style models have been proposed over the years—including models
 developed by Honey & Mumford (1992) and Kolb (1984)—the validity and reliability of Felder-Silverman
 model (1988) has made it the most dominant and widely-used approach in the literature (Al-Azawei &
 Badii, 2014; Litzinger, Lee, Wise & Felder, 2007; Riding & Reyner, 1998; Yang, Hwang & Yang, 2013.)

 24
 Supporting Global Business Education since 1901
 © 2018 SIEC-ISBE
International Journal for Business Education, No 158 ISSN 2164-2877 (print)
 April 2018 ISSN 2164-2885 (online)

 Working with Solomon, Felder developed a 44-item Index of Learning Styles (ILS) instrument to
 differentiate learning styles on four key dimensions outlined in the Felder-Silverman model (Felder &
 Solomon, 1996.) The validity and reliability of the ILS has been firmly established across a number of
 studies spanning multiple domains of inquiry (e.g., Al-Azawei & Badii, 2014; Felder & Spurlin, 2005;
 Litzinger, Lee, Wise & Felder, 2007; Graf, Viola, Leo & Kinshuk, 2007; Riding & Reyner, 1998; Zwyno,
 2003.) Table 1, compiled by Cegielski, Hazen & Rainer (2011), provides a succinct overview of the four
 ILS dimensions:

 Table 1
 Description of the Constructs Associated with Learning Styles
 Construct Description Example

 Active learners prefer to engage in group
 discussions and apply information to common
 The manner in which
 situations
 Active-Reflective one engages in
 processing information
 Reflective learners prefer to cogitate and
 internally process new information

 The extent to which one Sensing learners prefer the empirical facts and
 is inclined to embrace tangible work
 concrete or abstract
 Sensing-Intuitive forms of information to Intuitive learners prefer theories and rely on
 form a frame of their ability to identify general relationships
 reference for learning

 The degree to which Visual learners prefer to use pictures, diagrams,
 one favors either visual and charts in the learning process
 Visual-Verbal or textual input as the
 primary input mode in Verbal learners prefer textual input (written or
 the learning process spoken) of information in the learning process

 Sequential learners are inclined to apply a
 stepwise approach to assimilating new
 The degree to which information, perhaps recognizing the “big
 one prefers the picture” after comprehending the underlying
 Sequential-Global presentation of components of the information
 information in an
 incremental linear series Global learners more readily grasp the “big
 or holistic broad strokes picture” but often miss the details that support
 the overall message of the information

 The primary purpose of this study is to determine whether or not a capstone business course—
 designed to address a diverse set of learning styles— can succeed in overcoming individual differences

 25
 Supporting Global Business Education since 1901
 © 2018 SIEC-ISBE
International Journal for Business Education, No 158 ISSN 2164-2877 (print)
 April 2018 ISSN 2164-2885 (online)

 in learning preferences by yielding results showing no significant differences in course grades as a
 function of students’ learning styles. This finding would support a key practical implication in the
 learning style literature for business educators: Designing courses to address diverse learning styles can
 help educators level the playing field for students bringing different learning preferences to the
 classroom (Al-Omari, Carter & Chiclana, 2016; Coffield, Mosely, Hall & Ecclestone, 2004; Hayes &
 Allinson, 1996; Yang, Hwang & Yang, 2013.)

 The other key component of the study will examine the veracity of the perception that accounting and
 finance majors earn better grades in their courses than other majors in the business program at our
 institution. To this end, we will investigate whether or not a significant relationship exists among type of
 major and course grade earned, all within the comparatively field- and major-neutral setting of a
 required, senior-level strategic management capstone course expressly focused on the inclusion and
 integration of all functional areas in the analysis, decision-making, and conduct of a company’s
 operations. Using the ILS to gain an increased understanding of how different business majors vary in
 their learning style preferences will provide crucial insights for instructors, department chairs, program
 administrators, and others charged with the task of ensuring the design and delivery of effective
 learning experiences targeting the needs of a diverse student body.

 Hypotheses

 Relationships between Learning Style Preferences and Course Grades

 Felder and Spurlin (2005) advocated using the ILS to identify the diverse learning style profiles
 characterizing students enrolled in one’s classes. This approach can help instructors to design and
 implement course activities addressing the learning needs of all of their students. Ironically, the true
 test of how well an instructor succeeds in this regard is a null finding in the form of an observation that
 no significant differences in course grades exist in the sample as a function of learning styles.

 The researcher investigated this hypothesis in the context of a capstone course required of all business
 majors as part of their core experience. To control for unwanted variance due to differences in
 instruction and instructors, the same teacher was used across all three course sections in the study.
 Although many of the primary learning activities were delivered in a traditional live mode, the online
 learning materials, assignments, and grade-reporting were all made available through use of the web-
 based Desire2Learn (D2L) course management system. D2L is similar in features and functions to
 Blackboard and other online course management systems.

 Online learning resources were leveraged in a second way through integrating a team-based
 competitive web-based computer simulation into the course. The GLO-BUS simulation is a popular
 entry-level strategic management simulation available through the McGraw-Hill Irwin family of learning
 resources (McGraw-Hill Irwin, 2017). A full one-third of the course grade depended on students’
 performance in the online simulation, requiring student teams to compete through making

 26
 Supporting Global Business Education since 1901
 © 2018 SIEC-ISBE
International Journal for Business Education, No 158 ISSN 2164-2877 (print)
 April 2018 ISSN 2164-2885 (online)

 management decisions across a range of business functions— operations, marketing, human resources,
 accounting, finance— all within the context of running a digital camera company.

 Every effort was made to ensure that this capstone course in the business core was designed and
 implemented in such a way that it provided a rich learning experience covering the range of learning
 styles through including:

 1. Active and Reflective learning components— the online simulation (learning through
 Actively doing) and the traditional examinations (learning through Reflectively thinking);
 2. Sensing and Intuiting learning components— a focus on facts/details (Sensing) and seeing
 new relationships and the big picture (Intuiting) were both necessary for success in the
 online simulation and the examinations;
 3. Visual and Verbal learning components— supported through the use of 21st Century learning
 materials incorporating greater use of visual/graphical learning approaches to balance and
 augment the more traditional verbal/textual word-based approach, as found in the textbook
 and online materials, including those available via the GLO-BUS simulation web-site; and
 4. Sequential and Global learning components— Sequential learning supported through face-
 to-face lectures, textbook readings, and examinations, with Global learning supported
 through seeing complex interrelationships in a holistic manner via the online simulation.

 The study builds on Felder and Spurlin’s (2005) research by explicitly examining whether or not a sample
 comprised of students with diverse learning styles, taking a course designed to address the learning
 needs of these students, will yield a finding of no significant differences in course grades as a function of
 learning style:

 Hypothesis 1: No significant differences in course grades will be observed in students preferring
 an Active learning style versus students preferring a Reflective learning style (ILS Dimension #1-
 Active—Reflective).

 Hypothesis 2: No significant differences in course grades will be observed in students preferring
 a Sensing learning style versus students preferring an Intuiting learning style (ILS Dimension #2-
 Sensing—Intuiting).

 Hypothesis 3: No significant differences in course grades will be observed in students preferring
 a Visual learning style versus students preferring a Verbal learning style (ILS Dimension #3-
 Visual—Verbal).

 Hypothesis 4: No significant differences in course grades will be observed in students preferring
 a Sequential learning style versus students preferring a Global learning style (ILS Dimension #4-
 Sequential—Global).

 27
 Supporting Global Business Education since 1901
 © 2018 SIEC-ISBE
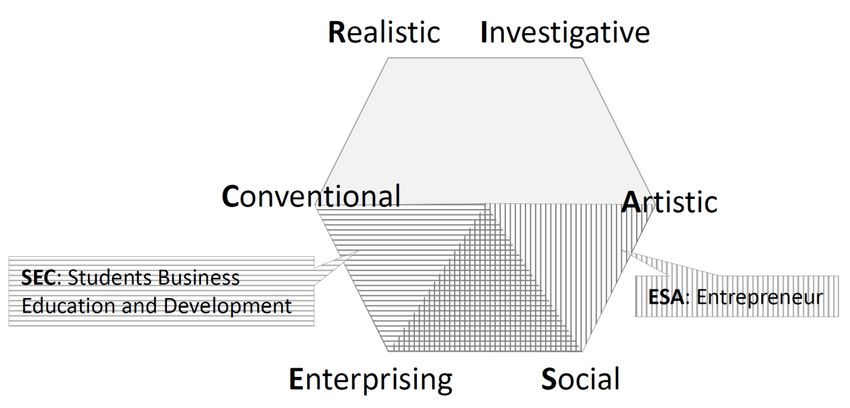
International Journal for Business Education, No 158 ISSN 2164-2877 (print)
 April 2018 ISSN 2164-2885 (online)

 Relationships among Major and Learning Style Preferences

 Of the many stereotypes surrounding the various fields, majors, and careers in business, perhaps none is
 so enduring as the myth of the nerdy, bookish accountant and financier, perpetuated through decades
 of media exposure and marked through such archetypal images as the veritable ‘black-rimmed, thick-
 lensed glasses’ (Brighenti, 2010; Tuttle, 2016.) One of the prevailing cultural myths at the academic
 institution is that if you are one of the ‘cream of the crop’ top students in the business program, you
 have what it takes to join the elite and become an accounting or finance major. Years of anecdotal
 evidence culled from dozens of students over the past two decades document the staying power of this
 culture-bound perception at the institution.

 Before one can so quickly dismiss the power of anecdotal evidence as a basis for formulating testable
 hypotheses, one must not forget that focus groups or other qualitative methods— and even common
 sense or intuition— are acceptable methods of selecting mediating factors where little prior research
 exists on the topic of interest, as noted in Table 2 (MacKinnon, Coxe & Baraldi, 2011):

 Table 2
 Methods of choosing mediators

 When there is substantial prior When little prior research is
 research on the topic available on the topic

 Literature review to determine Look for correlates of the
 conceptual theory and action outcome measure to determine
 theory links conceptual theory links

 Based on a psychological theory Focus groups and other
 of the process qualitative methods

 Prior mediation analysis Common sense or intuition

 To examine the myth of nerdy, bookish accounting and finance majors earning higher course grades in
 the context of a capstone business course, the researcher searched the literature and found no explicit
 learning style profile for these majors.

 However, a meta-analytical study by Felder and Spurlin (2005) documented a consistent learning style
 profile among engineering students, measured by Felder & Solomon’s (1996) Index of Learning Styles
 (ILS) across a dozen different institutions providing engineering programs. Administering the ILS to
 engineering majors produced a consistent picture of learning styles for those majors: engineering majors
 display a pronounced preference for Active, Sensing, Visual, and Sequential learning approaches.

 28
 Supporting Global Business Education since 1901
 © 2018 SIEC-ISBE
You can also read