INVESTIGATION DSC AND XRD ON THE CRYSTALLIZATION KINETICS IN THE PHOSPHATE LI2O LI2WO4 TIO2 P2O5 GLASSY IONIC SYSTEM
←
→
Page content transcription
If your browser does not render page correctly, please read the page content below
Investigation DSC and XRD on the Crystallization
Kinetics in the Phosphate
Li2O−Li2WO4−TiO2−P2O5 Glassy Ionic System
Hicham ES-SOUFI
Equipe de Physico-Chimie de la Matiére Condensée, PCMC, Faculté des Sciences de Meknès, Universite
Moulay Ismail, Morocco https://orcid.org/0000-0002-2075-1376
L. Bih
Chimie de la Matière Condensée de Paris: Laboratoire de Chimie de la Matiere Condensee de Paris
Alan R. F. Lima ( alan.quimicafct@gmail.com )
Cegep de Chicoutimi Sciences de la Nature Rod. Lauri Simoes, de Barros Km 12, 18290-000 Bauri, SP,
Brazil
A. El Bouari
Laboratory of Physico-Chemical of Applied Materials, Faculty of Sciences Ben M'Sik, Hassan II
University, Casablanca, Morocco
B. Manoun
Laboratoire des Sciences des Matériaux et de la Modélisation des Milieux (LS3M), Université Hassan
1er, 26000, Khouribga, Morocco
S. Hussain
School of Materials and Enginnering, Jiangsu University, Zhenjiang, 212013, China
Research Article
Keywords: Phosphate Glasses, Chemical durability, Crystallization Kinetic, Avrami parameter
Posted Date: February 15th, 2021
DOI: https://doi.org/10.21203/rs.3.rs-190511/v1
License: This work is licensed under a Creative Commons Attribution 4.0 International License.
Read Full License
Page 1/21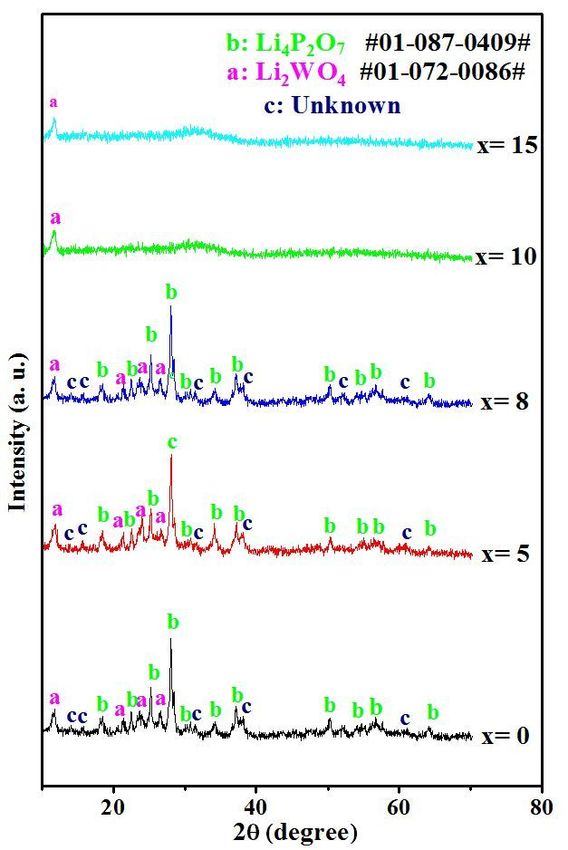
Abstract
This work aims to investigate the prepared glasses within the 20Li2O−(50−x)Li2WO4−xTiO2−30P2O5
system, with 0≤x≤15 mol%. The bonds constituting the framework of these glasses were studied by
Raman spectroscopy. The data analysis of the chemical durability showed that the dissolution rates
depend on the composition of each glass. Thermal analysis by DSC technique was used to determine the
activation energy of crystallization, it found in the glass of composition (x= 5) that Ec= 184.482 kJ/mol.
The determinate Avrami parameter is around 1.7 which allows suggesting the mechanism is surface
crystallization. The crystallization process of the prepared glasses is carried out by heating samples at
550°c for 4 hours and 12 hours. The crystallized phases are identified by XRD. The results of X−ray
diffraction analysis confirm that TiO2 acts mainly as network forming units. The crystalline phases
Li2WO4 (JCPDS# 01−072−0086) and (JCPDS# 01−087−0409) are formed during the crystallization
process. The formation of these crystalline phases into the glasses depends on the time of heating at
fixed crystallization temperature. FTIR spectra of the glass–ceramics show nearly the same IR vibrational
modes as their parent glasses.

1. Introduction
Glasses and glass-ceramics based phosphates have attracted the attention of many researchers. This is
due to their potential applications in technology, like solid electrolyte [1]. All-solid-state batteries using
solid electrolytes are expected to have long battery life [2]. Generally, chemical side reactions are inhibited
in inorganic solid electrolytes as the lithium ions move through these typical electrolytes. As a result of
this, all-solid-state batteries are potentially safer than conventional lithium-ion batteries [3]. Also, they are
considered to be ideal batteries for electric vehicles and plug-in hybrid electric vehicles [4]. The solid
electrolytes with lithium-ion conductivity are potentially investigated considering their use in power
sources [5-6]. Solid electrolytes based phosphate materials are good candidates owing to their easy
preparation, low melting point, wide glass-forming region, and simple composition [7-8]. Consequently, in
the last decades, scientists paid considerable attention to Li+ ion glassy electrolytes [9-10].

As well known, the ionic glasses have a wide thermal stability window, but they tend to crystallize at
certain temperatures (Tc). For this reason, their direct uses affect the performance of the ionic devices
during high-temperature applications [11, 12]. The glass-ceramics derived from glasses present lower
conductivity than the parent glasses. This depends on the low ionic conductivity of the precipitated
crystallites. Nevertheless, other glass-ceramics exhibit higher conductivity than the pristine glasses of the
same compositions, for example, in Ag+ ion-conducting AgI–Ag2O–MoO3 glasses. Also, glass-ceramics
obtained from the glass Li2O–Al2O3–TiO2–P2O5 system exhibited higher conductivity than the host glass
matrix. Indeed, the high conductivity is attributed to the formation of the LiTi2(PO4)3 phase during
crystallization [13]. There are many attempts to optimize ionic conductivity by stabilization the superionic
α-phase of ionic compounds in the glass matrix. The first successful attempt has been realized with the
stabilization of α-AgI within the glass AgI–Ag2O–B2O3 system by rapid quenching. Exceptionally, at room

                                                    Page 2/21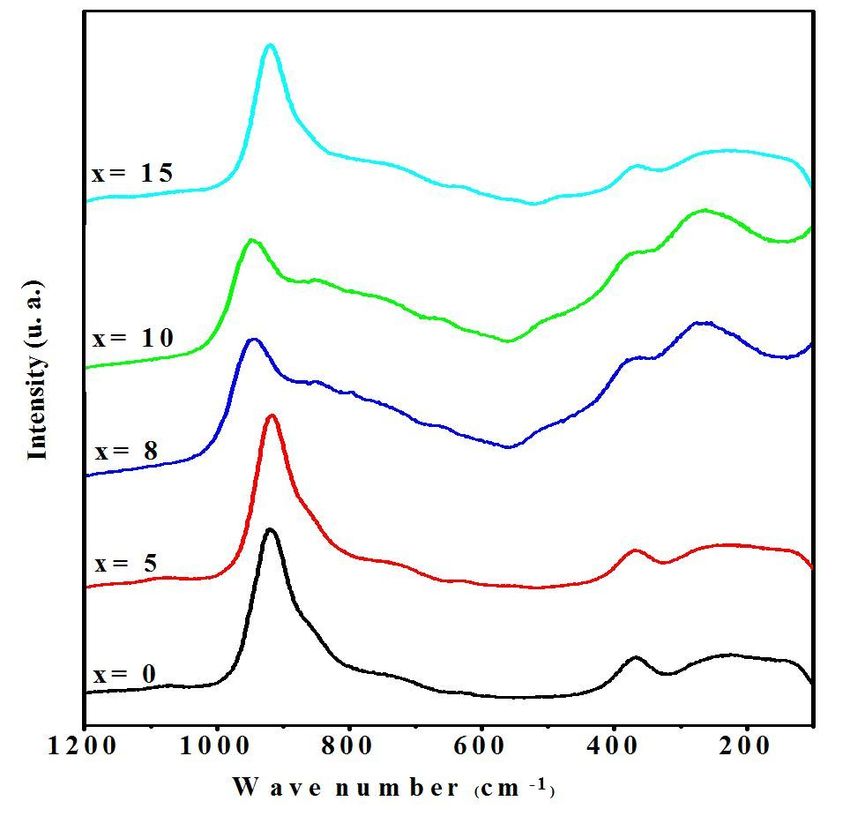
temperature α-AgI has been established in glass-ceramics of the AgI–Ag2O–B2O3 system, which resulted
in high Ag+ ion conductivity of 10−1 Ω−1 cm−1 [14].

Solid electrolytes based on crystalline phosphate materials are widely investigated in all-solid-state
batteries, for example, Li4P2O7. The XRD data analysis showed that Li4P2O7 crystallized in triclinic
structure with space group P-1. The linking LiO4 with P2O7 groups allows the formation of a framework
with large voids [15]. In this framework, Li+ ions move easily, thus high conductivity is obtained. In the
literature, it reported that Li4P2O7 has rather high conductivity (~10-1 s/m at 925k) [16]. E. Kartini et al.
studied Li4P2O7 in the Li4P2O7-Li3PO4 composite with the highest content of 93.56% Li4P2O7. This
composite achieved high ionic conductivity of 3.85 10-5 s/m at room temperature. This ionic conductivity
is higher in comparison to the single phase of LiPO3, Li3PO4, and Li4P2O7. As a result of this, the
composite Li4P2O7-Li3PO4 is a good solid electrolyte for all-solid-state batteries [17].

Another example, Li2WO4 compound crystallized in the monoclinic structure with space group (P2/m)
and the lattice parameters: a= 9.753A, b= 5.954A, c= 4.994A, α=γ=90° and β= 96.81°. A structural study
showed that the presence of some porosity is observed [18]. The presence of porosity is very important
for Li+ ions to move into the LiWO4 structure. The electrical conductivity was carried out in the [200°C-
500°C] temperature range. The electrical measurements showed the Li+ ion conductivity is about 2.18×10-
7
    s/cm at 300°C, and the activation energy is 0.94 eV [19]. The Li2WO4 and Li4P2O7 ionic conductors have
also been reported to exhibit electrical conductivity. Nevertheless, according to our best knowledge, there
is no work dealing with the Li2WO4-Li4P2O7 compound. Our attempts focused on precipitating Li2WO4
and Li4P2O7 crystallites in Li2O-Li2WO4-TiO2-P2O5 glasses [20, 21]. The precipitation of these crystallites
would greatly enhance the ionic conductivity of glass-ceramics. This study is performed to stabilize
single or more crystalline phases already known for their high ionic conductivity.

In the present article, we focused on investigating the prepared glasses within the Li2O-Li2WO4-TiO2-P2O5
system. Their characterization was carried out by Raman spectroscopy and chemical durability tests. The
crystallization kinetic study is performed by using thermal analysis. The glass-ceramics are characterized
by X-ray diffraction and Infrared spectroscopy (IR).

2. Experimental Procedure
2.1. Samples preparation

The phosphate glasses of the 20Li2O-(50-x)Li2WO4-xTiO2-30P2O5 system (x= 0, 5, 8, 10, and 15 mol %)
were prepared according to the protocol described in our previous work [20]. The amorphous state of
these colorless glasses is verified by XRD and confirmed by Raman spectroscopic analysis. Glass
samples were subjected to controlled thermal heat treatment through a two-step regime. The glasses
were first heat-treated at a rate of 10°C/minute to reach 550°C and kept at this temperature for 4 hours. In
the second heat-treatment step, the furnace temperature was raised to reach 550°C and kept at this
                                                    Page 3/21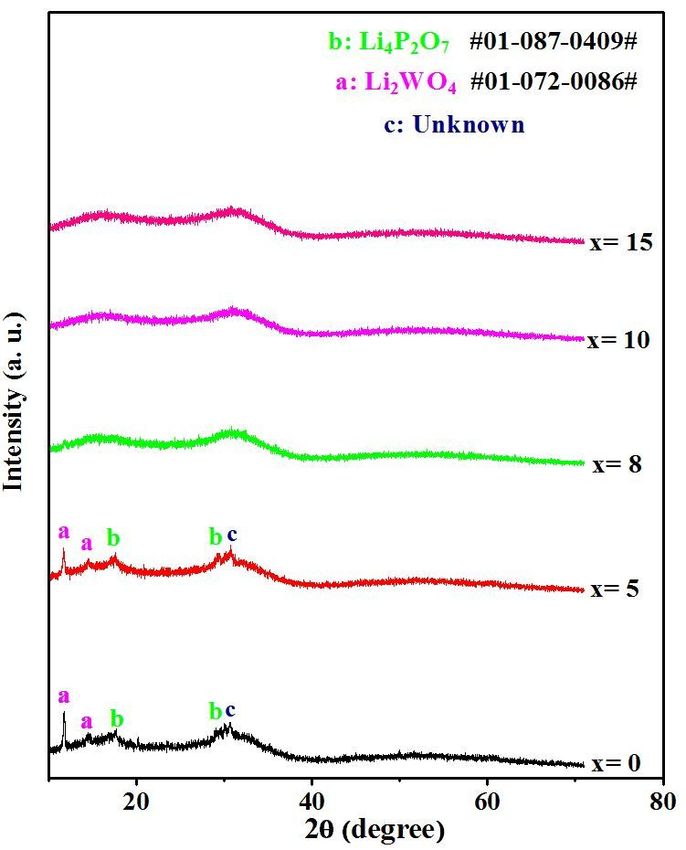
temperature for 12 hours, sufficient to provide sufficient nucleation sites. The electrical furnace with the
samples inside was switched off and then left to cool to room temperature at a rate of 1°C/min. These
specific temperatures were collected from DSC measurements. The obtained glass-ceramics were
analyzed by a X-ray diffractometer D5000 in the range of 2θfrom10oto80o. The X-ray data were analyzed
by X'Pert High Score Plus software to identify the crystalline phases.

2.2. Raman spectroscopy

The structural properties of the prepared glasses were studied by Raman spectroscopy. The Raman data
are obtained at room temperature by using a Horiba Jobin Yvon Lab Ram HR spectrometer. The spectra
were measured in backscattering geometry, under excitation with He–Ne laser radiation (632.8 nm) at a
power of 12 mW. The exposure time was 3 s, the accumulated number was 10, and the spectral slit width
was 1 mm.

2.3. Durability testing

Chemical durability test of the glasses is carried out to determine the dissolution rate in distilled water at
25°C. The prepared blocks of the glasses were placed into a bottle full of distilled water with pH= 6.8. The
bottles are suspended in a thermostated bath kept at 30˚C for 250 hours. The dissolution rate, DR, is
calculated from the equation DR=Dx/(S.t), where Dx is the mass loss (g), S is the glass surface (cm2)
before the dissolution test, and ‘t’ is time of immersion (min). The pH value of leaching for each glass is
measured every 24 hours by a pH-meter.

2.4. Crystallization kinetics

The crystallization kinetics of the glasses is studied by differential scanning calorimetry (DSC). The fine
grain powdered sample (< 50 µm) of about 40 mg was placed in an aluminum crucible and heated at a
rate of 5°C/min, 8°C/min, 10°C/min, and 12°C/min using a DSC 131 Evo analyzer, from ambient
temperature to 550°C. The obtained data are investigated to determine the peak crystallization
temperature (Tp).

2.5. Infrared spectroscopy

The structural units formed the glass-ceramics were analyzed by a Fourier Transform Infrared (FTIR)
spectrometer. The IR spectra were recorded at room temperature in the frequency range (400–1500) cm-1.
The samples were ground to a fine powder and then mixed with KBr powder to prepare pellets for this
study.

3. Results And Discussion
3.1. Raman spectroscopy

                                                  Page 4/21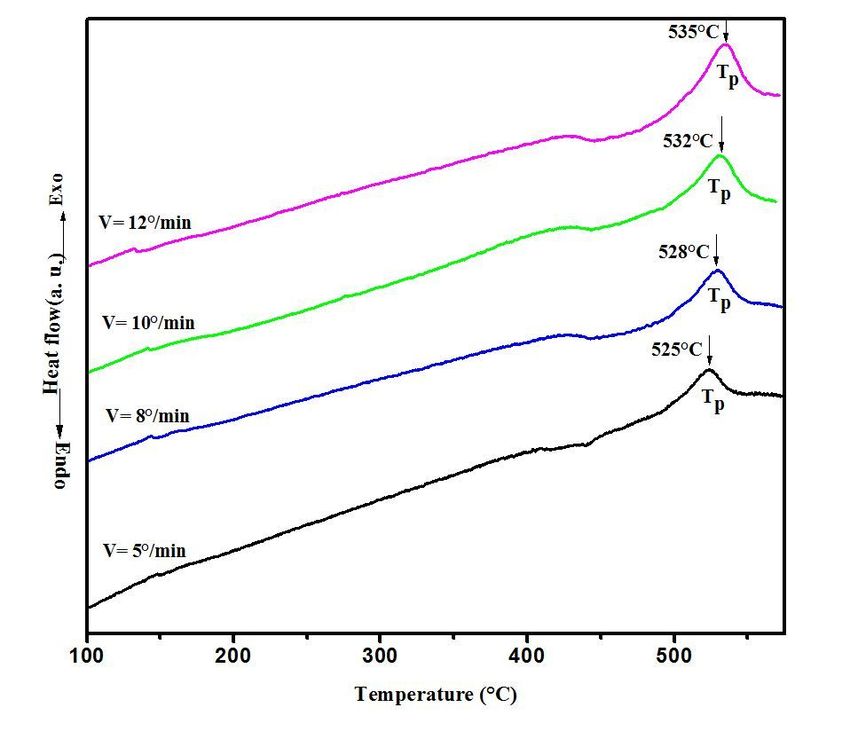
Figure 1 presents the Raman spectra of the phosphate 20Li2O-(50-x)Li2WO4-xTiO2-30P2O5 glasses
recorded in the wavenumber region 1200 cm-1-150cm-1. The band positions and their assignments are
gathered in Table 1. The Raman spectra show different bands situated at different positions: 1055 cm-1,
930 cm-1, 870 cm-1, 740 cm-1, 635-510 cm-1, 372 cm-1 and 250 cm-1. The assignments of these bands
were made by comparing with literature data [22-25]. From the band positions, we divided the Raman
spectra into the three wavenumber regions:

  i. In the high wavenumber region, there is a band of low intensity at the position 1055 cm-1. This band
    is attributed to the asymmetric vibration Vas(P-O-), Q1 units. The band at 930 cm−1 of high intensity is
    assigned to the asymmetric vibration of the bond P-O− into Q0 units or to the symmetric vibration M-
    O- in a polyhedron with (M= W, Mo).
  ii. For the intermediate region, a band the low intensity at 870 cm−1 it observed, associated with the
      symmetric vibration mode of the bond W–O bond of the WO6 polyhedron and/or W-O-P bond. Also, a
    band of low intensity is situated at the position 740 cm-1 attributed to the symmetric vibration of the
    P–O–P bond of the Q1
 iii. In the low wavenumber region, the bands situated between 635 cm-1 and 250 cm−1 could be
      attributed to the stretching mode of the [PO4] units.

After the substitution by TiO2 in the glass composition (x= 5), two supplementary bands are observed.
These bands are situated around the positions 914 cm-1 and 742 cm-1 attributed to the TiO4 and TiO6,
respectively [26]. At TiO2 content increased, Raman spectra change, especially in the region of low
frequencies.

This shows that several structural units are present in the various networks. Besides, there is a
considerable change in the intensity of the structural units of TiO4. Such variations suggest that titanium
ions occupy distorted octahedral positions and modify the vitreous matrix increasing the number of non-
bridging oxygens (NBO). When TiO2 is present in larger quantities (x> 8), the P=O bond can be broken by
structural units of TiO4, which can cause the creation of new non-bridging oxygen ions facilitating the
formation of structural units [TiO6/2]2- [27]. The analysis of Raman spectra shows that the degree of
depolymerization of the glass lattice and the quality of TiO6 structural units increases with increasing
TiO2 content.

3.2. Chemical durability

3.2.1 Weight loss

Chemical durability is expressed by the resistance of the glasses to the attack of chemical species found
in a solution. This attack takes place through the process of ion exchange in the hydrated layer. When the

                                                  Page 5/21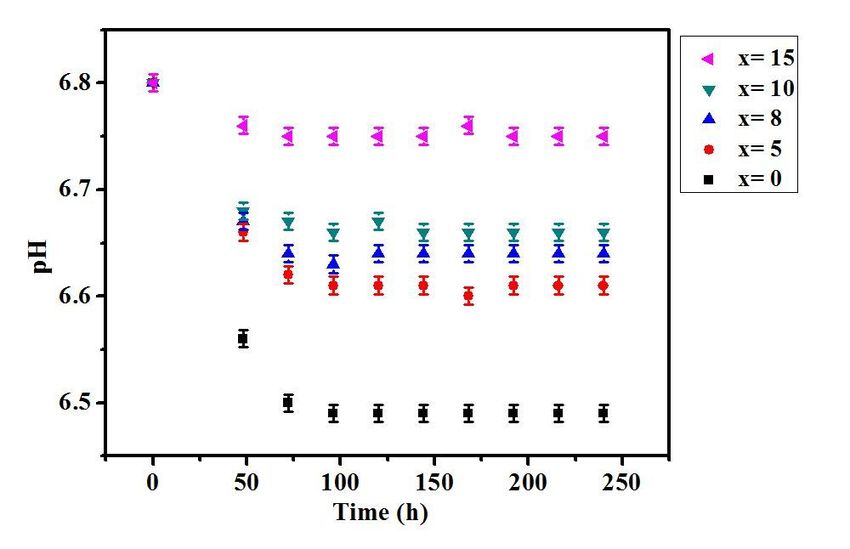
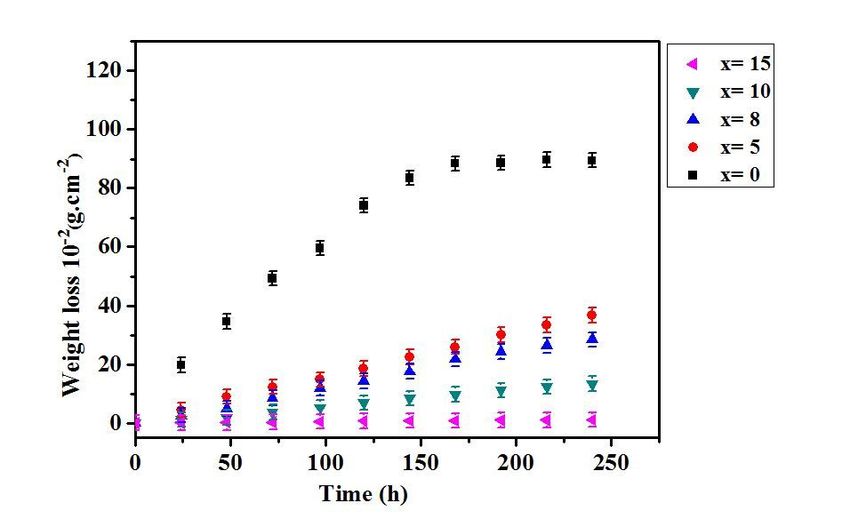
chains are completely surrounded by water, they can separate from the partially hydrated chains and
dissolve in solution. Once the hydrated layer is constant, the dissolution is linear over time [28].

Figure 2 represents the evolution of the weight loss at the initial surface (g.cm-2) of the glass as a
function of time (h). From figure 2, it is noted that the glasses present similar dissolution behavior. We
can clearly differentiate two stages or two phases: i) for t
associated with the saturation of the altering solution. This leads to the formation of a protective layer
against diffusion through the surface of the glass.

3.3. Crystallization kinetics by DSC

The activation energy (Ec) of crystallization was calculated by using the following modified form of
Kissinger equation (1), established by Matusita and Saka [35].

Ln(T2p/β=Ec/(RTP) + constant (1)

Where βR and Tp are the heating rate, the universal gas constant and the peak temperature, respectively.

From the value of the activation energy (Ec), the Avrami exponent (n) was calculated using Augis–
Bennett equation (2) [36]:

n= (2.5/ΔT)×(RT2P/Ec) (2)

Where ΔT is the full width of the exothermic DSC peak at the half-maximum intensity, and (n) is the
Avrami exponent or crystallization index. The Avrami exponent (n) had indicated the nucleation and
growth mechanism. According to the Johnson–Mehl–Avrami (JMA) theory, (n) was also related to
crystallization pattern, n= 2 means that the surface crystallization dominants the overall crystallization,
n= 3 means two-dimensional crystallization, n= 4 means that three-dimensional crystallization for bulk
materials [37-39].

Figure 4 plots the DSC curves for the composition glass (x= 5) obtained at different heating rates. The
DSC curves present a broad crystallization peak shifted to high temperature with an increase in the
heating rate. The obtained crystallization temperature (Tp) for the glass (x = 5 mol %) is listed in Table 2.
The plot of ln(Tp2/β) versus 1/Tp is shown, a straight line is obtained (see Figure 5), and from its slope,
the value of Ec can be determined. The value of Ec obtained is 184.482 kJ/mol. The value calculated for
(n) is very close to 1.7, suggesting that surface crystallization is dominant during the crystallization of the
glasses [40, 41].

3.4. Crystallization of the prepared glasses

Figures 6 and 7 correspond to the X-ray patterns of glass-ceramics derived from the glasses of the
20Li2O-(50-x)Li2WO4-xTiO2-30P2O5 system. The X-ray patterns gathered in Figure 6 showed the
crystallization of crystalline phases into the compounds (x= 0 and 5) Li2WO4 (JCPDS# 01-072-0086) and
Li4P2O7 (JCPDS# 01-087-0409) during 4 hours. At high TiO2 content (x = 8, 10 et 15 mol%), no crystalline
phase formed. Nevertheless, at increasing the heating duration around 12 hours, it observed that the peak
intensity of the crystalline phases Li2WO4 (JCPDS# 01-072-0086) and Li4P2O7 (JCPDS# 01-087-0409)
increased for the same composition (x= 0 et 5). But, in the compositions (x= 8, 10 et 15) there are peaks
corresponding to the crystalline phases Li4P2O7 (JCPDS# 01-087-0409). It seems that the vitreous

                                                   Page 7/21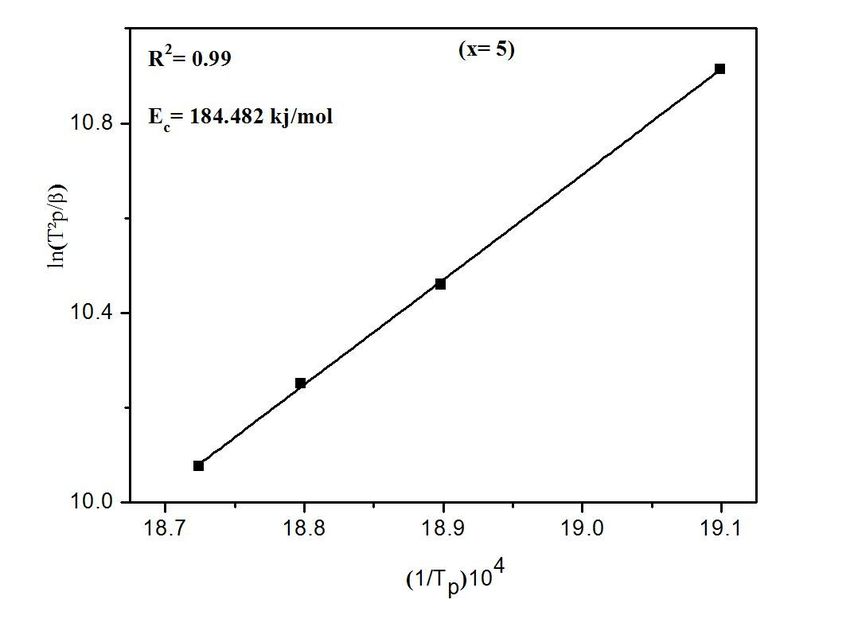
network of glasses contains structural units of the pyrophosphate type. The crystallization times of the
glasses for 4 hours and 12 hours, insufficient for the formation of crystallized phases contain the
titanium within the pieces of the heat-treated glasses.
3.5. Infrared spectra of the glass-ceramics
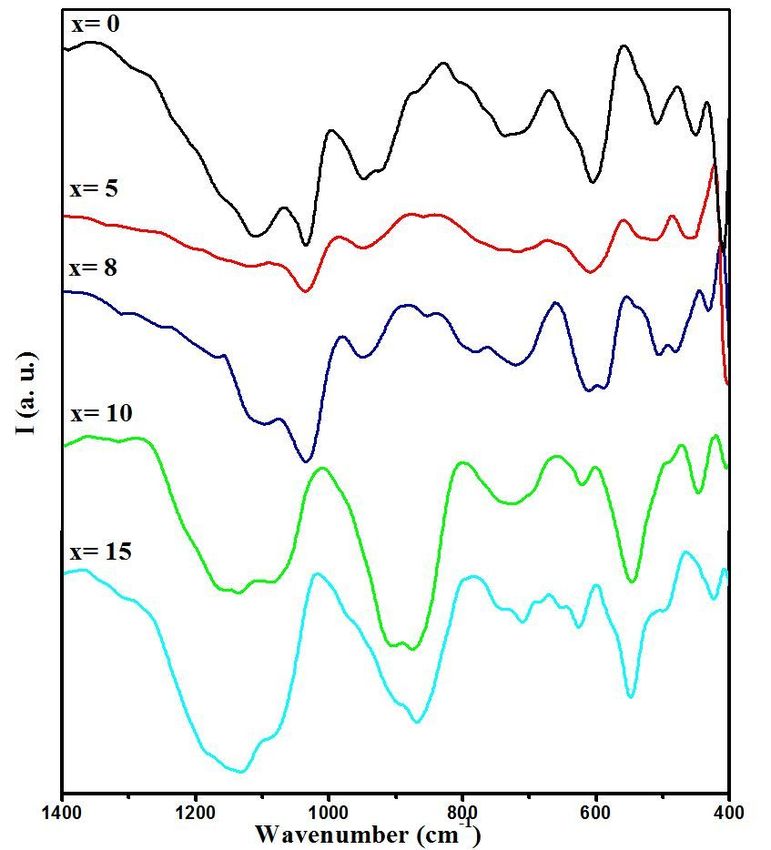
Figure 8 shows the IR spectra of the prepared glass-ceramics heated at 550°C for 12h. These spectra
contain the same principal bands of the phosphate glasses with sharp differences between the glasses
(previous work [20]) and their derived glass-ceramics. Both spectra show several absorption bands
localized around 1275, 1120, 1085–1050, 940, 860, 745, 605, 510 and 450cm-1. The assignment of the
absorption bands was done according to our previous work [20]. In comparison between the absorption
bands, it is observed that the FTIR spectra of the glass-ceramics show nearly the same IR vibrational
modes as their parent glasses. The IR spectra of the glass-ceramics reveal a few sharp peaks in the far IR
region and the mid-region spectrum. Due to the stretching of main phosphate network groups, it appears
lower in the intensity of the vibrational bands. This result confirms that the crystalline phases separated
where the X-ray data indicate that the formation of two new crystalline phases (Li2WO4 and Li4P2O7),
which are suggested to be somewhat compacted or limited to two phases.
4. Conclusions
The Raman spectra of the prepared glasses show a conversion of metaphosphate units into
pyrophosphate and orthophosphate units during the substitution of Li2WO4 by TiO2. Crystallization
kinetics of glasses are reported by DSC, where the activation energy depends on the chemical
composition of the glass. The parameter Avrami shows that the crystallization of the glasses takes place
according to a surface mechanism. In addition, the formation of the crystalline phases depends on the
temperature and heat treatment time. Glass-ceramics obtained from the studied glasses submitted to
heating at two different durations were exploited by XRD and FTIR. Whereas the crystallized phases into
prepared glasses depend on the composition and the conditions of treatment. FTIR analysis has shown
that the absorption bands of both spectra (glasses and glass-ceramics) were presented the same bands
with quite different. Also, the results of the IR analysis confirmed the formation of the crystalline phases
identified by X-ray diffraction.
Declarations
CRediT authorship contribution statement
H. Es-soufi: Conceptualization, Writing - review & editing. L. Bih: Supervision. Alan R. F. Lima:
Visualization. A. El Bouari: Visualization. B. Manoun: Investigation. S. Hussain: Visualization.
Acknowledgments
Page 8/21The authors are grateful to G. Bánhegyi (Medicontur Medical Engineering Ltd., Herceghalmi út 1,
Zsámbék 2072, Hungary) for his comments and valuable suggestions.
Competing Interests
The authors declare no competing interests.
References
[1] Ishiyama, T., Suzuki, S., Nishii, J., Yamashita, T., Kawazoe, H., & Omata, T. (2014). Proton conducting
tungsten phosphate glass and its application in intermediate temperature fuel cells. Solid State
Ionics, 262, 856-859. https://doi.org/10.1016/j.ssi.2013.10.055
[2] S. Hussain, X. Yang, M. Kashif Aslam, A. Shaheen, M. Sufyan Javed, N. Aslam, B. Aslam, G. Liu, G.
Qiao, Robust TiN Nanoparticles Polysulfide Anchor for Li–S Storage and Diffusion Pathways Using First
Principle Calculations, Chemical Engineering Journal (2019), doi:
https://doi.org/10.1016/j.cej.2019.123595
[3] S. Hussain, M.S. Javed, S. Asim, A. Shaheen, A.J. Khan, Y. Abbas, N. Ullah, A. Iqbal, M. Wang, G. Qiao,
S. Yun, Novel gravel-like NiMoO4 nanoparticles on carbon cloth for outstanding supercapacitor
applications, Ceramics International (2019), doi: https://doi.org/10.1016/j.ceramint.2019.11.118.
[4] Minami, T., Hayashi, A., and Tatsumisago, M. (2006). Recent progress of glass and glass-ceramics as
solid electrolytes for lithium secondary batteries. Solid State Ionics. 177, 2715–2720.
https://doi.org/10.1016/j.ssi.2006.07.017
[5] V.I. Voronin, E.a. Sherstobitova, V.a. Blatov, G.S. Shekhtman, J. Solid State Chem. 211 (2014) 170–175.
https://doi.org/10.1016/j.jssc.2013.12.015
[6] Kartini, E., Nakamura, M., Arai, M., Inamura, Y., Nakajima, K., Maksum, T., ... & Putra, T. Y. S. P. (2014).
Structure and dynamics of solid electrolyte (LiI) 0.3 (LiPO3) 0.7. Solid State Ionics, 262, 833-836..
https://doi.org/10.1016/j.ssi.2013.12.041
[7] Minami, T. (1985). Fast ion conducting glasses. Journal of Non-Crystalline Solids, 73(1-3), 273-284.
https://doi.org/10.1016/0022-3093(85)90353-9
[8] Knauth, P. (2009). Inorganic solid Li ion conductors: An overview. Solid State Ionics, 180(14-16), 911-
916.. https://doi.org/10.1016/j.ssi.2009.03.022
[9] Tatsumisago, M. (2004). Glassy materials based on Li2S for all-solid-state lithium secondary
batteries. Solid State Ionics, 175(1-4), 13-18. https://doi.org/10.1016/j.ssi.2004.09.012
Page 9/21[10] Minami, K., Mizuno, F., Hayashi, A., & Tatsumisago, M. (2007). Lithium ion conductivity of the Li2S–
P2S5 glass-based electrolytes prepared by the melt quenching method. Solid State Ionics, 178(11-12),
837-841.. https://doi.org/10.1016/j.ssi.2007.03.001
[11] Robertson, A. D., West, A. R., & Ritchie, A. G. (1997). Review of crystalline lithium-ion conductors
suitable for high temperature battery applications. Solid State Ionics, 104(1-2), 1-11.
https://doi.org/10.1016/S0167-2738(97)00429-3
[12] Henriksen, G. L., & Vissers, D. R. (1994). Lithium-aluminum/iron sulfide batteries. Journal of power
sources, 51(1-2), 115-128. https://doi.org/10.1016/0378-7753(94)01965-7
[13] Soman, S., Iwai, Y., Kawamura, J., & Kulkarni, A. (2012). Crystalline phase content and ionic
conductivity correlation in LATP glass–ceramic. Journal of Solid State Electrochemistry, 16(5), 1761-
1766. https://doi.org/10.1007/s10008-011-1592-4
[14] Tatsumisago, M., Shinkuma, Y., & Minami, T. (1991). Stabilization of superionic α-Agl at room
temperature in a glass matrix. Nature, 354(6350), 217-218.
[15] Voronin, V. I., Sherstobitova, E. A., Blatov, V. A., & Shekhtman, G. S. (2014). Lithium-cation conductivity
and crystal structure of lithium diphosphate. Journal of Solid State Chemistry, 211, 170-175.
https://doi.org/10.1016/j.jssc.2013.12.015
[16] Kartini, E., Yapriadi, V., Jodi, H., Manawan, M., & Panghegar, C. (2020). Solid electrolyte composite
Li4P2O7–Li3PO4 for lithium ion battery. Progress in Natural Science: Materials International.
https://doi.org/10.1016/j.pnsc.2020.01.020
[17] Horiuchi, H., Morimoto, N., & Yamaoka, S. (1980). The crystal structure of Li2WO4 (IV) and its relation
to the wolframite-type structure. Journal of Solid State Chemistry, 33(1), 115-119.
https://doi.org/10.1016/0022-4596(80)90554-X
[18] Krishantha, D. M. M., Rajapakse, R. M. G., Tennakoon, D. T. B., & Dias, H. V. R. (2006). Polypyrrole-
montmorillonite nanocomposite: a composite fast ion conductor. Journal of composite materials, 40(11),
1009-1021. https://doi.org/10.1177/0021998305056388
[19] Es-soufi, H., Bih, L., Manoun, B., & Lazor, P. (2017). Structure, thermal analysis and optical properties
of lithium tungsten-titanophosphate glasses. Journal of Non-Crystalline Solids, 463, 12-18.
https://doi.org/10.1016/j.jnoncrysol.2017.02.013
[20]. H. Es-Soufi, L. Bih, B. Manoun & P. Lazor, Structure, thermal analysis and optical properties of lithium
tungsten-titanophosphate glasses, (2017). J. Non-Crystalline Solids, 463, 12-18.
ttps://doi.org/10.1016/j.jnoncrysol.2017.02.013
[21] Ismail, S. F., Sahar, M. R., & Ghoshal, S. K. (2016). Effects of titanium nanoparticles on self-cleaning
and structural features of zinc-magnesium-phosphate glass. Materials Research Bulletin, 74, 502-506.
Page 10/21https://doi.org/10.1016/j.materresbull.2015.11.022
[22] Rao, K. S., Reddy, M. S., Kumar, V. R., & Veeraiah, N. (2008). Dielectric, magnetic and spectroscopic
properties of Li2O–WO3–P2O5 glass system with Ag2O as additive. Materials Chemistry and
Physics, 111(2-3), 283-292. https://doi.org/10.1016/j.matchemphys.2008.04.012
[23] Marasinghe, G. K., Karabulut, M., Ray, C. S., Day, D. E., Allen, P. G., Bucher, J. J., ... & Shastri, S. (2003).
Effects of nuclear waste components on redox equilibria, structural features, and crystallization
characteristics of iron phosphate glasses. Ceram. Trans., 93.
[24] Fang, X., Ray, C. S., Moguš-Milanković, A., & Day, D. E. (2001). Iron redox equilibrium, structure and
properties of iron phosphate glasses. Journal of non-crystalline solids, 283(1-3), 162-172.
https://doi.org/10.1016/S0022-3093(01)00416-1
[25] Krishna, G. M., Kumari, B. A., Reddy, M. S., & Veeraiah, N. (2007). Characterization and physical
properties of Li2O–CaF2–P2O5 glass ceramics with Cr2O3 as a nucleating agent—Physical
properties. Journal of Solid State Chemistry, 180(10), 2747-2755.
https://doi.org/10.1016/j.jssc.2007.07.025
[26] Nagarjuna, M., Satyanarayana, T., Gandhi, Y., & Veeraiah, N. (2009). Influence of Ag2O on some
physical properties of LiF–TiO2–P2O5 glass system. Journal of alloys and compounds, 479(1-2), 549-
556. https://doi.org/10.1016/j.jallcom.2008.12.132
[27] Delahaye-Carrière, F. (1997). Influence de la solution altérante sur la dissolution des verres du
système (50-x) Na2O-xCaO-50P2O5 (Doctoral dissertation, Compiègne).
[28] Es-Soufi, H., Bih, L., & Benzineb, M. (2019). Study of Tungsten Phosphate Glasses Containing
Fe2O3. New Journal of Glass and Ceramics, 9(3), 33-49. https://doi.org/10.4236/njgc.2019.93004
[29] El Hadrami, A., Mesnaoui, M., Maazaz, M., & Videau, J. J. (2003). Kinetic dissolution of phosphate
glasses containing toxic heavy metals. Journal of non-crystalline solids, 331(1-3), 228-239.
https://doi.org/10.1016/j.jnoncrysol.2003.08.066
[30] Ma, L., Brow, R. K., & Schlesinger, M. E. (2017). Dissolution behavior of Na2O–FeO–Fe2O3–P2O5
glasses. Journal of Non-Crystalline Solids, 463, 90-101.
https://doi.org/10.1016/j.jnoncrysol.2017.02.022
[31] Li, X., Xiao, Z., Luo, M., Dong, X., Du, T., & Wang, Y. (2017). Low melting glasses in ZnO-Fe2O3-P2O5
system with high chemical durability and thermal stability for sealing or waste immobilization. Journal of
Non-Crystalline Solids, 469, 62-69. https://doi.org/10.1016/j.jnoncrysol.2017.04.023
[32] Ma, L., Brow, R. K., Ghussn, L., & Schlesinger, M. E. (2015). Thermal stability of Na2O–FeO–Fe2O3–
P2O5 glasses. Journal of Non-Crystalline Solids, 409, 131-138.
Page 11/21https://doi.org/10.1016/j.jnoncrysol.2014.11.019
[33] Poluektov, P. P., Schmidt, O. V., Kascheev, V. A., & Ojovan, M. I. (2017). Modelling aqueous corrosion of
nuclear waste phosphate glass. Journal of Nuclear Materials, 484, 357-366.
https://doi.org/10.1016/j.jnucmat.2016.10.033
[34] Kissinger, H. E. (1956). Variation of Pedk Temperature With Hedting Rote in Differentidl Thermal
Andlysis. Journal of research of the National Bureau of Standards, 57, 217.
[35] Augis, J. A., & Bennett, J. E. (1978). Calculation of the Avrami parameters for heterogeneous solid
state reactions using a modification of the Kissinger method. Journal of thermal analysis, 13(2), 283-292.
https://doi.org/10.1007/BF01912301
[36] Avrami, M. (1939). Kinetics of phase change. I General theory. The Journal of chemical
physics, 7(12), 1103-1112. https://doi.org/10.1063/1.1750380
[37] Avrami, M. (1940). Kinetics of phase change. II transformation‐time relations for random distribution
of nuclei. The Journal of chemical physics, 8(2), 212-224. https://doi.org/10.1063/1.1750631
[38] Avrami, M. (1941). Kinetics of phase change. III: Granulation, phase change and
microstructure. Journal of chemical physics, 9, 177-184. https://doi.org/10.1063/1.1750872
[39] Tosić, M. B., Dimitrijević, R. Ž., & Mitrović, M. M. (2003). The crystallization of calcium phosphate
glass with the ratio [CaO]/[P 2 O 5]< 1. Journal of materials science, 38(9), 1983-1994.
https://doi.org/10.1023/A:1023585321475
[40] Haily, E., Bih, L., El Bouari, A., Lahmar, A., El Marssi, M., & Manoun, B. (2020). Structural, optical, and
dielectric properties of Bi2O3-K2O-TiO2-P2O5 glasses and related glass-ceramics. Phase Transitions, 1-
18. https://doi.org/10.1080/01411594.2020.1837369
[41] ElBatal, F. H., Marzouk, M. A., & ElBatal, H. A. (2016). Optical and crystallization studies of titanium
dioxide doped sodium and potassium silicate glasses. Journal of Molecular Structure, 1121, 54-59.
https://doi.org/10.1016/j.molstruc.2016.05.052
Tables
Table 1. Raman band assignments in the 1200-100 cm-1 range frequency for the studied phosphate
glasses.
Page 12/21Position of band (cm-1) Band assignment
1055 - 2
Vs(PO2) ,Q
930 Vas(P-O-P)/Vas(P-O-M) (M= Mo. Ti)
870 O-Mo-O/MO4/MO6(M= Mo. Ti)
740 Q1
Vs(P-O-P),
635-510 Q2
Vs(P-O-P),
372 Vs(M-O-M)(M= Mo, Ti)
250 δ(PO4)
Table 2: Crystallization temperature of the glass (x = 5 mol %) at different heat crystallization rates.
Glass β(°C/min-1) Tp ΔT Avrami parameter (n)
x= 5 5 524 14 2.20
8 528 16 1.96
10 532 22 1.45
12 534 25 1.28
Figures
Page 13/21Figure 1
Raman spectra of the studied glasses
Page 14/21Figure 2
Evolution of the weight loss of the glasses as a function of time (h)
Page 15/21Figure 3
Evolution of the pH of the glasses as a function of time (h)
Page 16/21Figure 4
DSC curves for the glass (x = 5) under different heating rates
Page 17/21Figure 5
Plot of ln(T2π/β) versus inverse temperature for the glass
Page 18/21Figure 6
XRD patterns of the crystallized glasses at 550°C for 4 h
Page 19/21Figure 7
XRD patterns of the crystallized glasses at 550°C for 12 h
Page 20/21Figure 8
FTIR spectra of the crystallized glasses at 550°C for 12h
Page 21/21You can also read