Investigation of Preliminary Student Test Performance Data using the ANOM Statistical Tool and Mixed Model Analysis
←
→
Page content transcription
If your browser does not render page correctly, please read the page content below
Investigation of Preliminary Student Test Performance Data using the
                ANOM Statistical Tool and Mixed Model Analysis

                Anja Habus-Korbar1, Vesna Lužar-Stiffler2,3, PhD, Vanda Bazdan1
  1
      National Center for External Evaluation of Education, Marulićev trg 18, Zagreb, Croatia
                     2
                       University Computing Centre – Srce and 3CAIR Center
                                         Zagreb, Croatia
                  anjahk@ncvvo.hr , vluzar@srce.hr, vanda.bazdan@ncvvo.hr

   Abstract. The aim of this paper is to            the differences among different programs and
demonstrate the analytical use of a statistical     counties it was reasonable to suspect that the
tool (ANOM), more commonly used by quality          interactions among these factors may be
control engineers, to investigate differences       significant. Section 6 illustrates the use of the
found in Croatian high school student               ANOM procedure for two-way effects, applied
performance on the Mathematics exam, recently       due to the results of previous analysis. For the
developed as a part of the National                 final analysis, in section 7, a mixed model (with
Examinations Project                                schools and classes as random, nested effects)
                                                    was developed.
Keywords. National examination, Analysis of
means, ANOM, Mixed models, Mathematics              2. Background
scores.
                                                        The survey was carried out on the sample size
1. Introduction                                     of 2664 2nd grade students attending Croatian
                                                    gymnasium programs.
    The research is based on the results of the         The data was collected through the National
National exam in Mathematics organized by the       exam in Mathematics, conducted at the
National Center for External Evaluation of          beginning of the second semester (February,
Education (NCVVO). The objects and functions        2007). It had two goals: (1) to see how well the
of NCVVO, among others, is to monitor and           students are performing in general and (2) to
evaluate global and regional performance of         investigate if significant differences exist in
students in order to improve the quality of         performance of students living in different parts
Croatian      educational      system.   National   of the country (21 Croatian counties) and also to
examination is a testing procedure conducted on     observe if differences exist for different
high school students with a goal to learn more      gymnasium programs. In Croatian schools there
about student knowledge and the educational         are four types of gymnasium programs: general,
system. It also serves as a preparation for         language, mathematics and classical. The final
students and teachers for the final high school     test results for all subjects and across different
exam which will be held as a standardized,          counties, programs and schools were presented
uniform test for the first time in 2009.            to the general public.
    The paper is divided into the following             In this paper we focus only on the data
sections: After the introduction and the            available at the time and statistical methodology
background of the National examinations project,    used to detect key differences among groups of
Section 3 concentrates on the description and       high school students.
history of the ANOM procedure. In section 4 we
present the global descriptive statistics and the   3. Analysis of Means (ANOM)
distribution of scores (globally and also by
programs and by different counties). The               After applying standard procedures for
Shewhart procedure was used for visualization of    describing the data, the Shewhart procedure for
the differences among programs and counties. In     visualizing performance across different groups
section 5, we cover the results obtained from the   and the three-way ANOVA to test for significant
three-way analysis of variance. After detecting     effects and interactions, we had to use a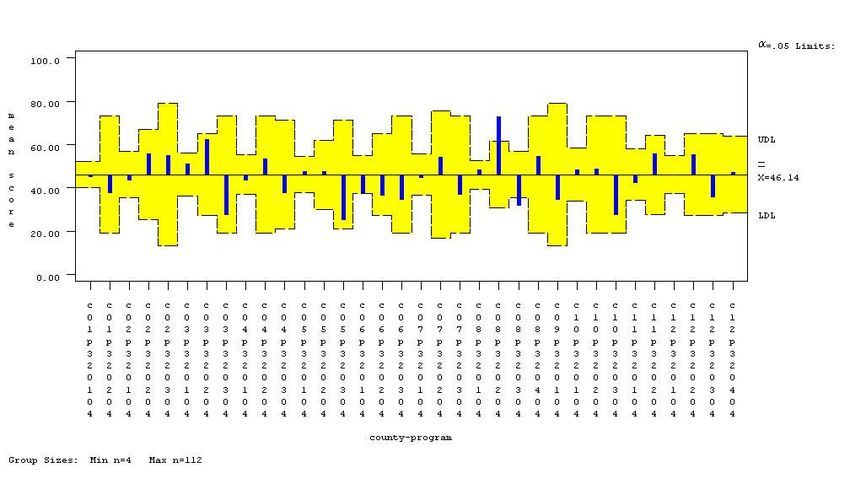
procedure which would test the difference English percent maximum test scores each had a
between means of different programs, distinguish standard deviation of approximately 15). The
above-average programs and those which are distribution is shown in Figure 1.
below or at average. Above all, the results had to
be easy to interpret for the general public.
Originally studied by Laplace in 1827,
Analysis of Means has become a common
approach to identifying any group that is
performing differently from the rest.
It compares the absolute deviations of group
means from their overall mean. Halperin and
others derived a version of this method in the
form of a multiple significance test in 1955. Ott
developed a graphical representation for the test
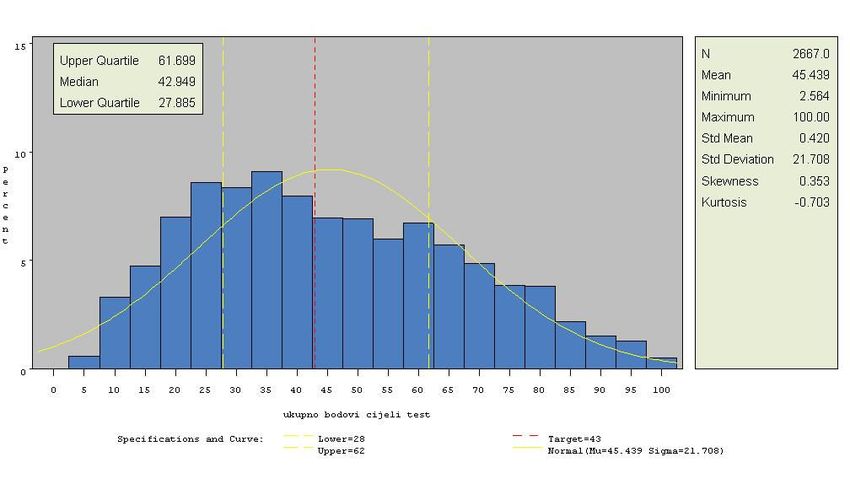
and introduced the term "analysis of means" in Figure 1. Distribution of scores (expressed as
1967. Refer to Ott (1967). percent maximum score) on the National Exam
P. R. Nelson (1982) introduced exact critical in Mathematics
values for ANOM when the groups have equal
sample sizes and also,in 1991 developed a 4.2 The Shewhart procedure
method for computing exact critical values for
ANOM when group sample sizes are not equal. Furthermore, differences in achievements
Unlike ANOVA, which tests for significant among the four gymnasium programs can be
difference among the group means, Analysis of seen on Figure 2. Each program represented by
Means identifies those means which are one of the four boxplots is positioned relative to
significantly different from the overall mean. Its the global overall mean. If the mean of the group
graphical results clearly indicate those means (represented by a cross) is above the upper
that are different from the overall mean so that control limit for the global mean, group’s
practical as well as statistical significance can be performance is considered above average. If it is
easily assessed. It is easy to understand, and below the lower control limit for the overall
sheds light on the nature of the differences mean, it is considered below average.
among the populations. The control limits are automatically adjusted
The underlying model for ANOM is the same for the varying group sizes. The legend at the
as for fixed effects ANOVA – independent bottom of Figure 2 reports the minimum and
random samples from normal populations with maximum group sizes.
homogeneous variances. From the Figure, we can see that the mean of
the program labeled 320204 (indicating
4. Data and Descriptive Statistics mathematical gymnasiums) is significantly above
the overall mean. Since the lower line on the
Prior to the analysis, each student score was boxplot represents 1st quartile, we could say that
divided by the highest possible score (maximum) about 75% of the mathematical gymnasium
to yield a percent maximum score. In other students scored above the global mean. On the
words, we used a relative scale ranging from 0 to other hand, the mean score of students attending
100. (Note: Test validity and reliability analyses the program labeled 320304 (indicating language
were performed, but are not part of this gymnasiums) is significantly below the global
presentation.) mean with about 75% of scores falling below the
lower control limit for the global mean.
4.1. Data Distribution Additionally, we can see from Figure 3 that
the results are not uniformly distributed across
The distribution (of percent maximum counties, either. It is also visible that the number
Mathematics score) is close to normal with of students varies across the counties (e.g., the
skewness of 0.35 and kurtosis of -0.7. The mean number of students in district 9 is three times
score was 45%,, median was slightly lower lower than the number of students in an average
(43%). Standard deviation was approximately sized county.
22%, which is substantially higher than standard
deviations for the other exams (Croatian and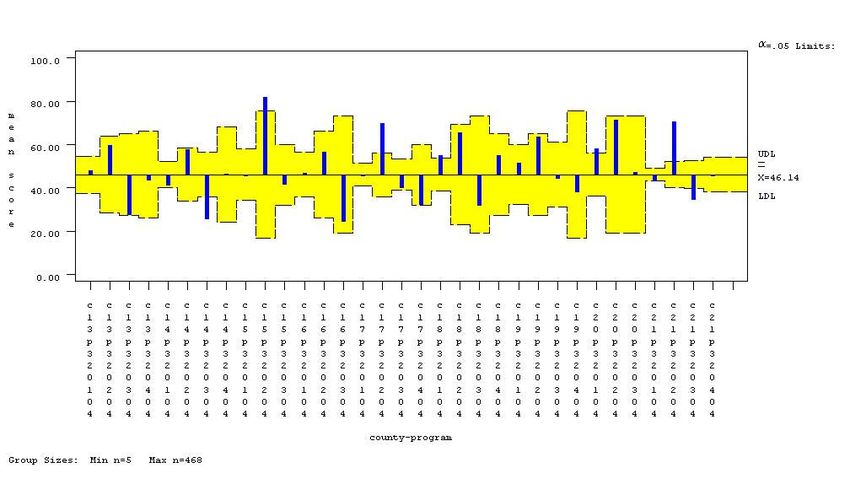
Figure 2. Differences in achievements among four gymnasium programs

   Figure 3. Differences in achievements among 21 Croatian counties

                                                     yielded all three significant main effects, which
5. Three-way Analysis of Variance                    confirmed previous results, indicating that the
                                                     Mathematics test scores differ both by the
In further analysis we used three-way analysis of    program and by region. Small and large schools
variance to test for the differences between         perform differently as well, with larger schools
counties, programs and also school size.             demonstrating significantly higher achievement.
For school size we used (for this analysis) a        Significant interactions were found between
binary variable (“small”/”large”), with “small”      county and program (F=3.45 p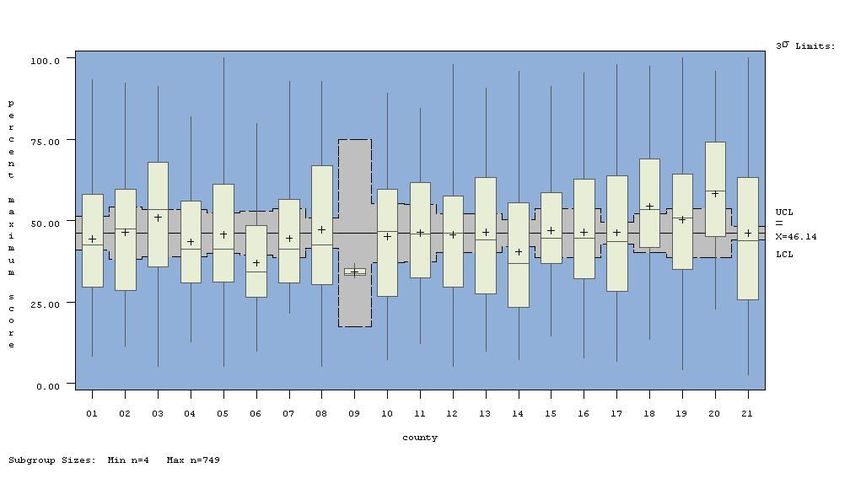
but these differences are contingent on the       which programs and counties              achieved
county and also on school size. The above model   significantly higher results.
explains 24% of variability (R2=0,24). The
interactions among county and program are         6. The ANOM Procedure
visualized in Figure 4.
                                                  For a further and more detailed graphical display
                                                  and due to the results of the previous analysis,
                                                  which indicate that programs differ but relative
                                                  to the county, we used the ANOM procedure for
                                                  significant two-way effects. The results by
                                                  county and program are shown in Figures 5a and
                                                  5b.
                                                  The yellow field shows the confidence interval
                                                  (around the global mean). The confidence
                                                  interval is different across different counties and
                                                  programs, due to different number of students
                                                  and the variability. If the group’s mean falls
                                                  above/below the confidence interval it is
Figure 4. Line plot (connecting means) showing
                                                  considered significantly better/worse than the
the interactions among programs and counties
                                                  average. We can see that even though the results
                                                  of Mathematical gymnasiums (320204) were
Blue line shows mean scores of mathematical
                                                  globaly significantly above average, this is not
gymnasiums by county; yellow and green line
                                                  the case in all counties. In counties
represent general and language mean program
                                                  1,2,3,4,5,6,7,10,11,12,13,14,16 the results are
scores, respectively. Classical gymnasium (not
                                                  average and only counties 8,15,17,18,20 and 21
available in all counties) average results are
                                                  are showing results significantly better than
shown using purple dots. This graphical display
                                                  average. Significantly better result was achieved
allows us to see the differences analyzed
                                                  by students in general gymnasium (320104) in
previously. From the line plot we cannot see
                                                  county 18.

Figure 5a. ANOM procedure chart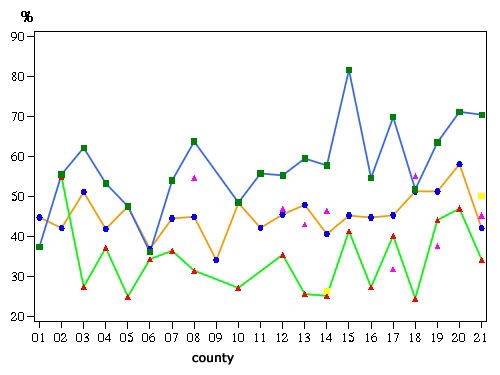
Figure 5b. ANOM procedure chart (continued)

     Table 1. County-programs scoring significantly better/worse than average
                                                              Alpha=.05 Limits for Mean (Adjusted for multiple testing)
                                                   Group
                                                  Sample      Lower     Group Average        Upper         Limit
       Significantly different county-program        Size      Limit    Mean    Mean         Limit        Exceeded
    County 08, Mathematics gymnasium                     18     30.63     72.76     46.15     61.65         Upper
    County 08, Language gymnasium                        38     35.51     31.52     46.15     56.77        Lower
    County 14, Language gymnasium                        41     35.91     25.22     46.15     56.37        Lower
    County 15, Mathematics gymnasium                      5     16.64     81.57     46.15     75.65         Upper

    County 17, Mathematics gymnasium                     42     36.04     69.78     46.15     56.25         Upper

    County 17, Classical gymnasium                       22     32.13     31.86     46.15     60.16        Lower

    County 18, General gymnasium                         71     38.42     54.94     46.15     53.87         Upper
    County 20, General gymnasium                         45     36.39     58.08     46.15     55.90         Upper
    County 21, General gymnasium                     468        43.39     42.72     46.15     48.90        Lower
    County 21, Mathematics gymnasium                 118        40.21     70.42     46.15     52.08         Upper

    County 21, Language gymnasium                        99     39.64     34.28     46.15    52.652        Lower

As part of the output of the SAS1 ANOM                        were treated as fixed effects (like in the previous
procedure, means chart summary (shown in                      analysis). School (within county) and class
Table 1), can be obtained with the results for                (within school and county) were treated as
each group that is above or below average. All                random effects. The results are shown in Tables
data preparation, analyses, graphics and                      2-4. Under the “Covariance Parameter
tabulation for the current study were performed               Estimates” in Table 2 are displayed the estimates
using SAS software (licenced to NCVVO).                       of random effects variances and the residual
                                                              variance, σ2.
7. The mixed model analysis                                       As expected, mixed model analysis yielded
   For the final analysis we applied SAS                      slightly more conservative results than the
MIXED (mixed model) procedure. Program,                       previously performed three-way ANOVA. From
county, size of the school and the interactions               the results displayed in Table 3, we see that out
                                                              of three main effects (Size, County, Program)
1
 SAS is a registered trademark of SAS Institute, Inc.,        only Program is significant (F=5,25 p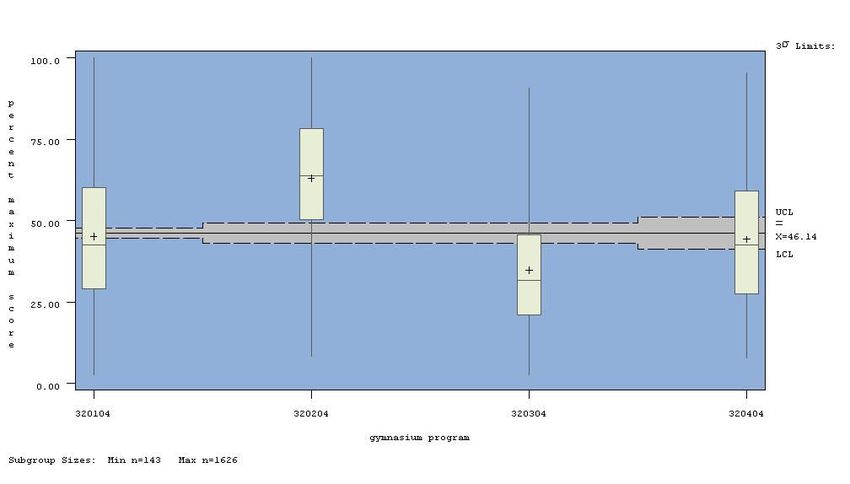
Interactions were significant between county and                  The final, mixed model analysis, in which we
program (F=1.48, p=0.02) and between program                  considered school and class as random (and
and school size (F=5.59, p=0.001).                            nested) effects, gave more conservative results.
                                                              We conclude that Mathematics scores differ
   Table 2. Covariance Parameter Estimates
                                                              among programs, with only mathematics
                   Cov Parm              Estimate
                                                              program showing significant differences across
               School(County)             100.48              counties.
             Class(County*School)        27.2344                  The main disadvantage of the analyses
                   Residual               292.50              presented in this research is the inability to
                                                              control for possible confounding variables
     Table 3. Type 3 Tests of Fixed Effects                   (student socio-economic status, data on teachers
                     Num                                      and schools, etc.), data on which are currently
   Effect             DF      Den DF F Value         Pr > F   being collected.
   Size                   1     2224         0.86    0.3551       Once this additional information becomes
   County                20         78       1.04    0.4308   available less biased estimation and comparisons
                                                              of student performance will be possible.
   Program                3     2224         4.41    0.0042
                                                              Additionally, a program of longitudinal studies
   Size*County           16     2224         1.38    0.1440
                                                              for continuous measuring and monitoring of
   Size*Program           3     2224         5.25    0.0013   student achievement in a number of subject areas
   County*Progr.         43     2224         1.48    0.0227   over a period of at least five years should be
                                                              planned and implemented.
Table 4. Simple effect tests of difference among
counties for each program separately                          9. References
                              Num    Den     F                [1] Nelson, P. R. (1982). Exact Critical Points
   Program                     DF     DF Value       Pr > F
                                                                  for the Analysis of Means. Communications
   General gymnasium           16    2224     1.20   0.2559       in Statistics -- Theory and Methods, 11(6),
   Mathematics gynasium        16    2224     1.89   0.0173       p. 699-709
   Language gynasium           14    2224     1.24   0.2363
                                                              [2] Nelson, P. R. (1983). A Comparison of
                                                                  Sample Sizes for the Analysis of Means and
   Classical gymnasium          6    2224     1.46   0.1878
                                                                  theAnalysis of Variance. Journal of Quality
                                                                  Technology, 15, p. 33-39.
    These results confirm (the outcome of the                 [3] Nelson, P. R. (1983) The Analysis of Means
other analyses described in this paper) that the                  for Balanced Experimental Designs. Journal
Mathematics scores are different across different                 of Quality Technology, 15, p. 45-54.
gymnasium programs and that the differences                   [4] Nelson, P. R. and Dudewicz, E. J. (2002).
among the counties are not the same for all                       Exact Analysis of Means with Unequal
programs. Additionally, the differences among                     Variances.Technometrics, 44, p. 152 – 160.
programs are not the same in the “small” as in                [5] Ott, E. R. (1967). Analysis of Means --- A
the “large” schools. If we examine Table 4 (for                   Graphical Procedure. Industrial Quality
the test of differences among counties for each                   Control, 24, p.101-109.
program separately) we can see that the only                  [6] Sanders, W. L., Saxton, A. M., and Horn, S.
program where significant differences were                        P. (1997). The Tennessee Value-Added
found across counties is the Mathematics                          Assessment System: A Quantitative
gymnasium program.                                                Outcomes-Based Approach to Educational
8. Conclusion                                                     Assessment. In J. Millman (Ed.), Grading
                                                                  Teachers, Grading Schools: Is Student
    Several analyses were conducted using the                     Achievement a Valid Educational Measure?
currently available data on student achievement                   Thousand Oaks, CA: Corwin Press. p. 137-
in Mathematics. Analysis of variance results                      162.
showed that Mathematics scores are on average                 [7 Wright, S. P. (2004). Advantages of a
significantly different across regions, programs                  Multivariate Longitudinal Approach to
and school size. Analysis of means was used to                    Educational Value-Added Assessment
identify those individual programs/counties in                    Without Imputation. Paper presented at the
which students achieved results that were                         National Evaluation Institute, Colorado
significantly better/worse than average.                          Springs, CO, USA.
You can also read