Investment risk evaluation of inland floating photovoltaic power plants in China using the HFLTS-TFN method
←
→
Page content transcription
If your browser does not render page correctly, please read the page content below
Clean Energy, 2021, 536–550

                                                                               https://doi.org/10.1093/ce/zkab030
                                                                               Homepage: https://academic.oup.com/ce

Research Article
Investment risk evaluation of inland floating
photovoltaic power plants in China using the

                                                                                                                                       Downloaded from https://academic.oup.com/ce/article/5/3/536/6381587 by guest on 10 December 2021
HFLTS–TFN method
Yanli Xiao1, Xin Ju1, Bo Yu1, Zheng Wang1 and Chuanbo Xu2,*
1
  Economic and Technical Research Institute, State Grid Ningxia Electric Power Co., Ltd., Yinchuan, Ningxia,
China and
2
 School of Economics and Management, North China Electric Power University, Beijing, China
*Corresponding author. E-mail: 90102479@ncepu.edu.cn

Abstract
Inland floating photovoltaic power plants (IFPPPs) are the key to making full use of water advantages to develop
solar resources in the future. Identifying the investment risk is an important prerequisite for promoting the
projects on a large scale. This paper proposes a model to assess the investment risk of IFPPPs in China. First, this
paper identifies the investment risk factors and establishes an evaluation indicator system from four aspects.
Second, the indicator data are collected and described by adopting hesitant fuzzy linguistic term sets and
triangular fuzzy numbers to ensure soundness and completeness. Third, a weighted method combining the best–
worst method and the entropy method are utilized to determine the indicator weights under the consideration of
the impact of subjective preferences and objective fairness. Fourth, the results show that the overall risk level of
China’s IFPPPs is ‘medium low’. Fifth, sensitivity analysis and comparative analysis are implemented to examine
the stability of the evaluation results. Finally, this paper also provides some risk-response strategies for the
development of China’s IFPPPs from economy, society, technology and environment.

Received: 16 May 2021; Accepted: 3 August 2021
© The Author(s) 2021. Published by Oxford University Press on behalf of National Institute of Clean-and-Low-Carbon Energy
This is an Open Access article distributed under the terms of the Creative Commons Attribution-NonCommercial License (https://
creativecommons.org/licenses/by-nc/4.0/), which permits non-commercial re-use, distribution, and reproduction in any medium,     536
provided the original work is properly cited. For commercial re-use, please contact journals.permissions@oup.com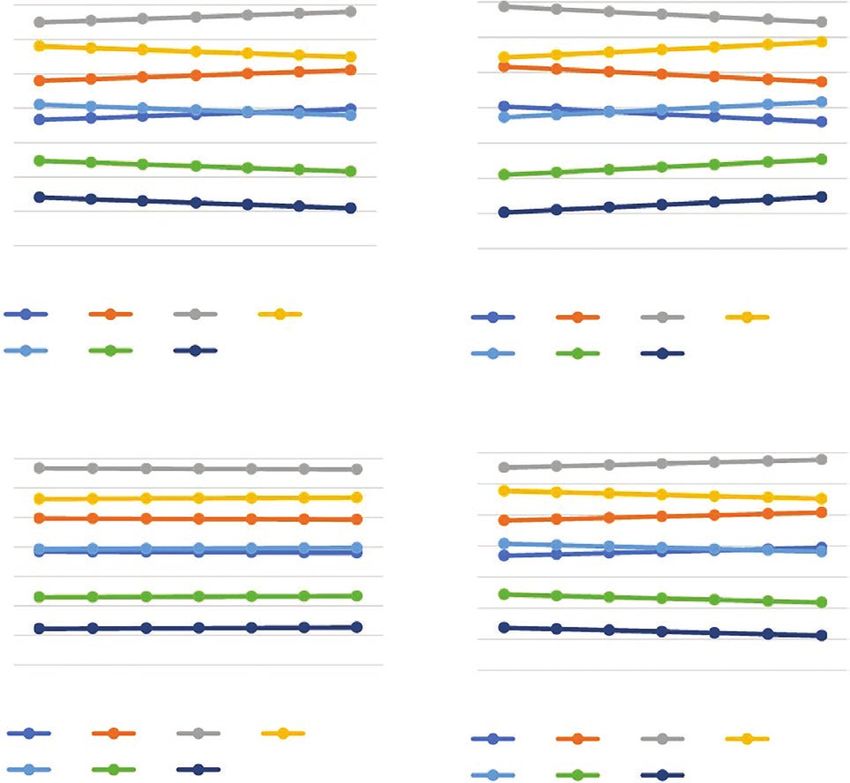
Xiao et al. |   537

Graphical Abstract

                                       Identify the                                     Expert        Committee
              Stage I                   committee
            Preliminary
            preparation
                                      Determine the                         C1                C2             C3             C4
                                   evaluation indicators                 Technical      Economic            Social     Environmental
                                                                           risk           risk               risk            risk

                                     HFLTSs                                 Data collection
             Stage II
       Calculate the weight
           of indicators                                                  Convert into TFNs                              TFNs

                                                                                                                                             Downloaded from https://academic.oup.com/ce/article/5/3/536/6381587 by guest on 10 December 2021
                                                              Calculate the                 Calculate the             The entropy
                                       BWM
                                                            subjective weights             objective weights            method

                                                                Calculate the comprehensive weights

             Stage III                                     Establish a first-level indicator evaluation vector
            Assess the
         investment risk of
              IFPPPs                              Calculate the investment risk level of each first-level indicator         Fuzzy
                                                                                                                        comprehensive
                                                                                                                          evaluation
                                                              Calculate the overall investment risk level

                                                                          Sensitivity analysis

            Stage IV
         Suggestions and                                   Suggestions                             Conclusions
           conclusions

Keywords: inland floating photovoltaic power plants; risk assessment; HFLTS–TFN; BWM

Introduction                                                           and demand are not balanced in these areas, so the phe-
                                                                       nomena of curtailing solar power and limiting electricity
With the rapid economic development, traditional energy
                                                                       occur frequently. However, in southern China, due to the
consumption and CO2 emissions continue to increase [1],
                                                                       developed economic industry and variable climate change,
so China is in a critical period of energy-structure trans-
                                                                       the installed capacity of the power system has difficulty
formation. The sustainable development strategy of ‘Reach
                                                                       to fully meet the demand of people’s daily lives [2]. The
the peak of carbon dioxide emissions before 2030 and
                                                                       dense population in these regions leads to a shortage
achieve the carbon neutrality before 2060’ has been pro-
                                                                       of land resources for ground-based photovoltaic power
posed. Photovoltaic generation is one of the main types of
                                                                       plants. Fortunately, there are abundant water areas that
pollution-free energy with abundant reserves. Moreover,
                                                                       can settle the conflict between the development of solar
the 14th Five-Year Plan of China proposed to vigorously
                                                                       power projects and strains on land resources so that more
enhance the scale of photovoltaic generation and it is esti-
                                                                       and more investors are focusing on the development of in-
mated that the total installed capacity of photovoltaic gen-
                                                                       land floating photovoltaic power plants (IFPPPs). However,
eration in China will exceed 1.2 billion kilowatts by 2030.
                                                                       most of the IFPPP research is mainly from the perspectives
Therefore, the development of photovoltaic power plants
                                                                       of technology and the economy, and research on project-
will usher in new opportunities.
                                                                       investment risks is still lacking. Therefore, in the context of
   At present, existing photovoltaic power plants are
                                                                       low-carbon green development, exploring and identifying
mainly ground-based photovoltaic power plants whose in-
                                                                       the investment risks of IFPPPs is conducive to improving
stallation requires more land resources, so these projects
                                                                       the research system of floating photovoltaic power plants
are concentrated in the north-western provinces of China,
                                                                       and promoting the development of IFPPPs.
such as Xinjiang and Gansu provinces. The power supply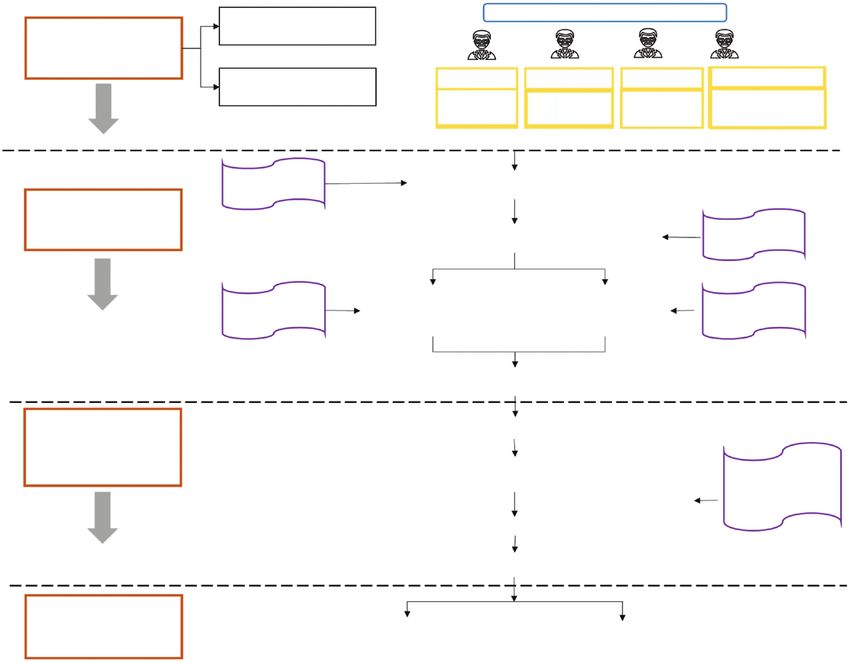
538 | Clean Energy, 2021, Vol. 5, No. 3
Downloaded from https://academic.oup.com/ce/article/5/3/536/6381587 by guest on 10 December 2021
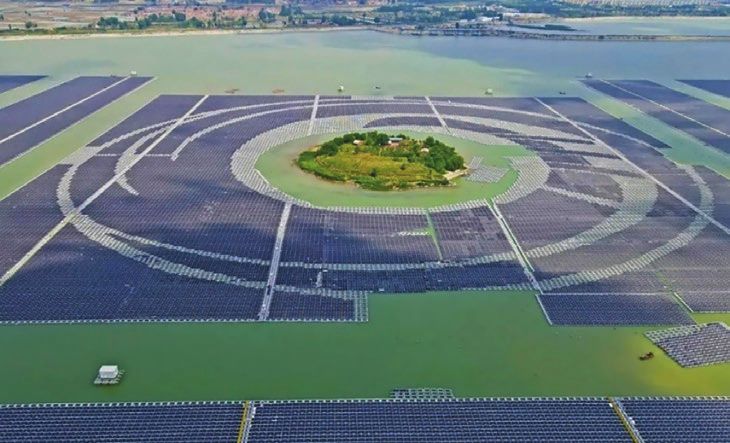
Fig. 1: An example of a floating photovoltaic power plant. Source: State-owned Assets Supervision and Administration Commission of State Council:
http://www.sasac.gov.cn/n2588025/n13790238/n16406218/c18732065/content.html).
As shown in Fig. 1, IFPPPs are usually constructed in res- investment risk model constructed in this article can pro-
ervoirs, ponds or lakes, and they are also new solar power vide decision support for governments and enterprises
projects with several significant advantages, including to build inland floating photovoltaic power plants and
high power-generation efficiency, saving land resources achieve green and low-carbon development.
and making full use of water resources. Currently, there
are ~98 000 reservoirs and 20 000 lakes in China, most
of which are located in the southern region, providing 1 Literature reviews
bright opportunities for the development of IFPPPs. The
In order to better analyse the investment risks of floating
Chinese government has promulgated relevant policies,
photovoltaic power plants in inland China, the literature
such as the ‘Notice of National Development and Reform
review of this paper starts with the following two aspects:
Commission on Matters Concerning the Policies on the
research on floating photovoltaic power plants and re-
On-grid Tariff for Solar Power Generation in 2020’ and the
search on risk-assessment methods.
‘Notice on Further Promoting the Solar Power Generation
Systems’, which effectively promote the orderly develop-
ment of the floating solar power-generation industry and
reduce the financial burden for investors. Although the 1.1 Research on floating photovoltaic
natural environment and policy conditions are condu- power plants
cive to developing the IFPPPs, investors face many uncer- The advantages of floating photovoltaic power plants
tainties due to the higher investment costs and longer have been affirmed by many scholars. For example, Zhou
operating period of IFPPPs. Therefore, it is of great prac- et al. [2] pointed out that floating photovoltaic power
tical significance to analyse the investment risk of IFPPPs plants could be integrated with the aquaculture industry
against this background. and tourism development to improve space utilization.
According to the existing research, this paper iden- Cromratie et al. [3] put forward that water has a cooling
tifies the key factors that affect the benefits of IFPPPs by effect on photovoltaic panels and cables, therefore
referring to relevant research and consulting experienced increasing the power-generation efficiency of floating
scholars, and then establishes the investment risk indi- photovoltaic power plants. Besides, some scholars com-
cator system. On the basis of the hesitant fuzzy linguistic pared them with terrestrial photovoltaic panels and
term set (HFLTS)–triangular fuzzy numbers (TFN) method, found that floating photovoltaic power plants have less
the best–worst method (BWM), the entropy method and shielding so there is higher light utilization [4]. For the
fuzzy comprehensive evaluation, the model is constructed above reasons, floating photovoltaic power plants have
to comprehensively analyse the investment risk of IFPPPs been applied earlier in foreign countries. Phoenix Solar
in China, which provides related investors with theoretical built a 5-kW floating photovoltaic power plant in the
support for the development and planning of IFPPPs to a Bishan Park, Singapore, in 2013. Kyocera TCL solar in-
certain extent. By combining the methods above, it is pos- vested in a 1.7-MW floating photovoltaic power plant in
sible to determine the importance of indicators, screen out Hyogo prefecture, western Japan, in 2015. The NHPC Ltd
the key risk indicators, overcome the shortcomings of the completed a 50-MW floating photovoltaic power plant in
traditional subjective weighting method and improve the southern Kerala, India, in 2015. Although China’s floating
accuracy of the importance of risk indicators. The IFPPPs photovoltaic power plants started late, they achieved
Xiao et al. |   539

remarkable achievements. For example, China’s first            Fuzzy comprehensive evaluation has great superiority in
floating photovoltaic power plant was built in Zaoyang         solving multi-criteria decision-making (MCDM) problems,
City, Hubei Province, in 2015. China’s Three Gorges New        so it has been widely used in risk assessment with mul-
Energy Company used the idle water of the mining sub-          tiple evaluation criteria, such as the risk assessment of
sidence area to build a 150-MW floating photovoltaic           renewable-energy island microgrids [14], the development
power plant in Huainan, Anhui Province, in 2017 [5].           trend of water-resources analysis [15] and customer satis-
   In order to promote the healthy development of              faction with online to offline food delivery [16].
floating photovoltaic power plants, various scholars               MCDM methods can effectively measure the influence
have actively contributed their efforts. Miguel et al. [6]     degree of different factors on project risk. Comparing the
presented the main design features of a floating photo-        analytic hierarchy process (AHP) method and the BWM,
voltaic cover system for water-irrigation reservoirs. Liu      which both determine the subjective weights, it can be
et al. [7] proposed and assessed an integrated floating        found that the BWM has more obvious advantages. First,
photovoltaic-pumped storage power system in electri-           the BWM can greatly reduce the amount of calculation
city generation and the conservation of water and land         in solving practical problems [17]; for the MCDM problem

                                                                                                                                Downloaded from https://academic.oup.com/ce/article/5/3/536/6381587 by guest on 10 December 2021
resources. Goswami and Sadhu [8] conducted an experi-          with n indicators, the AHP method requires n2–n com-
ment for 17 months to determine the performance of             parison data to obtain the indicator weights, while there
floating photovoltaic modules and their study showed           are 2n–3 comparison data in the calculation of the BWM.
that the average performance ratio and the degradation         Second, the vector-based calculation of the BWM is signifi-
rate was 71.58% and 1.18%, respectively, for the floating      cantly better than the matrix-based calculation of the AHP.
photovoltaic modules. Cazzaniga et al. [9] thought that        Third, as the BWM only needs to compare the optimal or
floating photovoltaic power plants represented an in-          worst indicator with the other indicators [18], it can reduce
dustry with great potential and introduced a meth-             the probability of judgement errors caused by the experts’
odology currently used in this industry to perform a           confusion and avoid the data inconsistency resulting from
mooring design. It can be seen from the above that more        a large number of comparisons in order to get more re-
and more scholars have paid attention to IFFFPs, but few       liable calculation results. Currently, the BWM has been
studies have conducted research on the investment risks        used in various research on the selection of sustainable
of IFFFPs in a certain region.                                 hydrogen-production technology [19], the corn-cultivation
                                                               location selection of bioethanol production [20], decision
                                                               analysis of China’s energy security [21], etc.
1.2 Research on risk-assessment methods                            However, experts’ evaluation is the core of the subjective
In the risk assessment of IFPPPs, the experts’ linguistic      weighted methods to determine the indictor weights, so
description of indicators is mostly uncertain and fuzzy.       the accuracy of the process is easily affected by experts’
Thus, it is extremely crucial to choose an appropriate         subjectivity. The emergence of the entropy method can
method to collect indicator information. Although Zadeh        solve this problem well. The entropy method is a common
[10] proposed the fuzzy set theory to solve this problem,      objective-weighted method, which determines the indi-
it has the disadvantage that a single linguistic value         cator weights by the indicators’ own information [22]. Many
cannot fully describe the ambiguity of information.            scholars have carried out related research work based on
Fortunately, this problem can be solved using the HFLTS        this method. For example, Wang et al. [23] used the entropy
method, which describes multiple variables at the same         method to evaluate the reliability of high-voltage direct-
time and obtains more realistic results. In view of its        current transmission protection systems; Yuan et al. [24]
good data-collection characteristics, the HFLTS has been       assessed the investment risk of coal-fired power plants
widely used in many fields. For example, Wu et al. [11]        in countries along the Belt and Road initiative based on
used the HFLTS to collect the indicator information of         the entropy method. Zhao et al. [25] evaluated the envir-
low-speed wind-farm projects in hilly areas. Chen et al.       onmental vulnerability of mainland China based on the
[12] calculated the possibility distributions of the HFLTS     entropy method.
to collect experts’ assessments and attribute levels to            Obviously, the following conclusions can be drawn: (i)
conduct the overall assessments.                               analysing the investment risk of China’s IFPPPs is needed
   As the evaluation environment is relatively compli-         and urgent; (ii) the HFLTS method is currently relatively
cated, it is difficult to describe information with precise    mature to improve the scientific soundness of indicator se-
real values. Therefore, TFN, which include the upper limit,    lection; TFN are widely used in risk assessment with mul-
the lower limit and the most probable value [13], are intro-   tiple evaluation criteria; (iii) determining indicator weights
duced into the investment risk of IFPPPs to describe the       by combining the BWM and the entropy method further
indicator information more comprehensively. Besides,           enhances the comprehensiveness of the investment risk
this paper also performs fuzzy comprehensive evaluation        of IFFFPs. There is currently a lack of relevant research that
based on TFN and uses mathematical logic for operations        combines the HFLTS and TFN methods to assess the risks
and related definitions for linguistic value conversion, and   of floating photovoltaic power station projects and this
then obtains the corresponding risk-assessment level.          paper fills the gap.
540 | Clean Energy, 2021, Vol. 5, No. 3
2 Investment risk-evaluation system facilities are relatively lagging, such as suburban waters.
of IFPPPs In addition, photovoltaic power generation also has
the characteristics of instability, intermittentness and
Identifying risk factors is a prerequisite for implementing
uncontrollability. All of the above have brought certain dif-
scientific risk management. And establishing a scientific
ficulties and risks to the grid connection of IFPPPs.
investment risk-evaluation indicator system is necessary
to obtain objective and effective risk-evaluation results.
Through combing the literature and analysing the char-
acteristics of photovoltaic power plants, this paper estab-
2.2 Economic risk (C2)
lishes an investment risk-evaluation indicator system for 2.2.1 High initial investment cost (C21)
IFPPPs and divides them into four categories, including The initial investment cost of IFPPPs is relatively high
technical risk, economic risk, social risk and environ- [5]. Compared with ground-based photovoltaic power
mental risk, as shown in Table 1. stations, the investment cost of IFPPPs is about 12%
higher [29].
Downloaded from https://academic.oup.com/ce/article/5/3/536/6381587 by guest on 10 December 2021
2.1 Technical risk (C1)
2.2.2 High operation and maintenance cost (C22)
2.1.1 Unreasonable location (C11) IFPPPs need to face more risks in the operation and main-
Site selection is a key part of the development of IFPPPs. tenance phases. This risk includes battery-replacement
Many aspects are involved in the site-selection process costs [26], external power-supply costs, dust-removal
of IFPPPs, such as light intensity, effective light duration, costs, as well as high maintenance costs due to the impact
hydrological environment, etc. The unreasonable siting of of the pond environment on the floating frame [30].
the IFPPPs will not only have a negative impact on the eco-
nomic benefits of the projects, but may also cause the pro-
jects to fail to meet the requirements [26]. 2.2.3 Financing risk (C23)
The technology of China’s IFPPPs is in its infancy and the
consumer market for water-based photovoltaic power is
2.1.2 Improper structural design (C12)
not mature. There is great uncertainty in the future in-
The content of the structural design includes the size of
come of IFPPPs. Therefore, banks and other financial insti-
the photovoltaic panels, the distance between the photo-
tutions are unwilling to take high risks to provide funds
voltaic panels, the installation inclination angle [27], etc.
for their project construction, meaning that investors face
Design flaws or unreasonable designs often lead to eco-
difficulties in finances [31].
nomic losses for project investors. For example, improper
photovoltaic panel structural design will lead to insuffi-
cient utilization of solar radiation and available light, and 2.2.4 Imperfect subsidy mechanism (C24)
therefore the design cannot achieve maximum production The integrated industry that combines inland floating
efficiency. photovoltaic generation and agriculture has photovoltaic
power-generation subsidy standards, but it lacks incentive
2.1.3 Difficulty of integrating into the grid (C13) measures that comprehensively consider farming sub-
Most investors obtain investment income through grid- sidies. Moreover, there are regional differences and dif-
connected power transmission of the IFPPPs [28]. IFPPPs ferences in understanding, which invisibly increase the
are built in areas where the power-distribution network business risk of investors.
Table 1: The investment risk-evaluation indicator system of IFPPPs
Target layer First-level indicators Second-level indicators
Investment risk of IFPPPs Technical risk (C1) Unreasonable location (C11)
Improper structural design (C12)
Difficulty of integrating into the grid (C13)
Economic risk (C2) High initial investment cost (C21)
High operation and maintenance cost (C22)
Financing risk (C23)
Imperfect subsidy mechanism (C24)
Social risk (C3) Complicated approval procedures (C31)
Insufficient electricity demand (C32)
Public opposition (C33)
Environmental risk (C4) Severe weather conditions (C41)
Risk of water corrosion to equipment (C42)
Water ecological environment destruction (C43)Xiao et al. | 541
2.3 Social risk (C3) establish the investment risk-evaluation model of IFPPPs,
as shown in Fig. 2.
2.3.1 Complicated approval procedures (C31)
Compared with ordinary photovoltaic projects, the adminis-
trative approval of IFPPPs also includes procedures for com-
3.1 Data collection based on HFLTSs
prehensive land utilization and breeding. Thus, the approval
process is complicated. In addition, some power-supply com- The problem of investment risk evaluation is complicated
panies do not standardize the grid-connected service pro- and vague. In the process of analysing indicators, ex-
cess of distributed photovoltaic power plants, which leads to perts may hesitate between multiple evaluation terms in
the time-consuming process of grid-connected projects. the evaluation of a certain indicator. At this time, a single
evaluation term is difficult to accurately reflect the judge-
2.3.2 Insufficient electricity demand (C32) ment of experts. Therefore, it is necessary to introduce
IFPPPs are usually connected to the distribution network HFLTSs to improve the reliability of decision-making [36].
below 35 kV for nearby utilization. When the power- The evaluation data-collection process based on the HFLTS
Downloaded from https://academic.oup.com/ce/article/5/3/536/6381587 by guest on 10 December 2021
consumption capacity of the construction area of the pro- method is as follows:
ject is low, the photovoltaic power station may run under Step 1: Set the meaning of the evaluation linguistic
low load for a long time or be idle, causing economic loss sets. Suppose S = {s0 , s1 , s2 , . . . , sn } is a linguistic term set.
and a waste of resources. According to the investment risk rating, the correspond-
ence between linguistic variables and linguistic term sets
2.3.3 Public opposition (C33) classified in this paper is shown in Table 2.
The public’s acceptance of the new technology is critical to Step 2: Based on the relevant data information and
its smooth implementation. If the public opposes the de- evaluation indicator system, relevant experts are invited
ployment of IFPPPs, it will cause the project to be delayed to analyse and evaluate the investment risks of IFPPPs.
or cancelled [32]. Step 3: Use the function EGH to express the evaluation re-
sults of the HFLTS method. The result of an expert’s evalu-
ation of a certain indicator may be between two linguistic
2.4 Environmental risk (C4) sets, or even between multiple linguistic sets. In view of
this situation, the operation of HFLTSs can be expressed by
2.4.1 Severe weather conditions (C41)
the function EGH:
IFPPPs need to face severe weather, which includes strong
winds, continuous rain, little light duration, etc. These EGH (si ) = {si /si ∈ S } = {si }
(1)
harsh climatic conditions may cause photovoltaic mod-
ules to malfunction. For example, the battery needs to run EGH (between si and sj ) = sk /sk ∈ S and si ≤ sk ≤ sj
(2)
at low power during the rainy season, which will cause the EGH (less than si ) = {sk /sk ∈ S and sk ≤ si }
(3)
battery to wear out easily [33].
EGH (more than si ) = {sk /sk ∈ S and si ≤ sk }
(4)
2.4.2 Risk of water corrosion to equipment (C42)
The current life cycle of photovoltaic power stations is
25 years. Because the floating body frame or pile founda- 3.2 Evaluation data processing based on TFN
tion can be corroded by various microorganisms, harmful
The TFN method can quantitatively analyse the qualitative
chemicals, acid and alkaline water quality in the water for
evaluation problem that it is difficult to describe the re-
a long time, it leads to the risk of early scrapping [34].
search object through accurate numerical values in fuzzy
environmental decision-making by setting the upper and
2.4.3 Water ecological environment destruction (C43) lower limits of the evaluation threshold function [31]. Since
In the development process of IFPPPs, it will inevitably the qualitative linguistic terms based on HFLTSs cannot
have a certain impact on the surrounding ecological en- intuitively reflect the evaluation values and perform
vironment [35]. For example, in the fishing and light com- mathematical operations, this paper uses the method of
plementary project, it will cause problems such as the combining HFLTSs and TFN to process evaluation data and
inconvenience of fishing, cumbersome feed management quantitatively express them. The process is as follows:
and difficulty in dredging and disinfection, which will af- Step 1: Set the correspondence between HFLTSs and
fect the development of the fishery. TFN. According to the meaning represented by the lin-
guistic sets and the actual type of investment risk, the
linguistic information is converted into TFN, as shown in
3 Investment risk-evaluation model Table 3.
of IFPPPs Step 2: Set the membership function. Suppose a map-
On the basis of combining domestic and foreign research ping µÃ from U to [0,1] is defined on the universe U, and
on risk-evaluation methods, the data-analysis method of µÃ : U → {0, 1}, u → Ã(u) ∈ [0, 1] is called a fuzzy set on U.
HFLTS–TFN and the BWM–entropy method are used to And Ã(u) is called the membership function. The TFN can542 | Clean Energy, 2021, Vol. 5, No. 3
Identify the Expert Committee
Stage I committee
Preliminary
preparation
Determine the C1 C2 C3 C4
evaluation indicators Technical Economic Social Environmental
risk risk risk risk
HFLTSs Data collection
Stage II
Calculate the weight
of indicators Convert into TFNs TFNs
Downloaded from https://academic.oup.com/ce/article/5/3/536/6381587 by guest on 10 December 2021
Calculate the Calculate the The entropy
BWM
subjective weights objective weights method
Calculate the comprehensive weights
Stage III Establish a first-level indicator evaluation vector
Assess the
investment risk of
IFPPPs Calculate the investment risk level of each first-level indicator Fuzzy
comprehensive
evaluation
Calculate the overall investment risk level
Sensitivity analysis
Stage IV
Suggestions and Suggestions Conclusions
conclusions
Fig. 2: Evaluation of investment risk based on the HFLTS–TFN method
Table 2: The meaning of evaluation terms
Linguistic sets s0 s1 s2 s3 s4 s5 s6
Variable meaning Very low (VL) Low (L) Medium low (ML) Medium (M) Medium high (MH) High (H) Very high (VH)
Table 3: Correspondence between linguistic sets and TFN Besides, the related operation rules of TFN are as follows,
where Ã1 = (a1 ,b1 ,c1 )and Ã2 = (a2 ,b2 ,c2 ) represent TFN:
Linguistic sets TFN
(6)
Ã1 + Ã2 = (a1 + a2 , b1 + b2 , c1 + c2 )
s0 (0.00,0.00,0.17)
s1 (0.00,0.17,0.34) (7)
Ã1 × Ã2 = (a1 a2 , b1 b2 , c1 c2 )
s2 (0.17,0.34,0.51)
s3 (0.34,0.51,0.68) (8)
λÃ1 = (λa1 , λb1 , λc1 )
s4 (0.51,0.68,0.85)
Ä ä−1 Å 1 1 1 ã
s5 (0.68,0.85,1.00) (9)
Ã1 = , ,
s6 (0.85,1.00,1.00) a1 b1 c1
Step 3: Calculate the TFN value evaluated by experts.
Quantitative analysis of expert evaluation results is based
be expressed as à = (a, b, c) and the membership function on membership functions. For example, some experts’ as-
is shown in Equation (5): sessment of ‘unreasonable location’ is between ‘very low’
u−a (VL) and ‘low’ (L). Among them, the probabilities of VL, L
b−a , a ≤ u ≤ b
and ‘medium low’ (ML) are 40%, 50% and 10% respectively.
(5) µÃ (u) = c−uc−b , b≤u≤c
0, Then the HFLTS can be expressed as HS (C11 ) = 0.4 0.5 0.1
VL , L , ML
others
and the calculation steps are as follows:Xiao et al. | 543
ß ™
HS (C11 ) =
0.4 0.5 0.1
, ,
min ξ
VL L ML
= 0.4S0 + 0.5S1 + 0.1S2
s.t.
= (0.4(0.00, 0.00, 0.17), 0.5 (0.00, 0.17, 0.34) , 0.1(0.17, 0.34, 0.51)) wB − aBj wsj ≤ ξ, for all j
= (0.02, 0.12, 0.29) (11)
wsj − ajW ww ≤ ξfor all j
wsj = 1
j
wsj ≥ 0 for all j
3.3 Determination of evaluation
indicator weights
Determining weights of the evaluation indicators is a key 3.3.2 Determining the objective weights through the
segment of risk analysis, so this paper starts scientifically in entropy method
sequence from the three stages for determining subjective The entropy method determines the indicator weights by
weights, objective weights and comprehensive weights. the data themselves, so it can avoid the influence of sub-
jective factors. The relevant steps are shown below:
3.3.1 Subjective weight determination based on the BWM Step 1: Set the quantification standard for HFLTS evalu-
Downloaded from https://academic.oup.com/ce/article/5/3/536/6381587 by guest on 10 December 2021
The BWM is used to calculate the weights of investment ation results. According to the corresponding relationship
risk-assessment indicators for IFPPPs. The BWM was pro- between the risk size and the linguistic set, set Si equal
posed by Rezaei in 2015 [37]. Experts first identify the best to i. And the quantitative value of the evaluation standard
(most important) and worst (least important) indicators of the calculation experts on the indicator is shown in
from the n indicators. They then use the two indicators as Equation (12). Among them, xij represents the evaluation
the reference standard and compare them with other in- value of each expert indicator:
dicators. The comparison results need to be expressed in Ü Ü êê
m
integers from 1 to 9 [38]. The specific steps of the BWM are 1 xij xij
(12)
ej = − ln pij ej ∈ [0, 1]
as follows: ln m m
m
i=1 xij xij
Step 1: There are m experts to select n indicators and i=1 i=1
uniformly determine the best indicators and the worst in- Step 2: Calculate the entropy weight woj:
dicators. The best indicator is represented by CB and the
gj = 1 − ej
(13)
worst indicator is represented by CW.
Step 2: Determine the priority of the optimal indicator gj
woj = n
over other indicators. Each expert evaluates and scores (14)
gj
with an integer ranging from 1 to 9, where 1 means ‘equally j=1
important’ and 9 means ‘extremely important’, thus con-
structing a comparison vector as AB = (aB1 , aB2 , · · · , aBn ),
3.3.3 Determining the comprehensive weights
and the aBj(aBB = 1) is the degree to which the ith expert
According to the subjective and objective indicator weights,
thinks the optimal indicator CB is better than the indi-
the comprehensive indicator weights are obtained based
cator Cj.
on the multiplication normalization method as follows:
Step 3: Determine the priority of other indicators over
the worst indicators. Similarly, each expert evaluates woj × wsj
w= n
and scores with an integer from 1 to 9, and thus con- (15)
woj × wsj
T
structs a comparison vector as AW = (a1W , a2W , · · · , anW ) , j=1
and the ajW(aww = 1) is the degree to which expert i be-
lieves that other indicators Cj are better than the worst
indicator CW. 3.4 Investment risk assessment
Step 4: According to the solution idea obtained by min-
The influence degree of different risk factors is usu-
imizing the maximum deviation, the following mathemat-
ally relative and uncertain, and it cannot be quantified.
ical programming model can be constructed to solve the
Fuzzy comprehensive evaluation provides a method for
subjective indicator weights using Equation (10):
evaluating fuzzy variables. In this paper, the fuzzy compre-
min maxj
wB − aBj wsj
,
wsj − ajw ww
hensive evaluation based on HFLTS–TFN is used to aggre-
s.t. gate the uncertain fuzzy numbers of experts’ judgements
(10) wsj = 1 to realize the overall evaluation of the investment risk of
j IFPPPs. The investment risk assessment is divided into the
wsj ≥ 0, for all j following three steps:
Calculate the optimal weights of all indicators determined Step 1: Establish a first-level indicator evaluation vector.
by experts according to Equation (11), where ξ is the con- The TFN of all the second-level indicators under each first-
sistency index. And the closer its value is to 0, the higher level indicator constitute the first-level indicator evalu-
Ä äT
the consistency [14]: ation vector, which is expressed as VCi = Hci1 , Hci2 , . . . , Hcij544 | Clean Energy, 2021, Vol. 5, No. 3
. The HFLTS Hc is an ordered finite subset of the continuous complementarity with agriculture and fisheries, and
linguistic set, expressed as HC = {< si , h(si ) > |si ∈ S}.The higher power-generation efficiency. China is also actively
variable h(si) represents the possible membership degrees promoting the development of IFPPPs. In order to better
of si belonging to the set Hc. promote the development of IFPPPs in China, the key risk
Step 2: Calculate the investment risk level of each first- factors and overall risk levels of IFPPPs are analysed by the
level indicator. The expression WCi is the total weight of above investment risk-evaluation model.
the second-level indicator under the first-level indicator,
and the expression wcij is the weight of the jth second-level
indicator under the ith first-level indicator. The calculation 4.1 Collection of investment risk data
steps are shown in Equations (16) and (17); then sort out To ensure the accuracy of data acquisition, this article re-
the investment evaluation risk value RC of each first-level fers to the data-acquisition methods of existing research
indicator: literature [39]. Four experts in related fields are invited to
Ä äT form an expert committee. These experts have the fol-
RCi = WCi ◦ VCi = (wci1 , wci2 , . . . , wcij ) × Hci1 , Hci2 , . . . , Hcij
Downloaded from https://academic.oup.com/ce/article/5/3/536/6381587 by guest on 10 December 2021
(16) lowing characteristics: (i) they have engaged in or studied
the management of photovoltaic power plants and (ii) they
T
(17)
RC = (RC1 , RC2 , . . . , RCi ) have a certain understanding of the field of risk assess-
Step 3: Calculate the overall investment risk level, where ment. According to the knowledge level and work experi-
the expression Wi is the weight of the first-level indicator ence, the evaluation weights of the four experts accounted
and the expression wci is the weight of the ith first-level in- for 0.3, 0.3, 0.2 and 0.2, respectively. Each expert uses the
dicator. The calculation is as follows: linguistic sets in the HFLTS to evaluate the 13 second-level
indicators in Section 2. The investment risk-assessment
T
(18)
R = Wi ◦ RC = (wc1 , wc2 , . . . , wci ) × (RC1 , RC2 , . . . , RCi ) results of IFPPPs are shown in Table 4.
Step 4: Calculate the TFN result of the investment risk According to the language sets in Table 1 and the TFN
level of IFPPPs according to Equation (19), and judge the algorithm in Section 3.2, the evaluation results of each ex-
closest level of investment risk of IFPPPs. The higher the pert for each secondary indicator and each mean value of
similarity between the judgement result and a certain the expert committee are calculated, as shown in Table 5.
risk level, the closer the project is to that level. Among
them, the variables Ã1 = (a1 ,b1 ,c1 ) and Ã2 = (a2 ,b2 ,c2 ) are
any two TFN: 4.2 Determination of indicator weights
|a1 -a2 | + |b1 -b2 | + |c1 -c2 | According to repeated discussions of the expert com-
(19)
Sd (Ã1 , Ã2 ) = 1 −
3 mittee, the high initial investment cost is determined as
the best (most important) indicator and insufficient elec-
tricity demand is the worst (least important) indicator.
4 A case study Each expert scores the remaining indicators according to
In the international context of low-carbon development, the relevant steps of Section 3.3. The subjective indicator
it has become a worldwide consensus to actively develop weights are shown in Table 6 and the consistency index
renewable energy to promote the sustainable develop- values of the experts are allXiao et al. | 545
Table 5: Statistical table of the evaluation data
Indicators Expert 1 Expert 2 Expert 3 Expert 4 Mean
C11 (0.10,0.27,0.44) (0.02,0.12,0.29) (0.02,0.12,0.29) (0.12,0.29,0.46) (0.06,0.20,0.37)
C12 (0.12,0.29,0.46) (0.27,0.44,0.61) (0.26,0.43,0.60) (0.12,0.29,0.46) (0.19,0.36,0.53)
C13 (0.32,0.49,0.66) (0.36,0.53,0.70) (0.36,0.53,0.70) (0.15,0.32,0.49) (0.31,0.48,0.65)
C21 (0.60,0.77,0.93) (0.58,0.75,0.91) (0.61,0.78,0.94) (0.61,0.78,0.94) (0.60,0.77,0.93)
C22 (0.51,0.68,0.85) (0.56,0.73,0.90) (0.58,0.75,0.91) (0.60,0.77,0.93) (0.56,0.73,0.89)
C23 (0.60,0.77,0.93) (0.48,0.65,0.81) (0.31,0.48,0.65) (0.39,0.56,0.73) (0.46,0.63,0.80)
C24 (0.39,0.56,0.73) (0.27,0.44,0.61) (0.32,0.49,0.66) (0.24,0.41,0.58) (0.31,0.48,0.65)
C31 (0.22,0.39,0.56) (0.43,0.60,0.77) (0.31,0.48,0.65) (0.27,0.44,0.61) (0.31,0.48,0.65)
C32 (0.26,0.43,0.60) (0.27,0.44,0.61) (0.32,0.49,0.66) (0.14,0.31,0.48) (0.25,0.42,0.59)
C33 (0.14,0.31,0.48) (0.26,0.43,0.60) (0.22,0.39,0.56) (0.15,0.32,0.49) (0.19,0.36,0.53)
C41 (0.34,0.51,0.68) (0.27,0.44,0.61) (0.27,0.44,0.61) (0.12,0.29,0.46) (0.26,0.43,0.60)
C42 (0.14,0.31,0.48) (0.05,0.22,0.39) (0.09,0.26,0.43) (0.10,0.27,0.44) (0.09,0.26,0.43)
Downloaded from https://academic.oup.com/ce/article/5/3/536/6381587 by guest on 10 December 2021
C43 (0.02,0.14,0.31) (0.03,0.19,0.36) (0.00,0.10,0.27) (0.03,0.20,0.37) (0.02,0.16,0.33)
Table 6: Result of indicator weight calculation
First-level Second-level Subjective Objective Second-level in- Comprehensive
indicators Weights indicators weights weights dicator weights weights
C1 0.30 C11 0.52 0.71 0.62 0.19
C12 0.15 0.14 0.15 0.04
C13 0.33 0.15 0.23 0.07
C2 0.25 C21 0.13 0.01 0.04 0.02
C22 0.33 0.04 0.14 0.04
C23 0.27 0.67 0.50 0.12
C24 0.27 0.28 0.32 0.08
C3 0.18 C31 0.42 0.34 0.39 0.07
C32 0.17 0.40 0.27 0.05
C33 0.42 0.26 0.34 0.06
C4 0.27 C41 0.24 0.23 0.24 0.06
C42 0.32 0.36 0.34 0.09
C43 0.44 0.41 0.42 0.11
each first-level indicator and second-level indicator are Ö è
0.26 0.43 0.60
obtained, as shown in Table 6. RC4 = (0.24 0.34 0.42) × 0.09 0.26 0.43 = (0.10 0.26 0.43)
0.02 0.16 0.33
4.3 Investment risk evaluation of IFPPPs It can be seen from the above evaluation results that the
According to Equation (16), the investment risk level of the risk level of the first-level indicator RC2 is the highest and
first-level indicators of IFPPPs are calculated and the calcu- the risk level of the first-level indicator RC4 is the lowest.
lation process is as follows: Then, according to Equations (17) and (18), the overall in-
Ö è vestment risk value of IFPPPs is calculated and the result
Ä ä 0.06 0.20 0.37 Ä ä is as follows:
RC1 = 0.62 0.15 0.23 × 0.19 0.36 0.53 = 0.14 0.29 0.46
á ë
0.31 0.48 0.65 0.16 0.32 0.49
0.47 0.64 0.81
RC = (0.30 0.25 0.18 0.27) × = (0.23 0.39 0.56)
á ë 0.25 0.42 0.59
0.60 0.77 0.93 0.10 0.26 0.43
0.56 0.73 0.89
RC2 = (0.04 0.14 0.50 0.32) × = (0.43 0.60 0.77)
0.46 0.63 0.80
According to Equation (19), the similarity of each invest-
0.31 0.48 0.65
ment risk level value is calculated and the result is shown
Ö è in Fig. 3. It can be seen that the overall investment risk-
0.31 0.48 0.65 evaluation calculation result of IFPPPs has the highest
RC3 = (0.39 0.27 0.34) × 0.25 0.42 0.59 = (0.25 0.42 0.59) similarity with ML, i.e. the overall investment risk of IFPPPs
0.19 0.36 0.53
is at a relatively low level in China.546 | Clean Energy, 2021, Vol. 5, No. 3
4.4 Sensitivity analysis 4.4.1 Fluctuation of indicator weights
To examine the stability of the evaluation results, the
The results of risk evaluation are easily affected by indicator
sensitivity analysis of the influences for the first-level
weights and the number of experts. Thus, it is necessary to
indicator weights of the IFPPPs site selection will be im-
conduct a sensitivity analysis of the above calculation results
plemented. Four criteria, namely technical risk, economic
in two different ways to test the stability of this framework.
risk, social risk and environmental risk, all take 10%, 20%
and 30% less and more weight than the initial weights. The
VL
1 variation results of each investment risk level similarity
0.8 are displayed in Fig. 4.
VH L When the C1 or C4 weight fluctuation is from small to
0.6
large, the similarity values of ML gradually increase. On
0.4 the contrary, the similarity values of ML decrease as C2
0.2 or C3 increases. The similarity values of VL and medium
high (MH) are equal when the C1 weight increases by 10%
Downloaded from https://academic.oup.com/ce/article/5/3/536/6381587 by guest on 10 December 2021
0
of the original value or the C2 weight decreases by 10%
H ML
of the original value; regardless of how the weights of C3
fluctuate in Fig. 4, the similarity values of VL and MH are
nearly equal.
Taking a closer look at these results, the similarity
MH M values of ML are always the highest; the similarity values
of very high (VH) are always the lowest. It can be seen that
Fig. 3: Investment risk similarity value of IFPPPs the variations in the first-level indicator weights within a
C1 weight fluctuation C2 weight fluctuation
1.00 1.00
0.90 0.90
0.80 0.80
0.70 0.70
0.60 0.60
0.50 0.50
0.40 0.40
0.30 0.30
–30% –20% –10% 0% 10% 20% 30% –30% –20% –10% 0% 10% 20% 30%
VL L ML M VL L ML M
MH H VH MH H VH
C3 weight fluctuation C4 weight fluctuation
1.00 1.00
0.90 0.90
0.80 0.80
0.70 0.70
0.60 0.60
0.50 0.50
0.40 0.40
0.30 0.30
–30% –20% –10% 0% 10% 20% 30% –30% –20% –10% 0% 10% 20% 30%
VL L ML M VL L ML M
MH H VH MH H VH
Fig. 4: Sensitivity analysis results of indicator weightsXiao et al. | 547
certain extent have no significant impact on the final re- 5 Suggestions for the development
sults. Therefore, the results obtained by using this model of IFPPPs
are correct and scientific.
The construction of IFPPPs is conducive to alleviating the
contradiction between the increase in energy demand and
4.4.2 Fluctuation in the number of experts
sustainable development. Compared with the construction
As the number of experts may have an impact on the
of traditional photovoltaic power stations, areas with high
results, we invited more experts in risk management or
energy demand and abundant waters such as southern
photovoltaic power plants. In this part, we sent out ques-
China are more suitable for the development of IFPPPs. In
tionnaires to these experts and collected their answers.
order to effectively avoid investment losses, the relevant
Considering that too many experts are likely to cause in-
risk-response measures are proposed as follows.
ternal confusion among the decision committee, increase
the difficulty of data collection, increase the error rate
and other issues, too few experts may cause inaccurate 5.1 Economic aspect
evaluation results due to insufficient consideration or
Downloaded from https://academic.oup.com/ce/article/5/3/536/6381587 by guest on 10 December 2021
large deviations, so the sample sizes are 4, 5, 6, 7, 8, 9 and Economic risk is the highest risk for the development
10, respectively. And the detailed results are shown in of IFPPPs. High initial investment costs, operation costs
Table 7. and maintenance costs are key factors hindering the
It can be seen from the results that the evaluation re- development of IFPPPs. In terms of investment costs,
sults will also change when the total number of experts investors can increase their efforts to develop new tech-
changes within a certain range. This means that the re- nologies to improve the level of floating photovoltaic
sults vary depending on the attitudes of different experts. technology; at the same time, investors should quantify
But no matter how the total number of experts changes, production based on the actual conditions of IFPPPs, im-
the risk-evaluation level is consistent, which illustrates the prove management levels and reduce the marginal cost
robustness of the framework. of project investment. From the perspective of operation
and maintenance costs, the operation and maintenance
of IFPPPs are much more complicated than those of trad-
4.5 Comparative analysis itional photovoltaic power plants. Investors can adopt
To verify the reliability of the risk-evaluation results, we intelligent operation and maintenance methods as
use the matter-element extension method [40] to conduct much as possible to reduce the high labour costs caused
the comparative analysis. We divide the effectiveness into by traditional operation and maintenance methods,
seven levels: VL, L, ML, M, MH, H and VH. The classic do- such as establishing an operation and maintenance
main and segment domain of each indictor are shown in platform, using visualization technology based on the
Table 8. combination of building information management and
First, the indicator information is collected to get the geographic information system, and utilizing robot-
score of each expert. Second, according to the relevant inspection technology.
definition of the matter-element extension method, the
evaluation level of each indicator is calculated, as shown
in Table 9. Next, we can get the comprehensive correl- 5.2 Social aspect
ation degree of each evaluation level, as shown in Table Factors such as complex approval procedures at the social
9. Then, according to the principle of maximum correl- level, insufficient power demand and public opposition
ation, we can get that the investment risk level of IFFFPs have a greater impact on the investment and operation
is ML. We can find that the above results are consistent of IFPPPs projects. Complicated approval procedures have
with the results in Section 4.3, so the evaluation result is the greatest impact on the investment risk of IFPPPs. In
scientific. order to further promote the development of IFPPPs, the
Table 7: Sensitivity analysis results in the number of experts
Sd
Number of experts Comprehensive evaluation values VL L ML M MH H VH Evaluation level
4 (0.228,0.387,0.557) 0.666 0.779 0.949 0.881 0.711 0.547 0.441 ML
5 (0.229,0.390,0.559) 0.666 0.779 0.949 0.881 0.711 0.547 0.441 ML
6 (0.233,0.395,0.563) 0.660 0.773 0.943 0.887 0.717 0.554 0.447 ML
7 (0.234,0.394,0.563) 0.660 0.773 0.943 0.887 0.717 0.554 0.447 ML
8 (0.229,0.388,0.557) 0.665 0.779 0.949 0.881 0.711 0.548 0.441 ML
9 (0.231,0.390,0.559) 0.665 0.779 0.949 0.881 0.711 0.548 0.441 ML
10 (0.242,0.410,0.588) 0.643 0.757 0.927 0.903 0.733 0.570 0.463 ML548 | Clean Energy, 2021, Vol. 5, No. 3
Table 8: Classical domain and segment field of each indicator
Classical domain
Indicators VL L ML M MH H VH Segment field
C11 [0,0.14] [0.14,0.28] [0.28,0.42] [0.42,0.56] [0.56,0.72] [0.72,0.86] [0.86,1] [0,1]
C12 [0,0.14] [0.14,0.28] [0.28,0.42] [0.42,0.56] [0.56,0.72] [0.72,0.86] [0.86,1] [0,1]
C13 [0,0.14] [0.14,0.28] [0.28,0.42] [0.42,0.56] [0.56,0.72] [0.72,0.86] [0.86,1] [0,1]
C21 [0,0.14] [0.14,0.28] [0.28,0.42] [0.42,0.56] [0.56,0.72] [0.72,0.86] [0.86,1] [0,1]
C22 [0,0.14] [0.14,0.28] [0.28,0.42] [0.42,0.56] [0.56,0.72] [0.72,0.86] [0.86,1] [0,1]
C23 [0,0.14] [0.14,0.28] [0.28,0.42] [0.42,0.56] [0.56,0.72] [0.72,0.86] [0.86,1] [0,1]
C24 [0,0.14] [0.14,0.28] [0.28,0.42] [0.42,0.56] [0.56,0.72] [0.72,0.86] [0.86,1] [0,1]
C31 [0,0.14] [0.14,0.28] [0.28,0.42] [0.42,0.56] [0.56,0.72] [0.72,0.86] [0.86,1] [0,1]
C32 [0,0.14] [0.14,0.28] [0.28,0.42] [0.42,0.56] [0.56,0.72] [0.72,0.86] [0.86,1] [0,1]
C33 [0,0.14] [0.14,0.28] [0.28,0.42] [0.42,0.56] [0.56,0.72] [0.72,0.86] [0.86,1] [0,1]
Downloaded from https://academic.oup.com/ce/article/5/3/536/6381587 by guest on 10 December 2021
C41 [0,0.14] [0.14,0.28] [0.28,0.42] [0.42,0.56] [0.56,0.72] [0.72,0.86] [0.86,1] [0,1]
C42 [0,0.14] [0.14,0.28] [0.28,0.42] [0.42,0.56] [0.56,0.72] [0.72,0.86] [0.86,1] [0,1]
C43 [0,0.14] [0.14,0.28] [0.28,0.42] [0.42,0.56] [0.56,0.72] [0.72,0.86] [0.86,1] [0,1]
Table 9: Indicator evaluation results and comprehensive evaluation level
Correlation coefficient
Indicator VL L ML M MH H VH Evaluation level
C11 –0.068 –0.021 0.027 –0.045 –0.081 –0.103 –0.289 ML
C12 –0.015 –0.007 0.008 –0.006 –0.014 –0.020 –0.023 ML
C13 –0.029 –0.021 –0.009 0.010 –0.008 –0.020 –0.029 M
C14 –0.015 –0.014 –0.013 –0.011 –0.006 0.006 –0.004 H
C21 –0.028 –0.026 –0.022 –0.017 –0.006 0.009 –0.011 H
C22 –0.079 –0.071 –0.059 –0.040 –0.002 0.003 –0.038 H
C23 –0.035 –0.026 –0.013 0.008 –0.007 –0.022 –0.032 M
C24 –0.029 –0.021 –0.010 0.010 –0.008 –0.020 –0.028 M
C25 –0.020 –0.013 –0.001 0.001 –0.012 –0.019 –0.024 M
C31 –0.023 –0.012 0.010 –0.007 –0.020 –0.028 –0.034 ML
C32 –0.025 –0.017 –0.006 0.007 –0.010 –0.020 –0.026 M
C33 –0.030 0.000 0.000 –0.030 –0.045 –0.054 –0.060 L
C34 –0.028 0.048 –0.026 –0.054 –0.068 –0.076 –0.082 L
Comprehensive index relevance 0.577 0.891 1.000 0.832 0.690 0.574 0.000 ML
government functional departments should optimize the one hand, investors should give priority to choose areas
work process, improve the efficiency of approval and re- with a relatively good power infrastructure to reduce the
lease relevant information in a timely way; besides, in- risk of project connection to the grid; on the other hand,
vestors should reserve enough time for approval and can investors should conduct research on the power market
also hire professionals to carry out project applications to and choose a suitable installation for the local power-
reduce errors in the application process that are due to in- market demand. In addition, it is recommended to build
sufficient professional knowledge reserves. corresponding energy-storage equipment to improve the
utilization rate of photovoltaic power generation.
5.3 Technical aspect
With the continuous development and improvement of 5.4 Environmental aspect
photovoltaic power-generation-related technologies, the According to the results of the case study, environmental
possibility of technical risks such as unreasonable site se- risks such as severe weather conditions, corrosion risks
lection, improper structural design and difficulty in grid and damage to the aquatic environment have the least im-
connection is relatively low, and the impact on the invest- pact on investment in IFPPPs at this stage. Therefore, in-
ment and operation of IFPPP projects is relatively small. vestors can identify environmental risks at the end of the
According to the analysis of the fuzzy comprehensive project-development stage based on the selected IFPPPs,
evaluation results of sub-indicators at the technical level, including meteorological conditions, hydrological envir-
the main technical obstacle hindering the development of onment, etc. Investors also should actively use new anti-
IFPPPs is the difficulty of grid connection. Therefore, on the corrosion technologies to reduce the corrosion risk andXiao et al. | 549
extend the operating life; for example, the new patented generation flourishing water-food-energy nexus synergies.
pontoon floating system can be considered in IFFFPs. Applied Energy, 2020, 275:115389.
[3] Cromratie Clemons SK, Salloum CR, Herdegen KG, et al. Life
Besides, after IFFFPs are completed, it is necessary to
cycle assessment of a floating photovoltaic system and feasi-
monitor their impact on aquatic plants, animals and water
bility for application in Thailand. Renewable Energy, 2021,
quality; the government should put forward investment 168:448–462.
norms and operating mechanisms about ‘the integration [4] Dai J, Zhang C, Lim HV, et al. Design and construction of
of fishing and photovoltaic projects’, such as suspending floating modular photovoltaic system for water reservoirs.
the operation of distributed photovoltaic projects during Energy, 2020, 191:116549.
the harvest season of fishery products and establishing a [5] Sahu A, Yadav N, Sudhakar K. Floating photovoltaic power
plant: a review. Renewable and Sustainable Energy Reviews, 2016,
reasonable fishery compensation mechanism to improve
66:815–824.
the overall efficiency of investment returns.
[6] Redón Santafé M, Torregrosa Soler JB, Sánchez Romero FJ, et al.
Theoretical and experimental analysis of a floating photo-
voltaic cover for water irrigation reservoirs. Energy, 2014,
6 Conclusions 67:246–255.
Downloaded from https://academic.oup.com/ce/article/5/3/536/6381587 by guest on 10 December 2021
[7] Liu L, Sun Q, Li H, et al. Evaluating the benefits of integrating
Taking IFPPPs as the research object, this paper constructs floating photovoltaic and pumped storage power system.
a systematic investment risk-evaluation indicator system Energy Conversion and Management, 2019, 194:173–185.
for floating photovoltaic power stations from four aspects, [8] Goswami A, Sadhu PK. Degradation analysis and the impacts
including technology, economy, society and environment. on feasibility study of floating solar photovoltaic systems.
Sustainable Energy, Grids and Networks, 2021, 26:100425.
Based on the improved HFLTS–TFN method and the BWM–
[9] Cazzaniga R, Cicu M, Rosa-Clot M, et al. Floating photovoltaic
entropy method, an investment risk-assessment model
plants: performance analysis and design solutions. Renewable
for IFPPPs is constructed and empirically analysed. The and Sustainable Energy Reviews, 2018, 81:1730–1741.
result shows that the current investment and financing [10] Zadeh LA. Fuzzy sets as a basis for a theory of possibility.
costs, operation and maintenance costs and other eco- Fuzzy Sets and Systems, 1978, 1:3–28.
nomic risks of China’s IFPPPs are relatively high, the envir- [11] Wu Y, Liao M, Hu M, et al. A decision framework of low-speed
onmental risks are low and the overall project-investment wind farm projects in hilly areas based on DEMATEL-entropy-
TODIM method from the sustainability perspective: a case in
risks are at an ML level. It is recommended that the rele-
China. Energy, 2020, 213:119014.
vant government departments should improve the sup-
[12] Chen ZS, Zhang X, Govindan K, et al. Third-party re-
porting policies and declaration procedures for IFPPPs. verse logistics provider selection: a computational se-
And investors should take measures such as conducting mantic analysis-based multi-perspective multi-attribute
water environmental investigations and power-market re- decision-making approach. Expert Systems with Applications,
search in advance, adopting advanced technologies such 2021, 166:114051.
as new anti-corrosion technologies, improving project- [13] Lyu HM, Zhou WH, Shen SL, et al. Inundation risk assess-
ment of metro system using AHP and TFN-AHP in Shenzhen.
management levels and reducing construction costs to
Sustainable Cities and Society, 2020, 56:102103.
reduce investment risk. In summary, the investment risk-
[14] Wu Y, Hu M, Liao M, et al. Risk assessment of renewable
assessment model for IFPPPs constructed in this paper energy-based island microgrid using the HFLTS-cloud model
identifies important investment risk factors and proposes method. Journal of Cleaner Production, 2021, 284:125362.
specific measures to support investors’ investment deci- [15] Wang G, Xiao C, Qi Z, et al. Development tendency analysis
sions. At the same time, it has certain theoretical and prac- for the water resource carrying capacity based on system
tical significance for the development of IFPPPs and the dynamics model and the improved fuzzy comprehensive
evaluation method in the Changchun city, China. Ecological
realization of low-carbon development.
Indicators, 2021, 122:107232.
[16] Liang D, Dai Z, Wang M. Assessing customer satisfaction of
O2O takeaway based on online reviews by integrating fuzzy
Funding comprehensive evaluation with AHP and probabilistic lin-
guistic term sets. Applied Soft Computing, 2021, 98:106847.
This research is supported by the Chinese Postdoctoral Science
[17] Liu P, Zhu B, Wang P. A weighting model based on best–worst
Foundation (2020M680488).
method and its application for environmental performance
evaluation. Applied Soft Computing, 2021, 103:107168.
[18] Gupta H, Barua MK. A framework to overcome barriers to
Conflict of interest statement green innovation in SMEs using BWM and Fuzzy TOPSIS.
None declared. Science of the Total Environment, 2018;633:122–139.
[19] Mei M, Chen Z. Evaluation and selection of sustainable
hydrogen production technology with hybrid uncertain
References sustainability indicators based on rough-fuzzy BWM-DEA.
[1] Lee RP, Meyer B, Huang Q, et al. Sustainable waste manage- Renewable Energy, 2021, 165:716–730.
ment for zero waste cities in China: potential, challenges and [20] Kheybari S, Javdanmehr M, Rezaie FM, et al. Corn cultiva-
opportunities. Clean Energy, 2020, 4:169–201. tion location selection for bioethanol production: an appli-
[2] Zhou Y, Chang FJ, Chang LC, et al. An advanced comple- cation of BWM and extended PROMETHEE II. Energy, 2021,
mentary scheme of floating photovoltaic and hydropower 228:120593.You can also read