Investor Presentation January - March 2020 - Smith+Nephew
←
→
Page content transcription
If your browser does not render page correctly, please read the page content below
Investor Presentation
January – March 2020
Forward looking statements and non-IFRS measures

This document may contain forward-looking statements that may or may not prove accurate. For example, statements regarding expected revenue growth
and trading margins, market trends and our product pipeline are forward-looking statements. Phrases such as "aim", "plan", "intend", "anticipate", "well-
placed", "believe", "estimate", "expect", "target", "consider" and similar expressions are generally intended to identify forward-looking statements. Forward-
looking statements involve known and unknown risks, uncertainties and other important factors that could cause actual results to differ materially from what
is expressed or implied by the statements. For Smith+Nephew, these factors include: economic and financial conditions in the markets we serve, especially
those affecting health care providers, payers and customers; price levels for established and innovative medical devices; developments in medical
technology; regulatory approvals, reimbursement decisions or other government actions; product defects or recalls or other problems with quality
management systems or failure to comply with related regulations; litigation relating to patent or other claims; legal compliance risks and related
investigative, remedial or enforcement actions; disruption to our supply chain or operations or those of our suppliers; competition for qualified personnel;
strategic actions, including acquisitions and dispositions, our success in performing due diligence, valuing and integrating acquired businesses; disruption
that may result from transactions or other changes we make in our business plans or organisation to adapt to market developments; and numerous other
matters that affect us or our markets, including those of a political, economic, business, competitive or reputational nature. Please refer to the documents
that Smith+Nephew has filed with the U.S. Securities and Exchange Commission under the U.S. Securities Exchange Act of 1934, as amended, including
Smith+Nephew's most recent annual report on Form 20-F, for a discussion of certain of these factors. Any forward-looking statement is based on information
available to Smith+Nephew as of the date of the statement. All written or oral forward-looking statements attributable to Smith & Nephew are qualified by
this caution. Smith+Nephew does not undertake any obligation to update or revise any forward-looking statement to reflect any change in circumstances or
in Smith+Nephew's expectations. The terms ‘Group’ and ‘Smith+Nephew’ are used for convenience to refer to Smith & Nephew plc and its consolidated
subsidiaries, unless the context requires otherwise.

Certain items included in ‘trading results’, such as trading profit, trading profit margin, tax rate on trading results, trading cash flow, trading profit to cash
conversion ratio, EPSA, leverage ratio, and underlying growth are non-IFRS financial measures. The non-IFRS financial measures in this announcement are
explained and reconciled to the most directly comparable financial measure prepared in accordance with IFRS in our Fourth Quarter and Full Year 2019
Results announcement dated 20 February 2020.

                                                                                                                                                                2
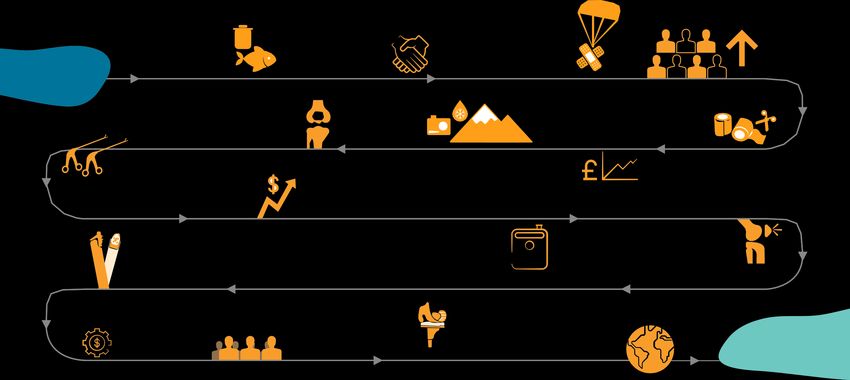
Our history
                                                                                                                                          1914
                                       1856                                              1896                                Days after the outbreak of WW1,
                               Thomas James Smith                                 Horatio Nelson Smith                       we received an order to provide
                           opened a chemist shop in Hull,                        entered into apartnership                      surgical and field dressing
    1856                   UK and develops a new method                            with his uncleforming                           supplies to French                                                             From 50
Smith+Nephew                   for refining cod liver oil                           TJ Smith & Nephew                             army within 5 months                                                            To1200
 established                                                                                                                                                                         During WW1, staff grew
                                                  1986                                                                                                                                  from 50 to 1,200
                               Key acquisitions of Richards Medical Company
                               in Memphis, specialists in orthopaedic products                                                                                       1937
                                  and DYONICS, an arthroscopy specialists                                                                                     We were listed on the
                                              based in Andover                                                                                               London stock exchange
                                                                                                                 1953                                                                                 1928
                                                                                                   We developed a special low-temperatureplaster                                                  We produced an
                        1995                                                                       for the Everest climbers on the 1953 expedition.                                             experimental bandage
                       Acquired                                                                It enabled them to send back their camera films, sealed                                            ElastoplastTM
               Acufex Microsurgical Inc,                                                       and airtight!. This same research led to the development
              making us a market leader in                                                                  of importantindustrial products
              arthroscopic surgical devices
                                                                         1999                                                                                                            2001
                                                                                                                                                                                     ◊
                                                        We were listed on the New York Stock                                                                                OXINIUM , a new material that
                                                      Exchange and in 2001 became a constituent                                                                          improves performance and increases
                                                          member of the UK FTSE-100 index                                                                                     the service life of total joint
                                                                                                                                                                         replacement systems, firstintroduced

                        2014                                                                 2013                                            2011
                                                                                     ◊                                            ◊
               Acquired Arthrocare Corp.                                JOURNEY II BCS sets a new standard inknee            PICO , the first pocket-sized, single-use
                 to expand our sports                                        implant performance, designed                     system, revolutionizes the negative
                   medicine portfolio                                         to empower patients to return                      pressure wound therapy market
                                                                                   to an activelifestyle
                                                        17,500+                                                                                                                                 Over
                                                                                                                                                                                                100
                                                                                                                                                                                                                Today
                        2019                                              2020                                                                                                                                  and growing
            Expanding in technologies of the                   We are proud of what we do                     We exist to restore people’s bodies and their self-belief
            future, investing inOrthopaedics,                and value our 17,500 employees                     by using technologies to take the limits off living.
               Biologics and Digital Surgery.                    who make thispossible                                 We call this purpose “LifeUnlimited”

 ◊Trademark of Smith & Nephew, ©2020 Smith & Nephew                                                                                                                                                                           3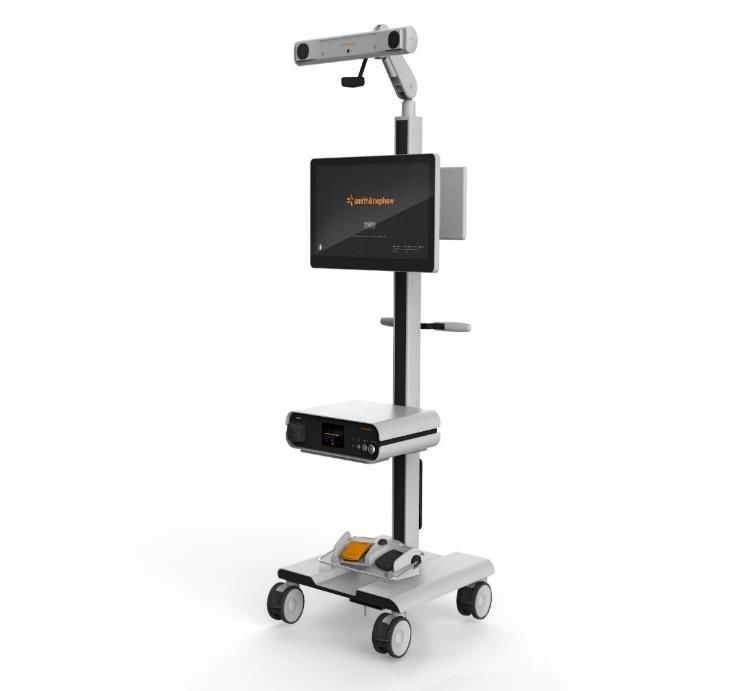
100                     FTSE100
                        A constituent of the UK’s
                        FTSE100, with ADRs
                                                    Shares
                                                    S&N has a progressive
                                                    dividend policy, and has
Smith & Nephew is a
                        traded on the New York      paid a dividend every
global Medical Device
                        Stock Exchange              year since 1937
portfolio company,
that has been trading
for over 160 years,
and operates in more
than 100 countries      $5.1bn                      ~17,500
                        Annual sales in 2019        We have around 17,500
                        were $5.1 billion           employees globally

                                                                               4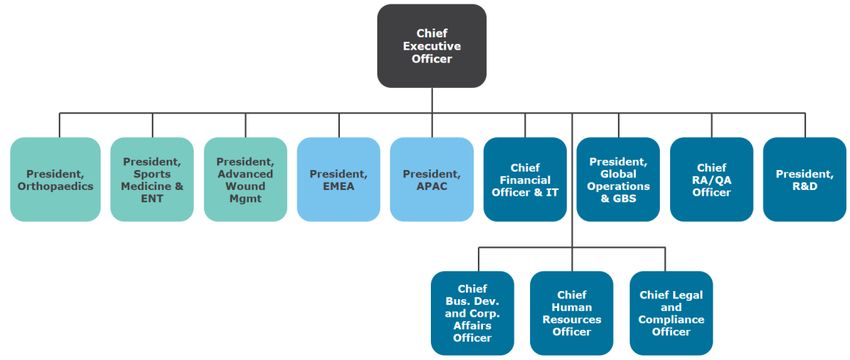
A portfolio medical device company

        ALLEVYN◊ LIFE                                                                      PICO◊
        Advanced Foam             Advanced                      Advanced        Negative Pressure
        Wound Dressings           Wound Care                    Wound Devices     Wound Therapy

                                                                                JOURNEY◊ II BCS
        Collagenase            Advanced                                              Bi-Cruciate
        SANTYL◊ Ointment       Wound                                                  Stabilised
        Enzymatic debrider     Bioactives                                          Knee System
                                                                     Knees

                                 ENT              $5.1bn
                               Arthroscopic      Revenues                               POLAR3◊
                                                                                        Total Hip
        COBLATION◊             Enabling                (2019)         Hips               Solution
        Wand                   Technologies

                                                                                    EVOS◊ SMALL
        REGENETEN◊             Sports Medicine                                     Plating System
        Bioinductive Implant
                               Joint Repair      Other Recon    Trauma
                                                 NAVIO◊
                                                 Surgical
                                                 System
                                                                                                    5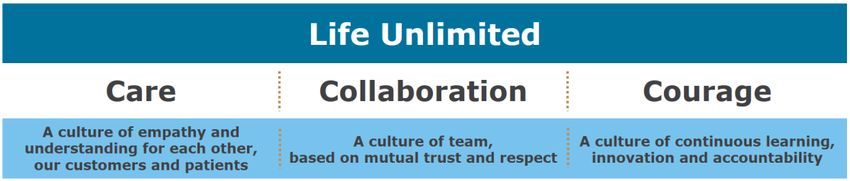
Leading positions in stable growing markets

               Hip & Knee Implants                                                             Sports Medicine                                             Advanced Wound Management

                   $14.8bn market                                                            $5.3bn market                                                                $9.4bn market
                      (growth +3%)                                                             (growth +5%)                                                               (growth +4%)

                   Others                                                                 Others                                                                                       3M
                    15%                                                                    17%                                                                                        19%
                                                    Zimmer
     Smith+                                         Biomet
     Nephew                                          32%                                                                                                       Others
                                                                                  DePuy                                        Arthrex
      12%                                                                                                                                                       51%
                                                                                 Synthes                                        33%                                                         Smith+
                                                                                   13%                                                                                                      Nephew
                                                                                                                                                                                             14%

                                                                                     Stryker                                                                                            Molnlycke
                                                                                                                           Smith+
            DePuy                                                                     11%                                                                                                  9%
                                                Stryker                                                                    Nephew
           Synthes                                                                                                                                                                Convatec
                                                 22%                                                                        26%
             19%                                                                                                                                                                    7%

                      #4 position                                                               #2 position                                                               #2 position

1)   Data used in 2019 estimates generated by Smith & Nephew is based on publicly available sources and internal analysis and represents an indication of market shares
2)   DePuy Synthes is a division of Johnson & Johnson.                                                                                                                                               6
Our performance

                                     Revenue                                                           Trading profit                      Trading cash conversion

                $5,138m                          +4.4%*                                 $1,169m               22.8% margin              83%
                                                              5138                                                               1169                    90%
                                                                                                                                         85%                    85%      83%
                                                   4904                                                                 1123                    75%
                                                                                            1099
                                         4765
                    4634      4669                                                                              1048
                                                                                                      1020

                    2015      2016       2017      2018       2019
                                                                                            2015      2016      2017    2018     2019    2015   2016     2017   2018     2019

                 Adjusted earnings per share (EPSA)                                                Dividend per share                                  Net debt

                102.2¢                          +5%        CAGR                        37.5¢                           +5%     CAGR     $1,600m
                                                                                                                35.0    36.0     37.5
                                                   100.9     102.2
                                         94.5                                               30.8      30.8                                      1550                     1600
                    85.1      82.6                                                                                                       1361            1281
                                                                                                                                                                  1104

                    2015      2016       2017      2018       2019                          2015      2016      2017    2018     2019    2015   2016     2017   2018     2019

* Underlying growth percentage after adjusting for the effect of currency translation, acquisitions and disposals.
                                                                                                                                                                                7
Q4 2019 revenue:
$1,407m, 5.6% underlying, 8.7% reported
Revenue split Product franchise growth
Emerging Markets
$252m
Orthopaedics 5.1%
US
$724m Knees 4.7%
Other Hips 0.7%
Established Markets
Other Recon 31.6%
$431m
Trauma 7.0%
Geographical growth Sports Medicine, ENT 10.1%
Sports Medicine Joint Repair 14.0%
Global 5.6%
Arthroscopic Enabling Technologies 5.1%
ENT 10.7%
Established Markets 3.5%
US Advanced Wound Management 1.9%
4.2%
AWC 0.7%
Other Established Markets
2.4% AWB -2.2%
Emerging Markets
16.6% AWD 15.2%
8Full Year revenue:
$5,138m, 4.4% underlying, 4.8% reported
Revenue split Product franchise growth
Emerging Markets
$957m
Orthopaedics 4.0%
US
$2,551m Knees 4.4%
Other Hips 2.1%
Established Markets
Other Recon 12.6%
$1,630m
Trauma 4.3%
Geographical growth Sports Medicine, ENT 7.0%
Sports Medicine Joint Repair 12.3%
Global 4.4%
Arthroscopic Enabling Technologies 0.8%
ENT 6.7%
Established Markets 2.1%
US Advanced Wound Management 2.2%
3.3%
AWC -0.2%
Other Established Markets
0.2% AWB -0.4%
Emerging Markets
16.1% AWD 15.7%
9Updated APEX targets
APEX – Jan 2018 APEX – 2020 update
Initial targets: Updated targets:
Benefits of $160m p.a. by 2022 Benefits of $190m p.a.
Total one-off costs of $240m Total one-off costs of $290m
~75% of benefits, >75% of costs by 2020 Closing in full by end of 2020
102020 Guidance
Sales growth: Trading profit margin:
Tax rate:
2020 Underlying: 3.5% to 4.5% At or slightly above 2019
18.5% to 19.5%(2)
Reported: 4.0% to 5.0%(1) level
2020 guidance assumes COVID-19 outbreak situation normalises early in Q2
Sales growth:
Trading profit margin: Tax rate:
Medium Term Consistent growth above
Ongoing improvement 18.0% to 20.0%(2)
market
(1) Based on the foreign exchange rates prevailing on 14 February 2020
(2) Tax rate on trading result 11Delivering on strategic imperatives
Achieve the full Transform the Expand in high- Strengthen talent Become the best
potential of our business through growth segments and capabilities owner
portfolio enabling
technologies
GROW TOGETHER EFFECTIVELY
12Priorities for 2020: Commercial execution
Achieve the full potential
of our portfolio
US sales Other Established Emerging
Markets sales Markets sales
$2,551m
$2,306m $2,354m
+3.3% $1,658m $1,693m $1,630m
+1%
0% +0.2% $857m $957m
$801m
+8% +16.1%
2017 2018 2019 2017 2018 2019 2017 2018 2019
All percentage changes indicate underlying growth
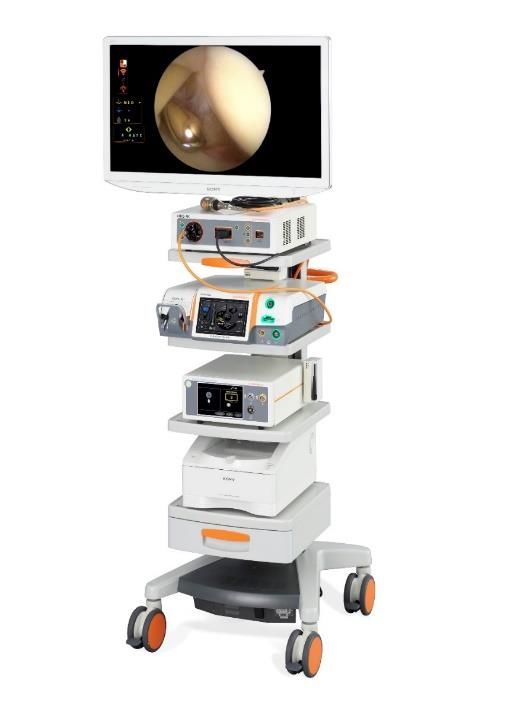
13Priorities for 2020: New generation of enabling
technologies
Transform the business
through enabling
technologies
Next generation Connected
Biologics arthroscopic tower
robotics platform
*
REGENETEN◊
Bioinductive Implant
*These devices are not cleared by the US FDA for distribution in the United States.
14Priorities for 2020: Commitment to innovation
Expand in high growth
segments
Launch key Increase R&D Continue with tuck-in
products investment M&A
5.2%
4.7% 4.8%
*
Next generation OR3O◊
robotics platform Dual Mobility
*
2017 2018 2019 Medium
term
R&D as % of sales**
COBLATION◊ HIP 7+NAVIO◊
HALO Wand
*This device is not cleared by the US FDA for distribution in the United States.
15
**R&D as % of sales excludes non-trading itemsPriorities for 2020: Talent and engagement
Strengthen talent and
capabilities
Build on franchise model Embed the new
and leadership team behaviours
16Priorities for 2020: Excellence through the value chain
Become the best owner
Operations transformation Commercial transformation
Key initiatives: Key initiatives:
• Optimised manufacturing network • Increasing share of direct distribution
• Rollout of lean methodology • Sales training and excellence
• Distribution network and supply • Enhancing professional education
chain opportunities
17Appendices
18Technical guidance
February 2020
Foreign exchange and other revenue impact
Impact of translational FX on revenue(1) (0.8%)
Acquisition impact on revenue +1.3%
Non-trading items
Restructuring costs c. $130-140m
Acquisition and integration costs c. $15-25m
European Medical Device Regulation (MDR) compliance costs c. $60m
Other
Amortisation of acquisition intangibles c. $160-170m
Income from associates c. $5m
Net interest(2) c. $55-60m
Other finance costs c. $15m
Tax rate on trading result 18.5-19.5%
(1) Based on the foreign exchange rates prevailing on 14 February 2020
(2) Includes interest associated with IFRS 16 Leases
19Franchise revenue analysis
2018 2019
Q1 Q2 Q3 Q4 Full Year Q1 Q2 Q3 Q4 Full Year Full Year
Growth Growth Growth Growth Growth Growth Growth Growth Growth Revenue Growth
% % % % % % % % % $m %
Orthopaedics 0 1 5 4 3 3.9 3.6 3.4 5.1 2,222 4.0
Knee Implants 2 3 4 3 3 4.1 4.3 4.6 4.7 1,042 4.4
Hip Implants (2) 1 4 4 2 2.4 2.9 2.6 0.7 613 2.1
Other Reconstruction 30 27 43 45 36 6.9 3.5 1.5 31.6 79 12.6
Trauma (2) (5) 3 1 (1) 4.8 2.8 2.2 7.0 488 4.3
Sports Medicine & ENT 1 3 3 2 2 5.3 5.6 6.9 10.1 1,536 7.0
Sports Medicine Joint Repair 5 7 8 8 7 11.0 11.9 12.2 14.0 794 12.3
Arthroscopic Enabling Technologies (5) (1) (2) (4) (3) (1.1) (2.1) 0.8 5.1 591 0.8
ENT 6 5 5 3 5 4.2 6.3 5.3 10.7 151 6.7
Advanced Wound Management (2) 1 1 2 0 4.1 1.2 2.1 1.9 1,380 2.2
Advanced Wound Care 0 2 1 2 1 2.0 (1.7) (1.8) 0.7 714 (0.2)
Advanced Wound Bioactives (12) (6) (7) (3) (6) 0.4 (1.2) 2.1 (2.2) 424 (0.4)
Advanced Wound Devices 2 9 11 14 9 16.4 16.0 15.4 15.2 242 15.7
Total 0 2 3 3 2 4.4 3.5 4.0 5.6 5,138 4.4
All revenue growth rates are on an underlying basis and without adjustment for number of selling days.
2018 growth by franchise has been re-presented to align with the new global franchise structure effective from 1 January 2019. There has been no change in total growth for any period presented.
20Regional revenue analysis
2018 2019
Q1 Q2 Q3 Q4 Full Year Q1 Q2 Q3 Q4 Full Year Full Year
Growth Growth Growth Growth Growth Growth Growth Growth Growth Revenue Growth
% % % % % % % % % $m %
US (2) 1 4 3 1 4.0 2.3 2.7 4.2 2,551 3.3
Other Established Markets(1) (2) 1 (1) 0 0 (0.1) (1.3) (0.3) 2.4 1,630 0.2
Established Markets (2) 1 2 2 1 2.2 0.9 1.5 3.5 4,181 2.1
Emerging Markets 9 6 10 8 8 15.3 16.2 16.0 16.6 957 16.1
Total 0 2 3 3 2 4.4 3.5 4.0 5.6 5,138 4.4
(1) Other Established Markets’ are Australia, Canada, Europe, Japan and New Zealand.
All revenue growth rates are on an underlying basis and without adjustment for number of selling days
21Trading days per quarter
Q1 Q2 Q3 Q4 Full year
2018 63 64 63 61 251
2019 63 63 63 62 251
2020 62 63 63 64 252
2021 64 64 63 60 251
22Sustainability Targets
People Planet Products
Creating an lasting positive impact A medical technology business with Innovating sustainably
on our communities a positive impact
By 2022, include sustainability review
Between 2020 and 2030, contribute Achieve an 80% absolute reduction in in New Product Development phase
1 million volunteer hours to the total life cycle greenhouse gas reviews for all new products and
communities in which we live and work. emissions by 2050, beginning by product acquisitions.
implementing 100% renewable
Empower and promote the inclusion By 2025, incorporate at least 30%
electricity (e.g. solar or wind) plans at
of all. post-consumer recycled content into
our facilities in Memphis (US) and
all packaging materials.
Malaysia by 2022, and at all of our
strategic manufacturing facilities by By 2025, complete supply chain
2025. assessment of all suppliers and
subsequent tier levels to assure
Achieve zero waste to landfill at our
compliance with our sustainability
facilities in Memphis (US) and Malaysia
requirements.
by 2025 and at all of our strategic
manufacturing facilities by 2030.
23You can also read