JAMES MCANDREWS: STUDENT DEBT AND HIGHER EDUCATION FINANCING - A PUBLIC FINANCE PERSPECTIVE
←
→
Page content transcription
If your browser does not render page correctly, please read the page content below
James McAndrews: Student debt and higher education financing – a
public finance perspective
Remarks by Mr James McAndrews, Executive Vice President and Director of Research of
the Federal Reserve Bank of New York, at the National Association of College and University
Business Officers, at the Waldorf Astoria, New York City, 5 February 2015.

                                                *     *      *

Accompanying slides can be found at the end of the speech.

Good afternoon. I’m happy to be here and to have the opportunity to share with you some
thoughts on the subject of financing higher education in the United States. The remarks I
make reflect my own views, and not those of the Federal Reserve Bank of New York or of
the Federal Reserve System.
Some of you may be wondering why the research director of a central bank is particularly
interested in the way we as a nation pay for college. The answer, of course, is that we are
gaining an increasing understanding that how we finance post-secondary education has
important effects on a variety of critical economic outcomes, including economic growth and
inequality. It’s this realization, combined with the fact that the outstanding student debt
balance has now surpassed $1 trillion, which has brought increased attention and discussion
to the question of education finance.
First, I’d like to acknowledge the work and research of Meta Brown, Rajashri Chakrabarti,
Andrew Haughwout, Donghoon Lee, Joelle Scally, and Wilbert Van der Klaauw in preparing
these remarks.
I’m an economist, so I’d like to start by discussing the economics of higher education finance
as I see them.
The first thing to make clear is that the evidence strongly supports the view that a college
degree, while expensive, is a worthwhile investment not only for the individual receiving the
education but also for society as a whole.
For individuals, the expected benefit-cost ratio of a college degree is well over 1.0 and
growing. Indeed, while more people are attending college over the last thirty years, college
graduates on average earn 80 percent more than those without a college degree, and are far
less likely to be unemployed, regardless of the phase of the business cycle. Of course both
effort and what we might call academic acumen are likely to play a role in a prospective
student attending a better college, and whether the student completes a degree, and so this
figure may overstate the value of college itself to any particular prospective student. But
careful work in economics has demonstrated that even after we control for talent, college is
worth it for most, but not necessarily all, students.
Part of the reason for the increasing importance of college is a result of what economists call
skill-biased technological change. The idea is that the kinds of technologies that are
increasingly influencing the workplace tend to favor people with more education. The
personal computer, for example, is a great tool that enhances the productivity of people with
lots of education, while it may actually be a substitute for unskilled labor. In addition to its
effect on earnings, higher education improves one’s quality of life by improving other
outcomes, like health.
Even when the large net benefit of college attendance is accurately perceived, there are
significant financial constraints on many families’ ability to finance a college education. After
all, the costs of college are concentrated in a few years at the very beginning of a career,
while the benefits are spread out over a long period that comes later. Borrowing is a natural
solution to problems like these, but there is limited enforceability of uncollateralized debt

BIS central bankers’ speeches                                                                  1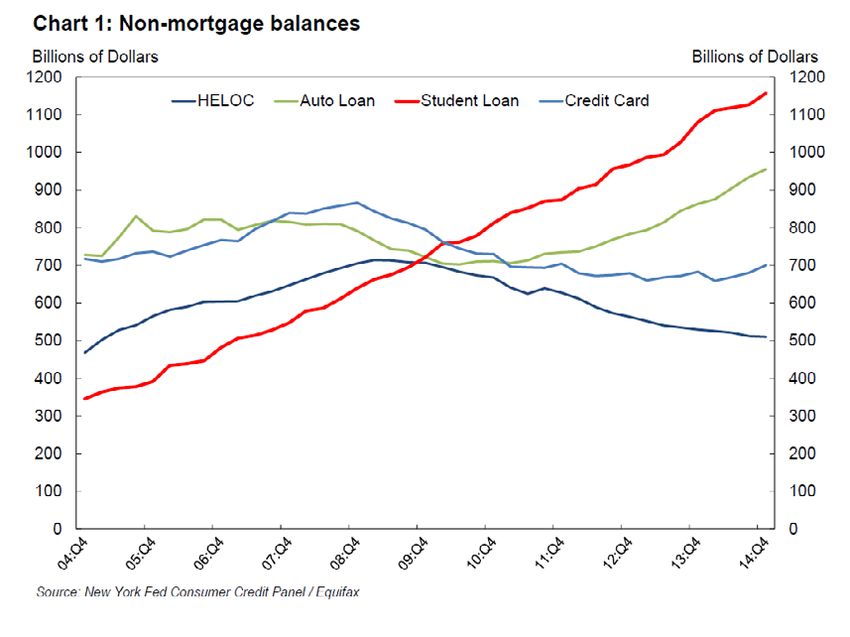
contracts and the private sector may be willing to provide less than the optimal amount to
support good educational outcomes.
In this environment, even optimal private debt contracts will not account for the second
important part of the benefit of higher education: that which accrues to society as whole.
Better-educated workers are higher paid and so pay more taxes, and they have a lower
incidence of dependency on programs like unemployment compensation and welfare. There
are positive spillovers from educated workers to others, raising aggregate productivity.
Better-educated workers produce more innovation and are more civically engaged. In a
democracy we are all better off when our fellow citizens understand the issues facing the
country.
Overall, a more skilled workforce is beneficial to us all. In addition, higher education is an
important export industry in which the US holds a significant comparative advantage. This
produces a better understanding among foreigners of the US and vice versa.
All of these social benefits mean that there is an appropriate role for the public sector in
helping to finance higher education. The best policy would align the social and private
benefits of attending college, and would find a way to relieve the liquidity and credit
constraints that families face. Finally, the best policy would direct scarce educational
resources toward those matches between student and institution that are likely to yield the
best educational outcomes. The best matches avoid regrettable dropouts or degrees granted
with little to show in the way of educational attainment or career prospects, or similar bad
outcomes.
In considering what the proper public role should be, it’s useful to think about an extreme
case. In Europe, higher education has traditionally been essentially 100 percent publicly
funded. This result is big subsidies for people – mostly wealthy people – who would have
gladly paid for college if they had to. Making college free also means that there will likely be
excess demand for the fixed number of seats at high quality institutions. Either this demand
has to be rationed, or quality will have to fall. Neither choice is particularly attractive. In fact,
excess demand and growing costs have put severe pressure on the European model for
financing higher education, and European countries are now gradually moving away from the
old system, introducing income-based tuition fees and loans to help restrain rising costs and
expand access to higher education to more social groups.
In the US, we’ve used a more complicated system that has several major elements. First, we
have public universities whose tuitions are less than the full cost of providing the education,
with the difference made up by state taxpayers. This can align the public and private benefits
in the long run, but won’t by itself mitigate the liquidity constraints that families face. Also, as I
will discuss in more detail later, it puts public universities at the mercy of the business cycle.
Second, we offer Pell grants to families with limited means to pay for college. We also use
the income tax system to reduce the cost of attending up to four years of college for people
with incomes below a certain threshold. These subsidies, which operate like vouchers since
they can be used at lots of different colleges and universities, serve to align private and
social returns and relieve liquidity constraints. Because they are related to income, they also
potentially have the additional important benefit of reducing inequality.
The final major element of our system is loans. These relieve the liquidity constraint, but they
don’t necessarily contribute to aligning the private and social returns to higher education.
Since student loans are currently receiving a huge amount of attention, and since the New
York Fed has been a leader in providing information about the sector, I’d like to spend the
rest of my time discussing what I see as the main issues with student debt and what to do
about them.

2                                                                               BIS central bankers’ speeches
Issues with student debt
Student loans seem like a good part of the solution, but over the past decade our reliance on
loans for funding higher education has increased and we are learning that they have many
problems and implications we had not sufficiently understood or considered. As shown in
Chart 1, between 2004 and 2014, the total student debt in the US tripled from $364 billion in
2004 to $1.16 trillion in 2014. Expressed in annual terms, this means student debt increased
by an average of 13 percent per year. As shown in the chart, among the various types of
household debt, student debt is unique. While balances on all forms of household debt –
including mortgages, credit cards, auto loans, and home equity lines of credit – declined
during and after the Great Recession, student debt has steadily risen. In 2010, student debt
surpassed credit cards to become the second largest form of household debt after
mortgages whereas prior to 2008, student debt was the smallest form of household debt.
Our research indicates that this increase in aggregate debt was due to increases in both the
number of borrowers as well as increases in the average balance per borrower. Between
2004 and 2014, the number of borrowers increased by 92 percent from 23 million borrowers
to 43 million. In the same period, average debt per borrower increased by 74 percent, from
about $15,000 to $27,000. With respect to the rise in the number of borrowers, we find that a
steadily increasing share of young people are taking out student loans: in 2004, only about
27 percent of 25 year olds had student debt while 9 years later, in 2013, the proportion of
25 years olds with student debt had increased to about 45 percent.
There are several explanations for these increases. First, more people are attending
college 1. Second, students are staying in college longer and attending graduate school in
greater numbers, and loans to finance graduate study have become more readily available.
Third, competing non-education sources of credit such as home equity loans and credit card
debt have imposed tighter underwriting standards, and generally have become less available
since 2008. A fourth reason is the slow repayment rate on these loans, which I will discuss in
more detail a little later. But another important reason for the increase in overall student debt,
which I will discuss first, is the significant growth in the cost of a college education during the
period 2.
Federal and State funding of subsidized higher education is heavily reliant on tax revenues
and competes with other forms of public spending, and within education budgets competes
with pre-school, elementary and secondary education spending. During the recession we
saw severe revenue declines at the federal and state levels. Being highly credit constrained,
with university subsidies being part of operating budgets which must be funded with current
tax revenues, many states cut planned education funding while allowing public universities to
increase tuition levels. This in turn contributed to a significant shift of education cost to
students and parents.
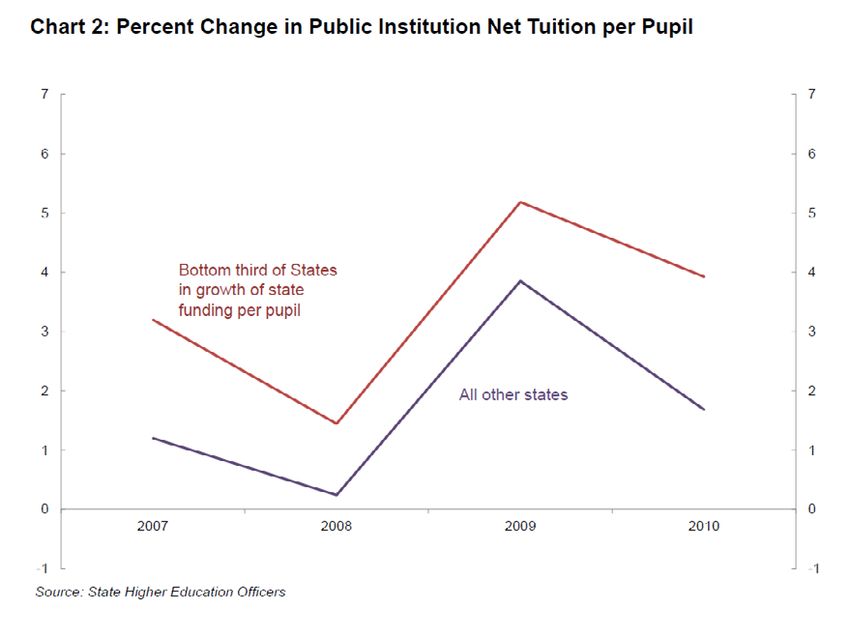
In research conducted at the New York Fed, we found that since 2007 those states with the
largest funding cuts also had the highest tuition increases, with an average annual tuition
growth rate of 3.4 percent. As shown in Chart 2, this compares to an annual average tuition
growth rate of 1.7 percent during the 2007–2010 period for all other states combined. That is,
we observe an economically meaningful relationship between public funding and public
institution tuition changes since 2007.
Higher tuition has forced many students to take on larger student loans. Student debt and
tuition increases were not limited to public institutions. Research conducted at the NYFed
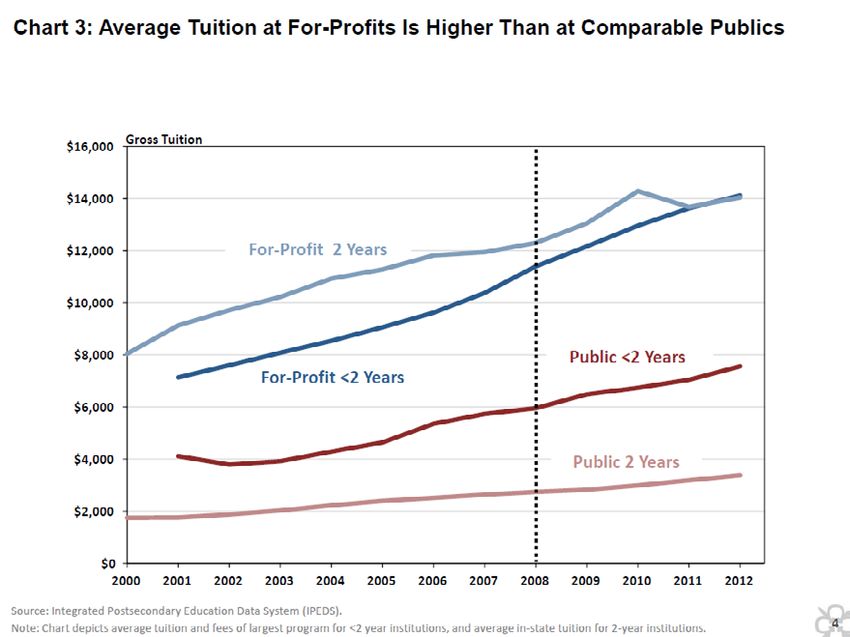
found that over the same period there was even larger tuition and student loan growth at for-
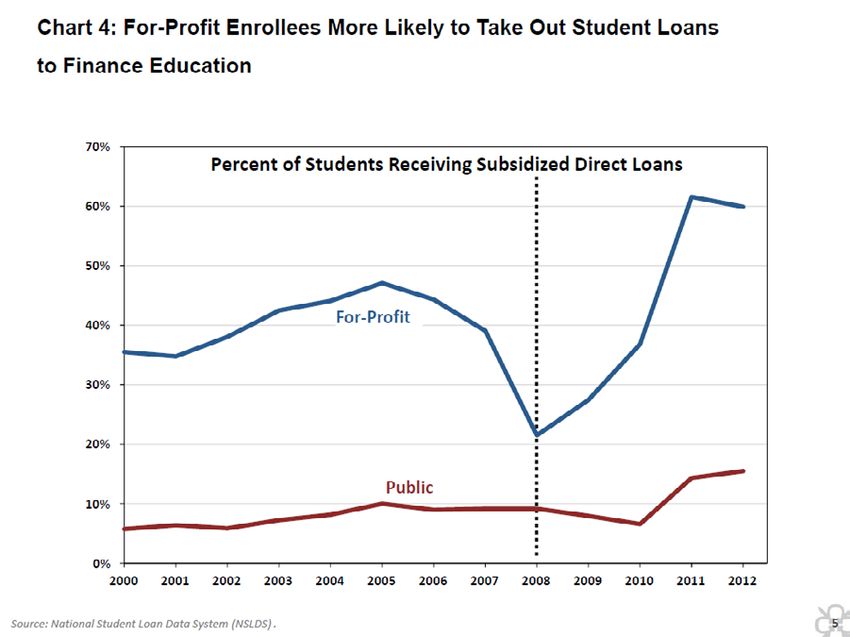
profit institutions. [Chart 3] Despite larger average support through Pell grants, with tuition
1
National Center for Educational Statistics, 2012. “Digest of Education Statistics”.
2
College Board, 2013. Trends in College Pricing, last accessed February 5, 2015.
BIS central bankers’ speeches 3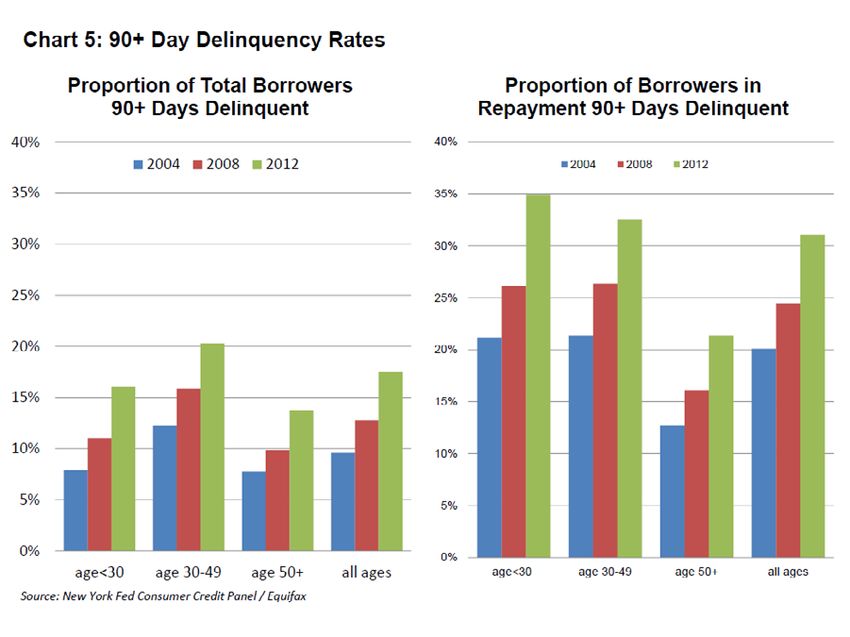
levels more than double those at public institutions, average net tuition and average loan
sizes were considerably higher at for-profit educational institutions. In addition, a much larger
proportion of students at for-profits took out subsidized direct loans. [Chart 4]
Returning now to the surge in aggregate student debt, an increase in borrowing for college is
not by itself a concern, given the high average lifetime payoff to college. In fact, in part the
increase in debt reflects an arguably sensible increase in educational investment during a
period of weak labor market opportunities. However, the growth in debt has important
implications for the overall economy, and there are several worrisome aspects of the increase
in student debt. Many of these problems have to do with the high rates of delinquency and
default on student debt, and the generally low repayment rates on these loans.
Over the past eight years there has been a considerable increase in payment difficulties for
student loan borrowers. The most common measure of inability to meet the debt obligation is
the proportion of borrowers 90 days or more past due on their payments. We refer to this as
the “measured delinquency rate.” As of the fourth quarter of 2014, about 17 percent, or
7.3 million borrowers, were 90 days or more delinquent on their student loan payments; see
the left panel of Chart 5. There was a strongly increasing trend in delinquency between 2004
and 2014, with measured delinquency rising from an overall rate of less than 10 percent in
2004 to 17 percent in 2014.
The measured delinquency rate on student debt is currently the highest of any consumer
debt product, although for most of the last decade credit card delinquency was even higher.
Nonetheless, the measured delinquency rate is somewhat misleading, and the effective
delinquency rate as we define below, on student debt is even higher. As noted above, in
2014 the measured delinquency rate among the 43 million borrowers was 17 percent. But
many of the remaining 83 percent in fact were not paying down their loan balances. While
37 percent did reduce their balance from the previous quarter by at least one dollar,
13 percent of borrowers had the same balance as the previous quarter. A full 33 percent of
borrowers actually saw an increase in their balance. In other words, 46 percent of borrowers
were neither delinquent nor paying down their loans.
Those borrowers whose balances did not decline are likely not yet in the repayment cycle,
meaning that they were either still in school, in deferral, or in a forbearance period delaying
their regular payments. This group may also include some borrowers who participate in
income-based repayment plans and make only small payments, which are often insufficient
to cover the accumulated interest. In order to have a more accurate picture of the
delinquency rate, we calculate the “effective delinquency rate” by excluding this 46 percent of
borrowers not in repayment; the result is shown in the right-hand panel of Chart 5. This
effective delinquency rate is nearly double the measured delinquency rate, with almost one-
third of borrowers in repayment being delinquent on their debt.
It is important to note that because of the unique character of student debt, an increasing
delinquency rate defined either way does not necessarily imply that a greater percentage of new
borrowers are falling behind on repayment. Borrowers who became delinquent in the past and
remain so are included in the delinquency rate. Some may also default, which is defined as
being more than 270 days past due in the case of federal loans. Because student debt is not
generally dischargeable, even in bankruptcy, the delinquency rate may continue to increase
even when the percentage of borrowers becoming newly delinquent remains constant.
We therefore also computed the proportion of borrowers in repayment who became newly
delinquent on a quarterly basis. As shown in Chart 6 in 2005 about 6 percent of
nondelinquent borrowers in repayment transitioned into delinquency each quarter, on
average. By 2012, that rate had increased to almost 9 percent. This confirms that indeed
there was an increasing trend of borrowers becoming newly delinquent over time.
Our delinquency numbers may seem higher than those reported elsewhere. One reason for
this is that our data allow a more comprehensive description of student debt delinquency and
repayment rates than was previously possible. Our data come from consumer credit reports

4                                                                           BIS central bankers’ speeches
for a 5 percent random sample of the population – that is for 12 million individuals aged 18
and older. Instead, existing knowledge of student federal loan defaults is based mainly on the
three-year cohort default rates computed and released by the Department of Education each
year. An institution’s cohort default rate is calculated as the percentage of borrowers in a
cohort who default before the end of the second fiscal years following the fiscal year in which
the borrowers entered repayment.
In research that will be released later this month in a series of blog postings on our Liberty
Street Economics blog, we use our data and a slightly different definition to compute
comparable 3-year cohort default rates. Importantly, we find that three years out, we haven’t
seen the full picture of borrowers who will default. Our calculations indicate that the 3-year
default rate for the 2009 cohort rises by more than a third by year 5. This is also true of
earlier cohorts. The 2005 cohort had a 3-year default rate at 13 percent – but this is only half
of the defaults that we see nine years out. Taken together, these findings indicate that the
student loan delinquency problem is much worse than currently understood.
Another way to look at borrower difficulty in loan repayment is to consider the state of
repayment by the end of 2014 for all student loan borrowers we observe finishing their new
loan accumulation, between 2005 and 2010. High rates of delinquency and default, and the
high prevalence of participation in repayment-delaying programs such as deferments,
forbearances and income based repayment, lead to a lower rate of balance reduction in the
years after student loan borrowers leave school. In order to understand the magnitude of this
delay, we investigate the extent of student loan repayment that recent school-leaving cohorts
have achieved by 2014.
For the blog series, we calculated the outstanding balance of each of the 2005–2010 school-
leaving cohorts as of the second quarter of the school-leaving year. For each cohort, we then
recorded the share of the original student loan balance that remained as of the end of 2014.
For example, for the 2010 cohort 91 percent of the original balance remained unpaid four
and a half years later, at year-end 2014. This is typical of all the cohorts we examine, from
2005 forward.
So what accounts for the high default rates and low repayment rates of recent cohorts?
Undoubtedly the weak labor market conditions for entering college graduates played an
important role in explaining defaults and low loan repayment rates. As the youth unemployment
rate continues to improve, we would expect repayment rates to gradually improve.
However, while the available data limits deeper analysis of this issue, it seems reasonable to
suspect that high college dropout rates contributed to loan repayment problems. As is well
known, approximately 40 percent of college students drop out of college before finishing their
degree. Among low-income students two-thirds don’t complete their degree, with rates also
varying across institutions and majors. While the average wage returns to college remain
high, for the substantial share of student loan borrowers who drop out of college, the net
returns are likely to be small or negative.
Returns are also likely to be small for those who attended a set of for-profit institutions.
Enrollment at those institutions surged during the recession. While our data don’t allow us to
investigate the returns for these groups of students, their especially low loan repayment rates
(as reported elsewhere) are consistent with low post-college employment and earnings,
suggesting that eventual returns to these educational investments may be low.
The increase in defaults and decline in repayment may also reflect a change in the
composition of college entrants during the recession, where even those with relatively low, or
even negative returns to college, enrolled in order to qualify for grants and loans as a source
of income.
The individual and macroeconomic implications of growing student debt go well beyond the
high default rates and may not have been sufficiently anticipated and understood. Our
research suggests that the sharp buildup of student debt has contributed to large behavioral

BIS central bankers’ speeches                                                                 5
changes among the Millennial generation. First, among those with student debt, a growing
share continues to live with their parents. For example, we see that states that have
experienced sharper climbs in average student debt per graduate since the recession have
also shown steeper growth in the rate at which 25 year olds live with their parents. Similarly,
our research suggests that student debt has contributed to a decline in home and car
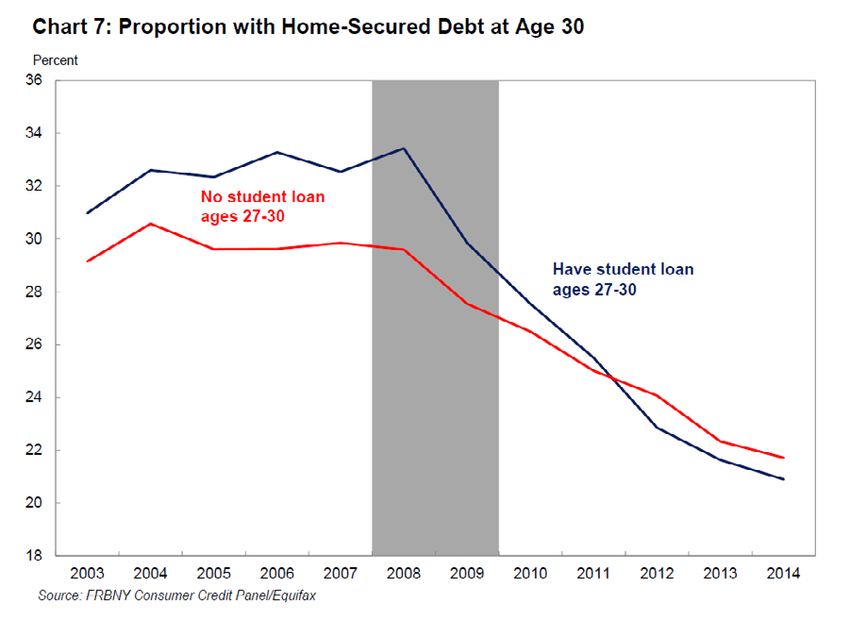
purchasing. As shown in the next chart [Chart 7], the proportion of 30 year olds with a home
mortgage and the share of 25 year olds with a car loan have dropped much faster among
those with SL debt.
More serious econometric research indicates that the relationships between increased
student debt and both higher coresidence with parents and lower home buying at age 30 are
in fact causal and exist whether or not one controls for educational attainment. Holding other
factors constant we find that in states with larger increases in student debt per graduate
there was a greater decline in home buying by young individuals. Overall, the high level of
existing debt and the apparent new norm for college financing, have important long-term
implications for the housing market. With new cohorts continuing to leave college with high
debt levels and entering the housing market at older ages, we can anticipate an overall
persistently lower home ownership rate than in the pre-recession period.
So what is causing the withdrawal from home and car purchase markets? It is likely that
rising student debt and an uncertain economic outlook have depressed demand. But most
likely, declines in credit supply play an important role as well. Our analysis shows that
average credit scores have fallen for student debt holders relative to those with no student
debt. Clearly for the substantial and growing group of student loan borrows who are
delinquent or have defaulted on their debt, access to credit is reduced through potentially
long-lasting negative effects on credit scores. Better data is required to evaluate the extent to
which the decline in car and home loan originations is concentrated among those delinquent
on their student loans and those who dropped out of college, or whether it is more
widespread among all those with student loans.
The fast growth of student debt and delinquencies, and the associated withdrawal of student
loan borrowers from mortgage and other credit markets have led to a renewed policy debate
about the viability and optimality of our higher education funding model. Some call for
increased federal and state support for higher education to reverse the recent trend towards
shifting the cost of higher education to students and parents. Others talk about a new debt
bubble of uncollateralized loans provided to ill-prepared students who are unlikely to see any
real returns to their investments, calling for better oversight and underwriting of loans. Yet
others point to the persistent high returns to a college education and argue that the current
situation represents primarily a repayment crisis rather than a debt crisis.
In my view, all these policy ideas deserve serious consideration. Some scholars argue that
the current system turns reasonable levels of debt into crippling payment burdens that can
prevent young workers from attaining financial independence and stability. 3 They propose a
single, simpler, income-based repayment system. Such a program would undoubtedly
benefit many borrowers, allowing them to better smooth consumption. However, the very low
cohort repayment rates we see, even ten years after entering repayment, suggest that
realized labor market returns to these higher education investments appear to be lower than
one would expect. While these returns may gradually increase as the labor market improves,
for some the returns may in fact stay low, especially among college dropouts and those who
attended some for-profit institutions.
Even if the average returns to a college education remain large, or even grow, students
generally have a larger amount of debt to pay off. As mentioned earlier, in response to
3
Dynarski, Susan and Daniel Kreisman, 2013. “Loans for Edicational Opportunity: Making Borrowing Work for
Today’s Students,” Hamilton Project Working Paper, October.
6 BIS central bankers’ speeches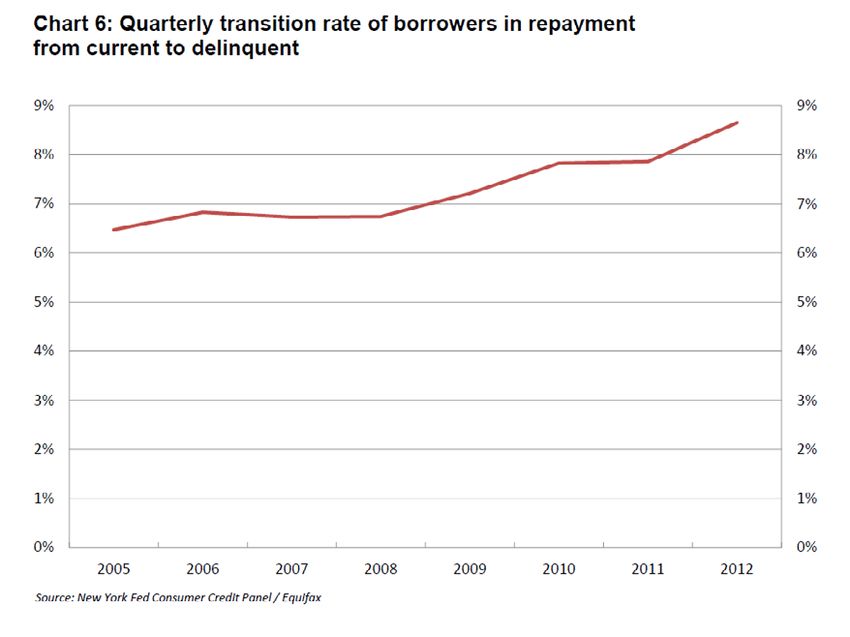
reduced state and federal subsidies, educational institutions raised tuition, leaving students
and their parents paying a greater share of the cost of higher education, thereby leaving
students less of the surplus and a lower net return on their investment.
There are therefore reasons to be concerned about the viability of the current system (with
various income-based repayment programs) as well as an alternative income-based
repayment system. The high delinquency rate and very low repayment rates among recent
cohorts have implications for the sustainability of higher education financing more generally.
While there is considerable uncertainty about the ultimate amount, it appears likely that a
significant portion of the outstanding federal student loans in income-based repayment-type
programs will ultimately be charged off after 20 or 25 years.
Another potential threat to the sustainability of the current system, especially visible in the
current low interest rate environment, represents the entry of private lenders engaged in
cream skimming, providing loans that slightly undercut the administratively set interest rate
on federal loans for those enrolled in high-return and low-risk programs towards business,
medical and law degrees at top ranked institutions. There is a risk given the rapid growth of
this industry that this could have a considerable impact on the average quality of loans held
by the federal government.
A primary policy challenge in higher education financing is to increase access to higher
education to more people through grants and loans but in such a way that the private and
social net returns remain positive. This requires a combination of financial support but with
sufficient likelihood of success/ability to repay/for positive return.
The low returns to some students’ experience with higher education, evidenced by high
dropout and default rates, point to significant heterogeneity in outcomes for college students.
An individual making the joint decision of whether to enter college and which college to enter
faces a high degree of uncertainty regarding the future outcome of the educational
experience. Tuition subsidies funded by state taxes and Pell grants funded by federal taxes
work to distribute this risk over a wide pool of people. However, individuals with good college
outcomes enjoy the private benefits that accrue to their higher-earning power. As a result, it
is likely that the best type of financing arrangement would require at least some tuition
payments from students.
To overcome the liquidity constraint faced by families whose members are entering college, it
makes sense to have a loan program. Importantly, the financial system, whether private or
public, should direct scarce resources to highly-valued investments. Given the wide
heterogeneity of educational outcomes by type of student and type of institution, any loan
program should take careful account of the expected quality of the match between the
prospective student and the educational institution. This is a type of underwriting that could
be employed much more extensively in the federal student loan program, to the benefit of
both borrower and lender. In addition, by restricting the availability of loans to those matches
that are likely to succeed, the social benefits will be achieved at lower cost.
While there is currently little underwriting of student loans in terms of individual or family
wealth – which is as it should be – better underwriting of loans may result in higher
preparedness standards for students. Just as importantly, it will require evidence, provided
by the institution, of sufficient success in graduating students of a specific preparedness level
and placing them into viable jobs with sufficient income to permit repayment of the loans.
This unfortunately contrasts with the current student loan system. We see evidence of
problems associated with the lack of careful underwriting standards for educational matches
that are supported by student debt. For example, current performance for some degree
programs and some universities are problematically weak, in terms of degree completion
rates and loan repayment rates. There have been reports of some schools in cities with large
minority populations and low-income residents who tried to build enrollment by encouraging
academically under-qualified students to apply for loans that they would be unlikely to be
able to repay, especially if they received a substandard education. These practices

BIS central bankers’ speeches                                                                  7
undermine our commitment to financing effective higher education matches, and it is
important that they be addressed.

Conclusion
Nothing in the analyses I discussed with you undermines the strong case for completing a
college degree for prospective students who match well with a particular college. Rather we
see our evidence as suggesting that the way we as society finance those degrees – with an
increasing reliance on debt held by the students – has costs to both borrowers and lenders
that are only now becoming clear. Given the social benefits of an educated population, we
see a strong case for some public role in financing college. Nonetheless, there are many
private benefits, including higher lifetime earnings to be had by the successful college
graduate. Therefore it is likely that the best system of finance also includes a tuition payment
by the student.
Because many prospective students are credit and liquidity constrained, and because of the
limited enforceability of debt, we outlined the case for a government-supported student loan
program to support the payment of tuition. However, we see a case for stronger underwriting
standards that would assess the likely quality and outcome of the education match between
a prospective student and the educational institution, which would better deliver resources to
high potential educational matches, and avoid encouraging poor ones.
We’ve learned a lot over the past several years about how student loans are affecting individual
borrowers, the taxpayers and the aggregate economy. We’ve by no means answered all the
relevant questions, and with over a trillion dollars in outstanding debt and the future of our
workforce at stake, I consider these issues to be of first-order importance to the nation.
We at the New York Fed will continue to search for new facts to put on the table and push
the debate forward.

                                           Charts

8                                                                           BIS central bankers’ speeches
BIS central bankers’ speeches 9
10 BIS central bankers’ speeches
BIS central bankers’ speeches 11
You can also read