LAMBDA Deliverable 2.1 Big Data Challenges and Analysis of Scientific and Technological Landscape - LAMBDA Project | Lambda
←
→
Page content transcription
If your browser does not render page correctly, please read the page content below
Page 1 of 43

                      Horizon 2020 Grant Agreement No 809965
                Contract start date: July 1st 2018, Duration: 30 months

               LAMBDA Deliverable 2.1
     Big Data Challenges and Analysis of Scientific
             and Technological Landscape
                                  Due date of deliverable: 31/12/2018
                                  Actual submission date: 28/12/2018

                                          Revision: Version 1.0

                                         Dissemination Level
PU   Public                                                                                         x
PP   Restricted to other programme participants (including the Commission Services)

RE   Restricted to a group specified by the consortium (including the Commission Services)
CO   Confidential, only for members of the consortium (including the Commission Services)

                   This project has received funding from the European Union’s Horizon 2020 Research
                   and Innovation programme, H2020-WIDESPREAD-2016-2017 Spreading Excellence
                   and Widening Participation under grant agreement No 809965.

                                    LAMBDA Deliverable D2.1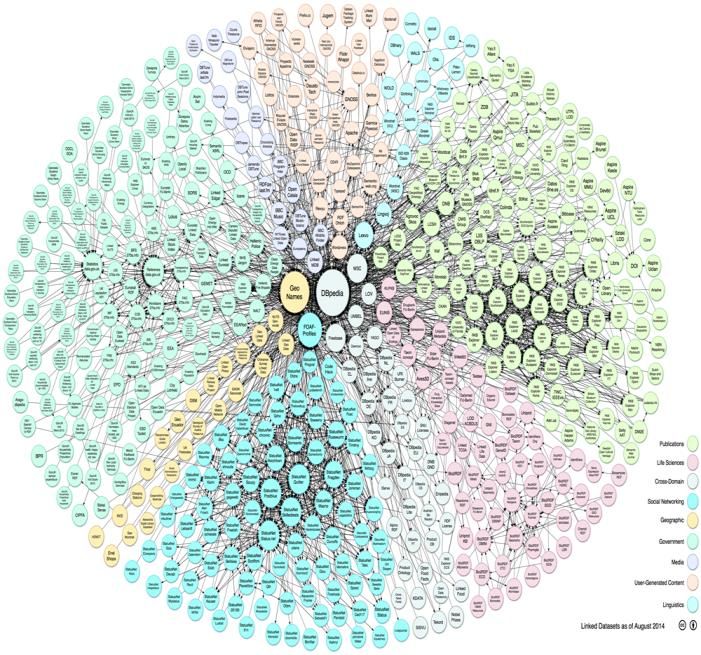
Page 2 of 43

 Author(s)               Dea Pujić (PUPIN), Marko Jelić (PUPIN), Hajira Jabeen (UBO)

 Contributor(s)

 Internal Reviewer(s)    Tim Furche (UOXF)
 Approval Date
 Remarks

 Workpackage             WP 2 Exploiting Synergies and Setting the Twinning Initiative
 Responsible for WP      Fraunhofer Institute for Intelligent Analysis and Information Systems
 Deliverable Lead        Institute Mihajlo Pupin (Valentina Janev)
 Related Tasks           Task 2.1 Science and Technology watch

Document History and Contributions

Version   Date            Author(s)                 Description
0.1       10.12.2018      Dea Pujić, Marko Jelić    Contribution
0.2       20.12.2018      Hajira Jabeen             Contribution
0.3       21.12.2018      Tim Furche                Review
0.4

© Copyright the LAMBDA Consortium. The LAMBDA Consortium comprises:

    Institute Mihajlo Pupin (PUPIN)                                         Co-ordinator         Serbia
    Fraunhofer Institute for Intelligent Analysis and Information
                                                                            Contractor           Germany
    Systems (Fraunhofer)
    Institute for Computer Science - University of Bonn (UBO)               Contractor           Germany
    Department of Computer Science - University of Oxford (UOXF)            Contractor           UK

Disclaimer:
The information in this document reflects only the authors views and the European Community is not liable
for any use that may be made of the information contained therein. The information in this document is
provided ”as is” without guarantee or warranty of any kind, express or implied, including but not limited to
the fitness of the information for a particular purpose. The user thereof uses the information at his/her sole
risk and liability.

                                        LAMBDA Deliverable D2.1
Page 3 of 43

Executive Summary

This deliverable entitled “Big Data Challenges and Analysis of Scientific and Technological
Landscape” gives an overview of the Big Data concepts, outlines some of the relevant challenges
in this domain and reviews and describes the current state of the art tools relevant to Big Data
applications. With the potential use cases for Big Data in mind, particular technological barriers are
imposed and specialized software solutions, frameworks and libraries, described in this document,
need to be employed in order to surpass the limitations of traditional methods for data storage and
analysis.

                                     LAMBDA Deliverable D2.1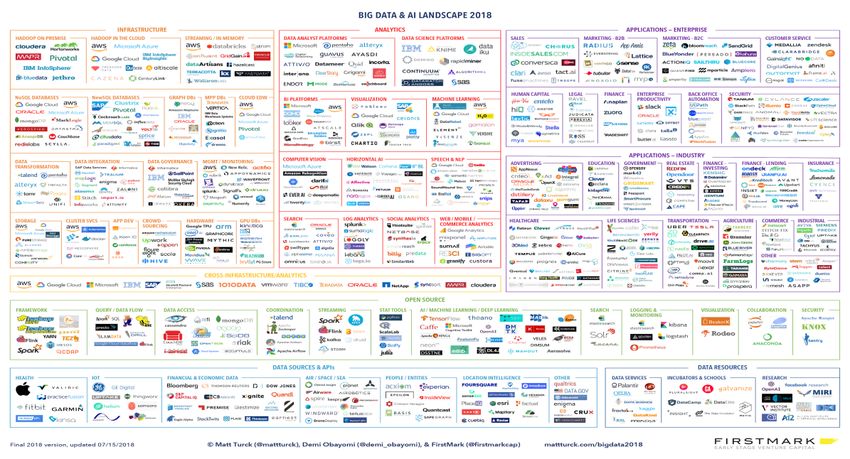
Page 4 of 43

Table of contents

   Executive Summary ............................................................................................................... 3
   Table of contents .................................................................................................................... 4
   Abbreviations and Acronyms .................................................................................................. 5
   List of Figures ......................................................................................................................... 5
   List of Tables .......................................................................................................................... 5
1.    Introduction ...................................................................................................................... 6
2.    Background ...................................................................................................................... 7
   2.1 Big Data Definition and History ......................................................................................... 7
   2.2 Big Data Applications in General .................................................................................... 10
3.    Landscape ...................................................................................................................... 16
   3.1 Big Data Frameworks ..................................................................................................... 16
   3.2 NoSQL Platforms and Knowledge Graphs ...................................................................... 17
   3.3 Stream Processing Data Engines ................................................................................... 21
   3.4 Big Data Preprocessing .................................................................................................. 24
   3.5 Big Data Analytics .......................................................................................................... 25
   3.6 Big Data Visualization Tools ........................................................................................... 28
4.    Big Data Challenges ...................................................................................................... 32
   4.1 Challenges of Data ......................................................................................................... 32
   4.2 Challenges in Big Data Landscape ................................................................................. 33
      Big Data Technologies ..................................................................................................... 33
      Uncertainty in Data Management ..................................................................................... 34
      Talent Gap 34
      Cloud or Premises ........................................................................................................... 34
      Scalability 34
      Choosing the Cloud service ............................................................................................. 34
      Data Quality ..................................................................................................................... 35
      Organizational Resistance ............................................................................................... 35
5.    Summary ........................................................................................................................ 35
References .............................................................................................................................. 37

                                                    LAMBDA Deliverable D2.1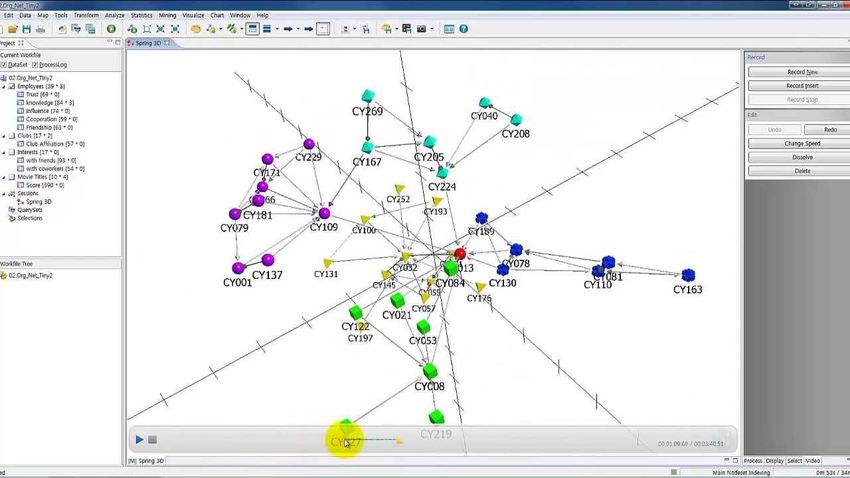
Page 5 of 43

Abbreviations and Acronyms

BDA                          Distributed Big Data Analytics
ARCH                         Big Data Architecture
R&D                          Research and Development
R&D&I                        Research and Development and Innovation
SSE                          South-East Europe Countries
IoT                          Internet of Things
SemTech                      Semantic Technologies
SWOT                         Strengths, Weaknesses, Opportunities and Threats.
VIS                          Visualization

List of Figures

Figure 1. The seven V's of Big Data ................................................................................................ 9
Figure 2. The general applications of Big Data .............................................................................. 10
Figure 3. Two basic types of scaling, source ................................................................................. 18
Figure 4. An example of a knowledge graph and how data derived from it can be represented,
source1 ......................................................................................................................................... 20
Figure 5. The knowledge base behind Dbpedia, source ................................................................ 20
Figure 6. Examples of JavaScript visualization tools, source1, source2, source3.......................... 28
Figure 7. Google charts interface, source ..................................................................................... 29
Figure 8. D3.js, TimelineJS and Plotly, source1, source2, source3 ............................................... 29
Figure 9. NetMiner, source ............................................................................................................ 30
Figure 10. GraphWiz, souce1, source2 ......................................................................................... 30
Figure 11. NodeXL, source ........................................................................................................... 31
Figure 12. Tableau and Infogram, source1, source2 ..................................................................... 31
Figure 13. The evolution of the Big Data landscape, source1, source2, source3, source4 ............ 36

List of Tables

Table 1. Big Data frameworks and their characteristics (Inoubli, Aridhi, Mezni, Maddouri, & Nguifo,
2018), (Oussous, Benjelloun, Lahcen, & Belfkih, 2018)................................................................. 17
Table 2. Big Data benchmarks, (Lachhab, Bakhouya, Ouladsine, & Essaadi, 2016) ..................... 24
Table 3. Systematization of regression and classificaiton learning algorithms in Big Data tools .... 26
Table 4. Systematization of clusterization learning algorithms in Big Data tools ............................ 27
Table 5. Big Data challenges and resolutions ............................................................................... 33

                                                     LAMBDA Deliverable D2.1
Page 6 of 43

1. Introduction
With one of the goals of the LAMBDA project (Learning, Applying, Multiplying Big Data Analytics)1
being the application and transfer of knowledge between institutions and also advancing the
general degree of education with the researchers and other staff of Institute Mihajlo Pupin2 which
would later be projected onto the neighbouring region and network of academic institutions in the
field of Big Data research and analysis, this report aims to summarize the current state of the art
solutions of the Big Data landscape.

In this deliverable, contemporary technological solutions from relevant research papers and articles
as well as frameworks and concepts that are applied in industrial applications are listed, described,
analysed and compared. With the amount of data being generated and processed growing on a
daily basis, the need for newer and faster answers to new technological barriers is rapidly
increasing and so the landscape of Big Data solutions is actively changing and evolving. This
report is set to capture the Big Data scenery in its current shape.

The remainder of this report is organized as follows: Section 2 elaborated on the background of Big
Data, gives its general definition, a brief historical overview and some attributes that are often used
when describing what Big Data is. Challenges regarding the development of Big Data solutions are
also listed as well as both general applications of Big Data and those relevant for Institute Mihajlo
Pupin. Moving on, Section 3 characterizes the current landscape of Big Data by analysing the most
popular frameworks used to handle the required amounts of data, gives an overview of database
management solutions stemming from some of the challenges posed by Big Data and outlines how
knowledge can be extracted from those data stores by using graphs and relational structures, lists
and describes stream processing engines, outlines pre-processing required for proper analytics on
Big Data as well as explaining how analytics can be performed. Finally, Section 3 closes with
comparing different software solutions for data visualization. At the end, Section 4 finalizes the
discussion with general remarks about the Big Data landscape.

1
    http://www.project-lambda.org/
2
    http://www.pupin.rs/

                                     LAMBDA Deliverable D2.1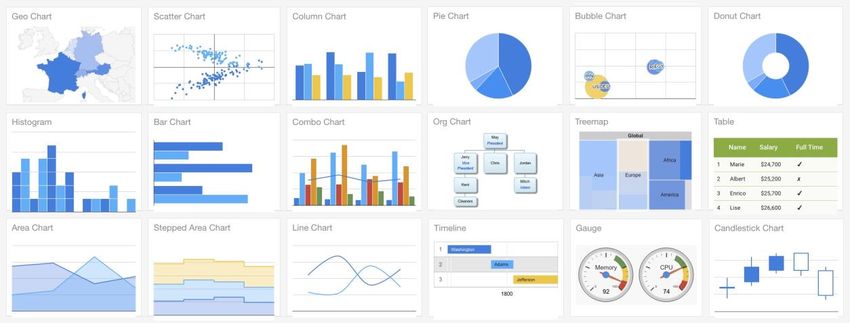
Page 7 of 43
2. Background
2.1 Big Data Definition and History
Big Data has recently become more used as a buzzword than a precisely determined scientific
object or phenomena. Having a wide variety of uses and many different sorts of applications and
implementations further increases the difficulty of pinning down what Big Data actually is.
Nevertheless, even though Big Data has no formal single definition, in general it can refer to
volumes of data that cannot be (efficiently) processed by conventional data management methods
and storage systems or, more precisely, it is sometimes used to describe large datasets with sizes
in the range of exabytes (1e18 bytes) and greater. Such large streams of data are becoming more
and more common with analogue technologies slowly being phased out and replaced with digital
solutions that can hugely benefit from storing recorded data, performing analysis on that data and
information (often also referred to as knowledge) being inferred from it. Processing such high
volumes poses a challenge even for the modern day IT infrastructure and establishment and so
innovative architectures and handling methods needed to be developed to facilitate the heavy
process of Big Data management.
The history of Big Data could be linked back to the 20th century or more precisely to 1937 when
social security was introduced in the United States of America and the requirement arose for data
management of 26 million residents. This job was handed to IBM who developed a punch card
machines for reading data. Around twenty years later, during World War II, a quick (for that day
and age) pattern recognition system was used by the British to extract intelligence from intercepted
messages at a rate of five thousand characters per second. Data analytics was continued during
the Cold War with the American National Security Agency hiring around twelve thousand
cryptologists to facilitate the knowledge discovery demand. The first data center in the world was
planned in 1965 to store tax returns and fingerprint records which were meant to be later converted
to magnetic tapes but this project was later scrapped due to the controversies that it generated.
The invention of the World Wide Web in 1989 must also be mentioned as a significant date as it is
the source of data with the most presence today and is used as the main means of data exchange.
A few years later, supercomputer concepts started to emerge, with promising processing power
outlooks. With the start of the 21st century, promising new technologies started to arise like the
Google File System in 2003 (Ghemawat, Gobioff, & Leung, 2003) and the introduction of
MapReduce in 2004 (Dean & Ghemawat, 2014) that is still being used today for distributed
processing. 2005 and 2006 saw the start of development on Hadoop which came into production in
2008 (Shvachko, Kuang, & Radia, 2010). Following this, Yahoo released Pig (Olston, Reed,
Srivastava, Kumar, & Tomkins, 2008) and Facebook created Hive in 2009, with S4 (Chauhan,
Chowdhury, & Makaroff, 2012) and Flume released in the following year. 2011 marked the start of
real time as opposed to batch processing with Storm (Surshanov, 2015) and Spark (Zaharia,
Chowdhury, Franklin, Shenker, & Stoica, 2010) being released that year. 2012 saw the creation of
Kafka by LinkedIn (Kreps, 2011) and the definition of the Lambda architecture for efficient Big Data
processing with 2013 giving as Samza by LinkedIn and Flink (Friedman & Tzoumas, 2016) and the
Kappa architecture being defined in 2014. This year also marked the beginning of hybrid data
processing with 2015 giving us Cloudera Kudu and Google’s Beam. The Big Data paradigm has
definitely caught on with many research projects funded by various institutions already finished
(Big Data Europe, SANSA, etc.) and even more currently ongoing with promising new results like
the Vadalog System for Knowledge Graphs developed by the University of Oxford within the VADA
(Value Added Data Systems) research programme (Bellomarini, Gottlob, & Sallinger, 2018).
When the concept of Big Data was originally introduced, its main characteristics were depicted
using the so-called 3V’s of Big Data being (Doug, 2011), (Lakshen, Vraneš, & Janev, 2016):
Volume - the sheer amount of data being created from various sources like medical data,
research studies, web pages, text documents, audio and video media, meteorological data,
LAMBDA Deliverable D2.1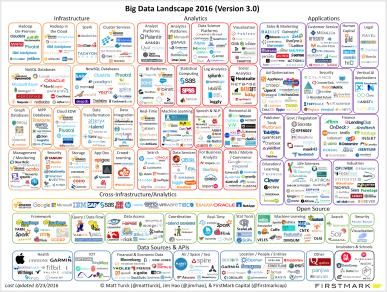
Page 8 of 43
government records and so on. For example, statistical data states that several hundred
hours of video material are being uploaded to YouTube every minute. With region-
dependant regulatory standards banning certain types of content, this data must be
somehow processed. However, human processing is not possible at this scale due to the
high volume of data, and therefore sophisticated solutions like machine learning must be
employed. Similar problems also exist with other user-generated digital content like
photographs with over a trillion taken yearly.
Velocity - the rate at which data is being created, refreshed or renewed, resulting in high
volumes mentioned previously. Examples of this behaviour can be found in social network
posts, search engine queries and so on.
Variety - the differences in structure of the data input to the system. Architectures based on
big data have to be capable of processing heterogeneous data that can be both structured
and unstructured. Some architectures were even developed to handle semi-structured data
as an intermediary solution. Obviously, data encoded in mark-up languages, database
dumps, sensor data, documents, photographs, videos and audio data are all differently
formatted but must be processed by a unified system somehow.
More recent studies have identified more V’s forming up to 5V’s of Big Data with the addition of
(Kalbandi & Anuradha, 2015):
Veracity - the truthfulness or uncertainty of the data. Modern day data processing tools can
generally benefit from having vast amounts of data like for example in machine learning
training algorithms. However, this data must be trusted in order to be used and for the
derived result to be considered valid. Knowing and trusting the source of the data collection,
the assurance that no data classes are underrepresented or that if they are that is properly
documented, that all the data is collected in equal conditions, that the correct methodology
was in place when collecting data and similar questions should be posed in order to
eliminate veracity problems that may plague the data.
Value - the end result, or simply information derived from raw Big Data. This is arguably
one of the most important V’s from this list as it is considered the goal of any alike data
processing techniques especially having in mind that using Big Data involves significant
technological and infrastructural improvements over traditional simple data processing
structures. Whether it be pattern recognition, customer behaviour analysis, product
placement, accelerating business, credit or insurance rankings, being able to find value in
Big Data is considered the key for even considering the possibility of using solutions based
on Big Data. Since Big Data is generally employed by business on large scales, the value
extracted must surpass the investment and maintenance costs for it to be a viable option. In
order to achieve this, efficient storage solutions, analytical programs and consumer friendly
result displaying applications must be used.
Moreover, this list can be supplemented with two additional V’s further extending the
characterization of Big Data with 7V’s, as depicted in Figure 1 (Khan, Uddin, & Gupta, 2014):
Validity - how suitable the selected data is for the application at hand. Although validity is
very similar to veracity, with the two often getting mixed up and used interchangeably,
validity only considers if the selected dataset that is collected or processed is accurate and
correct in the context of intended usage. Examples in literature mention a case where a
doctor has to make a decision about patient treatment based on clinical trials, but poses a
question whether he should trust the raw data before validating it. Alike problems should be
of no surprise given the fact that most of the data scientist’s time is usually occupied by
cleaning and filtering the data for the specific use cases that are to be examined.
Volatility - the temporal validity of the data. A volatile set of data is a set which can be
considered no longer significant, irrelevant or historic after a set amount of time has passed.
Although in the sphere of traditional database solutions, “never delete data” was a guideline
that could often be heard, a question should be posed whether and after how long can a
LAMBDA Deliverable D2.1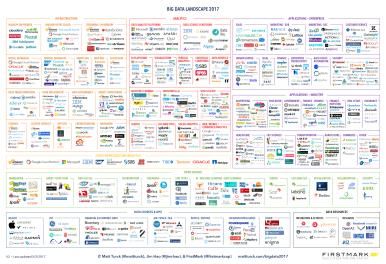
Page 9 of 43
piece of stored data be ignored or removed. With various new volumes of data being
created with high velocity in every second, having a constant stream of relevant data
replacing outdated old entries is crucial to maintaining the system.
Figure 1. The seven V's of Big Data
Finally, related literature (Khan, et al., 2018) also suggests expanding the mentioned 7V’s to 10V’s
by adding
Visualization - how to display the gathered information obtained from Big Data processing.
Traditional means of showcasing information are of no use in this regard because of the
large amount and diversity associated with Big Data that reach over the limits of in-memory
technologies used in established applications. Two main problems are attached with Big
Data visualization: How to adequately represent the data in a user-friendly way and what
resources and technologies are necessary. Render times and scalability must also be
considered when going beyond the familiar depiction of data by using 2D graphs, charts
and so on. The software tools used in this regard range from pure scientific statistical
computing platforms like Matlab, Octave, Python, R that deal well with increasing volumes
of data and are good for raw data visualization to Business oriented solutions like Tableau
or JupytR that tackle high variety and inherently more informative than just displaying data
(Caldarola & Rinaldi, 2017).
Vulnerability - the security issues attached to Big Data. Just possessing the huge amounts
of data required for running Big Data analytical solutions puts a business at a high risk
because it must uphold the privacy standards and protect the data from leaks, theft and
misuse. With the contemporary paradigm of software users actually being products
meaning that the information gathered by the software during use is later applied for
optimizing advertising engines, giving better predictions or outright sold in an anonymized
form, all of our personal information that we easily put up online may be at risk from
hackers and thieves. Even though the major software companies state that all information
is kept confidential and/or encrypted, database attacks and unauthorised data access are
slowly becoming commonplace leading to personal information being sold on the dark web.
When discussing this topic, the “Cambridge Analytica data scandal” comes to mind where
Cambridge Analytica had collected personal information that would later be used for
political agendas from millions of Facebook users without their consent. However,
unintentional data breaches are also a major problem with series upon series of emails and
passwords often being exposed from various online platforms.
Variability - the inconsistency with the data. Variability is often used to refer to changing
the meaning of data which is especially important when considering language processing
application since the meanings of words strongly depend on the context. Variability is also
found to refer to outliers and anomalies in the data. This variability can be attributed to the
differences in data sources and types. Variability is sometimes even used to describe
inconsistencies with speeds of Big Data streaming in databases.
When researching this topic from different sources, it can be observed that authors often substitute
one or more of these terms with others of which some may not even be mentioned in this
LAMBDA Deliverable D2.1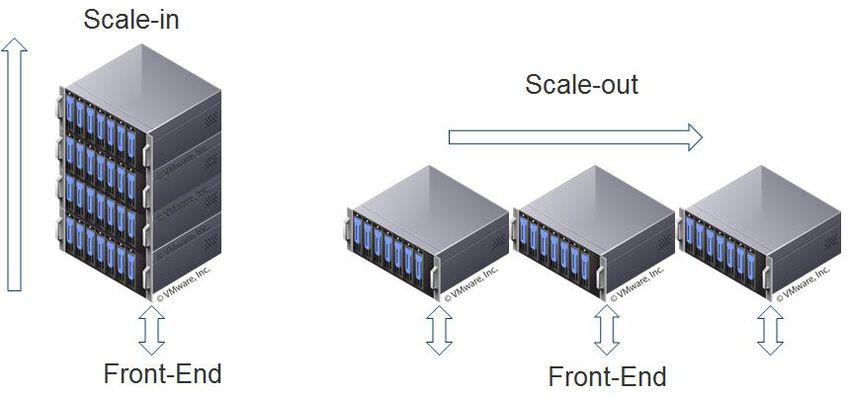
Page 10 of 43
enumeration. Also, heated discussions within the scientific community are currently in progress
with the goal of determining the most crucial out of these characteristics with some even offering
just value as the core concept that should be focused on. Nevertheless, some authors have even
extended the Big Data characterization to more than ten V’s (Panimalar, Shree, & Kathrine, 2017).
Several of those also mentioned are: virality (describing the spreading speed of the data or the
rate at which it is circulated between users or through a network), viscosity (the temporal
incompatibility between sequential events or rather the time difference between an event
happening and being recorded, also referred to as the resistance to the flow of data), venue (the
variety in platforms that can be used to generate data that may result in problems with
interoperability), vocabulary (differences in the way the data is structured), vagueness
(usefulness or the amount of information that can be extracted from the data), verbosity
(redundant storage of data that can lead to confusion and errors), voluntariness (the application
of big data in an open nature to provide improvements to general human well-being, not just being
business and profit oriented but also aiding healthcare institutions, public services etc.) and
versatility (the flexibility and diversity deeply rooted within Big Data allowing it to be used in a wide
range of applications).

Nevertheless, when discussing Big Data, regardless of how many V’s are considered to describe it,
it is clear the Big Data implementation have a wide variety of inherent obstacles that require well
architected solutions in all aspects from data storage, management, processing, analysis and
presentation.

   2.2 Big Data Applications in General

                           Figure 2. The general applications of Big Data

Having such a broad definition and a general idea behind it, Big Data has almost as broad of a
scope of applications where it can be put to use and an even broader set of positive outcomes that
can be achieved using it. This concept was, just like many other contemporary solutions used
every day, originally developed as a software engineering paradigm, but has, relatively quickly,

                                      LAMBDA Deliverable D2.1
Page 11 of 43
found its way into a wide variety of applications with the possibility of basically every part of daily
life being covered by one of them.
Big Data applications can be easily found in different industries, as depicted in Figure 2. First of all,
the healthcare and pharmaceutical industries can hugely benefit by collecting and processing
the immense amounts of data that is generated every hour in those branches. At the most
rudimentary level, the data collected by modern healthcare applications like Apple Health, Google
Health or Samsung Health (previously SHealth) just to name a few, that almost every smartphone
possesses, is huge by its quantity but also insightful. The main benefit of using such applications is
that, with the adequate permissions by the user, the collection of data is automated meaning there
is no need for tedious data labelling which plagues many potential sources of useful information. In
general, the data obtained by wireless body area networks (WBANs) can be hugely beneficial in
this regard when correctly processed. Furthermore, professionally collected data based on clinical
trials, patient records, various test results and other similar data can be, or rather already is in
some cases, stored, processed and analysed in order to improve the effectiveness of medical
institutions and aid doctors with their difficult task of decision making. Advanced data management
in this field can also improve patient care with better prescription recommendations and
optimizations can be applied to the drug supply chain, in turn, cutting losses and increasing
efficiency. The pharmaceutical industry employing Big Data can also design targeted ad
campaigns to boost sales. Discovering disease patterns and making predictions is also made
easier and, not to mention, the potential of an early epidemic and pandemic detection. (Das,
Rautaray, & Pandey, 2018) outlines the general potential uses of Big Data in medicine like heart
attack prediction, brain disease prediction, diagnosis of chronic kidney disease, analysing specific
disease data, tuberculosis prediction, early hearth stage detection, HIV/AIDS prediction and some
general aspects like disease outbreak and disease outcome prediction. (Lee & Yoon, 2017)
discusses some technical aspects of big data applications in medicine like missing value, the
effects of high dimensionality, and bias control. (Ristevski & Chen, 2018) mention privacy and
security on the topic of Big Data in healthcare, while (Shah, Li, & Shah, 2017) talks about
integrating raw medical data in to the deduction process and (Tafti, Behravesh, & Assefi, 2017)
offers an open source toolkit for biomedical sentence classification. Modern concepts relating to
mobile health are discussed in (Istepanian & Al-Anzi, 2018) with (Bayne, 2018) exploring Big Data
in neonatal health care.
The financial and insurance sector can also be a great host for Big Data implementations. With
the current state of the worldwide economy, bank loans and credits have become mundane
everyday occurrences with money lenders and investors having a constant requirement for risk
analysis and management and credit default predictions when working. As this industry generally
adopts new technologies early on, there is no shortage of digital data regarding both historical
proceedings and new streams of information collected from ongoing transactions happening every
second. Performing inference on this data is the key for detecting fraud and security vulnerabilities
with many banks already using machine learning techniques for assessing whether or not a
potential borrower is eligible for a loan, what his credit card limit should be etc. Credit rating is
applied for all sorts of potential users, ranging from natural persons to entire countries and thus
different granularity of data should be considered based on the level of classification that is to be
made. Furthermore, novel approaches state that the applied machine learning can be
supplemented with semantic knowledge thus improving the requested predictions and
classifications and enriching them with reasoning explanations that pure machine learning based
deduction lacks (Bellomarini, Gottlob, Piris, & Sallinger, 2017). The stock market is also a
considerable use case for big data as the sheer volume and frequency of transactions slowly
renders traditional processing solutions and computation methods obsolete. Finding patterns and
surveilling this fast-paced process is key for proper optimization and scam prevention. (Gutierrez,
2017) offers a general guide for applying Big Data in finance and (Bataev, 2018) analysing relevant
technologies. (Hasan, Kalıpsız, & Akyokuş, 2017), (Huang, Chen, & Hsu, 2016) offer concrete
approaches like predicting market conditions by deep learning and applying market profile theory
LAMBDA Deliverable D2.1Page 12 of 43
with (Tian, Han, Wang, Lu, & Zhan, 2015) discussing latency critical applications, (Begenau,
Farboodi, & Veldkamp, 2018) looking at the link between Big Data and corporate growth and
(Óskarsdóttir, Bravo, Sarraute, Vanthienen, & Baesens, 2019) placing an emphasis on data
collected from social networks and mobile phones.
When considering Big Data applications, one cannot overlook the massive impact that the
development of social networks like Facebook and Twitter had on this field of research with some
of those companies even driving new innovation and playing a major role in this field. Social
networks provide a source of personalized Big Data suitable for data mining with several hundreds
of thousands of new posts being published every minute meanwhile being great platforms for
implementing big data solutions whether it be for advertising, search suggestions, post querying or
connection recommendations. The social network structure has also motivated researchers to
pursue alike architectures in the Big Data domain. From related literature, (Saleh, Tan, & Blake,
2013) and (Peng, Yu, & Mueller, 2018) address challenges in social networks that can be solved
with Big Data, (Persico, Pescapé, Picariello, & Sperlí, 2018) gives a performance evaluation of
Lambda and Kappa architectures and (Ghani, Hamid, Hashem, & Ahmed, 2018) classifying
analytics solutions in the Big Data social media domain.
Another industry where Big Data can easily find its place are world wide web, digital media and
commerce. As with all services available to end users, the wide variety of online shopping web
sites also presents a continuous source of huge volumes of data that can be stored, processed,
analysed and inferred on creating recommendation engines with predictive analytics. As a means
to increase user engagement, multi-channel and cross-channel marketing and analysis are
performed to optimize product presence in the media fed to the user. It is no accident that a certain
advertisement has started to show right after the user has searched for that specific product
category that the advertised product belongs to. Examining user behaviour patterns and
tendencies allows for offer categorization in the best possible way so that the right offer is
presented precisely when it needs to be and thus maximizing sale conversions. Data received from
Big Data analysis can also be used to govern product campaigns and loyalty programs. However,
content recommendations (inferred from Big Data sources) in this domain are not only related to
marketing and sales, but are also used for proper display of information relating to the user. Some
search engines companies have even publicly stated that their infrastructure relies on Big Data
architecture which is not surprising considering the amount of data that needs to be processed.
Paper (Sun, Gao, & Xi, 2014) presents an application of widely spread recommendation systems
of contemporary e-commerce systems to more traditional non e-commerce systems, (Li & Huang,
2017) talks about collaborative filtering for offer recommendation, (Shi & Wang, 2018) discusses
business analytics and (Wu & Lin, Unstructured big data analytics for retrieving e-commerce
logistics knowledge, 2018) generate logistical strategies from two theories: resource dependency
and innovation diffusion.
Following the already mentioned impact of using smart mobile phones as data sources, the
telecommunication industry must also be considered when discussing Big Data. Mobile,
television and internet service providers have customer retention as their core interest in order to
maintain a sustainable business. Therefore, in order to prevent customer churn, behaviour patterns
are analysed in order to provide predictions on customers looking to switch their provider and allow
the company to act in time and offer various incentives or contract benefits in due time. Also,
besides this business aspect, telecommunication companies using Big Data analytic solutions on
data collected from mobile users can use the information generated in this way to assess problems
with their network and perform optimizations thus improving the quality of their service. Since
almost all modern mobile phones rely on wireless 4G (and 5G in the years to follow) networks to
communicate when their users are not at home or work, all communication is passed through the
data provider’s services, and in processing this data still lie many useful bits of information as only
time will tell what useful applications are yet to be discovered. Papers covering this aspect include
(Yazti & Krishnaswamy, 2014) and (He, Yu, & Zhao, 2016) outlining mobile Big Data analytics
LAMBDA Deliverable D2.1Page 13 of 43
while (Amin, et al., 2019) talks about preventing and predicting the mentioned phenomena of
customer churn and (Liu, McGree, Ge, & Xie, 2016) talks about collecting data from mobile (phone
and wearable) devices.
One of the most stressful and time consuming activities in modern everyday life is probably
transportation. The cities we live in, especially in Europe, were usually built more than a few
hundreds of years ago, when their population was only a fraction of what it is today and when
owning your own means of transportation was not so common. The urbanization has taken its toll
with many governments not being able to cope with the exponentially increasing number of
vehicles on their roads, and large infrastructure projects generally lagging behind the increasing
traffic volumes. This problem is not only present on our roads but also in flying corridors all across
the world. With shipping from distant locations getting cheaper by the day, it is no wonder that the
air traffic volume is also increasing at a very high rate. In the status quo, a question is posed if the
traffic flow can somehow be optimized to shorten travel times, cut costs and increase logistical
performances of modern day delivery systems. One of the readily available solutions to this
problem is the navigation/routing program that modern day mapping applications provide. Using
the Global Positioning System (GPS) data, usually from a large number of smartphone users, the
routing system can decide in real time not only the shortest but also the fastest route between two
desired points. Some applications like Waze rely on direct user inputs in order to locate closed off
streets, speed traps etc. but at its most rudimentary level, this approach can work with just raw
GPS data, calculating average travel times per street segments, and thus forming a live congestion
map. Of course, such a system would be of no benefit to end users if it were not precise, but since
the aggregated results that are finally presented are obtained based on many different sources,
classifying this as a Big Data problem, the data uncertainty is averaged out, and an accurate result
can be output. Self-driving cars also rely on vast amounts of data that is constantly being provided
by its users and used for training the algorithms governing the vehicle in auto-pilot mode. Holding
on to the automation aspect, Big Data processing in the transportation domain could even be used
to govern traffic light scheduling which would have a significant impact on this sector, at least until
all vehicles become autonomous and traffic lights are no longer required. Furthermore, the
transportation domain can be optimized using adequate planning obtained from models with data
originating from user behaviour analysis. Ticketing systems in countries with high population
density or frequent travellers where reservations have to be made, sometimes, a few months in
advance, rely on machine learning algorithms for predictions governing prices and availability.
Patterns discovered from toll collecting stations and border crossings can be of huge importance
when planning trip durations and optimizing the selected route. The collection of related articles to
this topic is possibly the largest of all applications. (Zhang, Jia, & Ma, 2018) offers a methodology
for fare reduction in modern traffic congested cities, (Liu D. , 2018) discuss Internet-of-Vehicles,
(Grant-Muller, Hodgson, & Malleson, 2017) talks about the impacts that the data extracted from the
transport domain has on other spheres, (Wu & Chen, Big data analytics for transport systems to
achieve environmental sustainability, 2017) mention environmental effects, (Torre-Bastida, Del Ser,
& Laña, 2018) talk about recent advances and challenges of modern Big Data applications in the
transportation domain while (Imawan & Kwon, 2015) analyses the important concept of
visualization in road traffic applications. Also related, (Ghofrani, He, Goverde, & Liu, 2018) surveys
Big Data applications for railways, (Zeyu, Shuiping, Mingduan, Yongqiang, & Yi, 2017) and (Gohar,
Muzammal, & Ur Rahman, 2018) discuss data driven modelling in intelligent transportation
systems and (Wang, Li, Zhou, Wang, & Nedjah, 2016) attempts fuzzy control applications in this
domain.
An unavoidable topic when discussing Big Data applications, in general, is the Internet of Things
(IoT) and home automation. As modern sensing equipment is capable of running at second and
sub-second sample periods, the sheer volume of data being generated by smart home devices
today is already inconceivable, and will only exponentially grow as more residents adopt these new
technologies and they become more commonplace. Home automation solutions based on this data
must be capable of proper processing and providing accurate predictions as not to interfere with
LAMBDA Deliverable D2.1Page 14 of 43
our daily routines but rather be helpful and truly save time. These solutions can also offer energy
saving recommendations, present optimal device scheduling to maximize comfort and minimize
costs, and can even be extended from the operation aspect to planning and offer possible home
adjustments or suggest investments in renewable sources if the location being considered is
deemed fit. Having smart appliances initially presented the concept of human-to-machine
communication but, governed by Big Data processing, this concept is further popularized with
machine-to-machine communication where the human input is removed resulting in less
interference. Predictive maintenance and automatic fault detection can also be obtained from
sensor data for both basic household appliances and larger mechanical systems like cars, motors,
generators etc. IoT applications require proper cloud frameworks as discussed in (Wang & Ranjan,
2015), with related challenges depicted in (Kaul & Goudar, 2016). (Ge, Bangui, & Buhnova, 2018)
presents a comprehensive survey of Big Data applications in the IoT sphere, (Ahmed, et al., 2017)
talks about analytics, (Martis, Gurupur, Lin, Islam, & Fernandes, 2018) introduce machine learning
to the mix. (Kumari, et al., 2018) also gives a survey but with a main focus on multimedia and
(Kobusińska, Leung, Hsu, Raghavendra, & Chang, 2018) talks about current trends and issues.
Public utilities can also rely on Big Data to improve their services. Advanced water supply system
with proper flow sensing equipment can, in real time, detect leakages or illegal connections. These
types of problems also plague communities with district heating systems where hot water is
supplied to end users for heating through a pipeline. Especially in winter, when hazardous
situations on these supply systems like leakages or pipe malfunctions are common, whole
neighbourhoods to be cut off from the heating supply for several days and weeks until the problem
is fixed. Therefore, having good predictive capabilities and quick fault detection is key for
maintaining a stable system. Smart grids are also often mentioned as good cases for Big Data
implementations as the national electric power supply depends on the good grid infrastructure.
Having proper metering equipment and sensors can allow for quick and easy interventions if need
be but also provide with key insight on load distribution and profiles required by plant operators for
sustaining system stability. Predictive maintenance also plays a key role in smart grid upkeep since
all of its segments are both critical and expensive, and any unplanned action cuts users from the
electricity supply upon which almost all modern device rely to function. (Zohrevand, Glasser, &
Shahir, 2016) talks about the application of Hidden Markov models for problem detection in
systems for water supply, (Bharat, Shubham, & Jagdish, 2017) also discussing smart water
systems while (Ku, Park, & Choi, 2017) analyses microgrid IoT applications. Related IoT
applications regarding water supply are found in (Koo, Piratla, & Matthews, 2015), while, on the
other hand (Tu, He, Shuai, & Jiang, 2017) reviews issues with Big Data implementations in smart
grids and finally (Munshi & Mohamed, 2017) and (Phan & Chen, 2017) talking about analytics and
monitoring for smart grids.
Another important branch where Big Data can be made use of is education. Performing analytics
on past records of student performance where huge information volumes are available to allow
precise predictions of future results, easier selection of favourite subjects and curriculum activities.
With each pupil leaving a significant trail of relevant information during his education process, this
field of application offers vast potential. In close relation are career prediction solutions that can aid
and guide students when making very important life-changing decisions regarding university
selection, study programs etc. Customized learning is especially discussed in online and distance
learning applications because of the inherently digital nature of related data. Also, Big Data
processing is used to reduce dropouts. The appeal of Big Data in education is shown in research
papers on this topic where (Matsebula & Mnkandla, 2017) discusses analytics for higher education,
(Li, Li, & Zhu, 2017) quality monitoring and evaluation, (Nelson & Pouchard, 2017) a modular
curriculum, (Liang, Yang, & Wu, 2016) dropout prediction, (Yu, Yang, & Feng, 2017) online
education and (Qiu, Huang, & Patel, 2015) specially focuses on assessing higher education in the
USA. On the other hand, (Schwerdtle & Bonnamy, 2017) focuses on nurse education, (Pardos,
2017) talks about sources of Big Data in education and models for standardized tests, (Li & Zhai,
2018) offers a review of modern Big Data in education, (Santoso & Yulia, 2017) focus specifically
LAMBDA Deliverable D2.1Page 15 of 43
on data warehouses and (Olayinka, Kekeh, Sheth-Chandra, & Akpinar-Elci, 2017) goes back to
health education applications
Finally, Big Data can also be employed in both government and political services. Data mining in
this regard are often used to infer political trends and general attitude of the population. Some
countries even practice deriving legislation from principles recommended and voted by individual
citizens. On the other hand, analysis can also be performed in order to predict potential crime sites
with risk-terrain modelling and pre-emptively inform police on problematic regions. Similar
techniques can also be applied to traffic, determining dangerous road sections causing frequent
accidents. Interoperability between different government agencies is also mentioned as an
example of a system that can be accelerated by using Big Data as readily available data can save
substantial amounts of time when data querying. Concrete work on this topic is done by (Aron,
Niemann, & ., 2014) giving best practices in governments, (Yan, 2018) gives a general perspective
of Big Data applications in this field, (Sixin, Yayuan, & Jiang, 2017) focuses on ecological
environment in China, (Hardy & Maurushat, 2017) talks about driving innovation by opening data
up in the public domain and (Jun & Chung, 2016) examines electronic governance in Korea.
LAMBDA Deliverable D2.1Page 16 of 43
3. Landscape
3.1 Big Data Frameworks
Ever since its introduction back in 2008, the Hadoop system currently supported by Apache has
basically become the standard framework for Big Data implementations. This can mainly be
attributed to its reliability, robustness, high scalability potential and parallelism. Also, a thing to note
is that Hadoop can run on distributed commodity hardware of different sources, and so
significantly decreasing costs of eventual system upgrades and maintenance. This framework was
much quicker than traditional solutions because it was able to quickly process extremely large
datasets since operations could be executed locally, on machines where the data is stored,
contrary to the standard solutions that had to copy the entire datasets into the main processor
memory. Hadoop introduced fault-tolerance to overcome failures which are a common occurrence
in distributed systems through replicating data amongst different nodes further supplementing its
quick nature. Hadoop relies on its file system, HDFS, and the MapReduce processing method in
order to work properly. HDFS, as a high-latency master-slave batch processing system, was
designed for huge volumes of data and thus supports clusters with hundreds of nodes with resilent
interoperability between distributed heterogeneous hardware. The MapReduce programming
model, on the other hand, presents the idea of splitting input data into distinct patches, processing
them (assigning values in key-value pairs), reordering data and finally merging it in a two-step
process with steps called mapping and reducing, resulting in the given name. Solutions like YARN
for cluster managing and HBase (which will also be discussed later in this report) for database
management are often associated with Hadoop. These solutions often include their own libraries
for performing inference on the data (like machine learning) and HBase is no exception with
support for Mahout. Frameworks for Big Data applications also worth mentioning are Apache
Spark, Storm, Samza and Flink, summarized in Table 1. All of the mentioned frameworks, like
Hadoop, are open source, they generally support Java and are HDFS.
Streaming solutions mentioned in Table 1 offer lower-latency processing for quicker results with
Spark being a hundred times faster than Hadoop in some applications but in turn consuming more
memory. The intrinsic concept in Spark making this possible is its resilient (fault-tolerant)
distributed (data spread across nodes in a cluster) dataset (partitioned data) (RDD) supporting two
basic operations called transformations (creation of new RDDs from existing ones) and actions
(final RDDs computation). Some Spark APIs worth mentioning are SparkCore, SparkStreaming,
SparkSQL, SparkMLLib and GraphX. Spark and Flink share similarities in efficient processing in
graph-like structured Big Data and are both enriched with APIs for machine learning, predictive and
graph stream analysis. As working with heterogeneous data is a top priority, Hadoop, Storm and
Flink all use key-value pairs when representing data and all five frameworks assume a cluster
architecture whilst having specific cluster managers per architecture.
Storm is a fast, streaming, real time suitable framework designed to work with both structured and
unstructured data. The arrangement of a Storm structure can be described as a directed acyclic
graph with nodes defined as either spouts (data sources) or bolts (operations that should be
performed). Since bolts are distributed across multiple nodes in Storm, parallel processing can be
achieved. Samza was also conceived as a fast streaming real-time ready processing platform that
was intended for use in data ingestion, tracking and service logging with the ability to operate on
large messages and offer persistence capabilities for them. Kafka and YARN are used within
Samza to facilitate its operation. Samza is often referred to as a three layered structure with the
first layer designated for data streaming employing Kafka, the second managing resources with
YARN and the third in charge of processing. Finally, Flink allows for both batch and stream
processing with a similar programming model to MapReduce but with Flink offering advanced
operations like join, aggregate and filter. Its machine learning library, FlinkML gives an ability of
efficient and scalable processing of high data volumes. Similar to aforementioned frameworks,
LAMBDA Deliverable D2.1Page 17 of 43
Flink uses a DAG structure representing submitted jobs and after processing those jobs, requests
are passed on to lower levels housing cluster managers and storage controllers.
On top of mentioned frameworks, novel solutions are being developed, such as SANSA (Semantic
Analytic Stack) (Lehmann, et al., 2017) based on Spark and Flink, which is a Big Data engine that
incorporates the processing and analytics tools best suited for RDF data. It offers easy integration
with other solutions and a variety of features through the inclusion of a native RDF read/write,
query, inference and machine learning libraries.
Table 1. Big Data frameworks and their characteristics (Inoubli, Aridhi, Mezni, Maddouri, & Nguifo,
2018), (Oussous, Benjelloun, Lahcen, & Belfkih, 2018)
Hadoop Spark Storm Samza Flink
Foundation Apache UC Berkeley BackType, LinkedIn Apache
Software Twitter Software
Foundation Foundation
Supported Java Java, Any Java Java
language Python, R,
Scala
Data sources HDFS HDFS, HDFS, Kafka, Kafka
DBMS and HBase and Kinesis
Kafka Kafka
Execution batch batch, streaming streaming batch,
model streaming streaming
Programmin Map and Transformati Topology Transformati Map and
g model Reduce on and on Reduce
Action
Cluster YARN Standalone, YARN or Zookeeper YARN
menager YARN and Zookeeper
Mesos
Machine Mahout SparkMLib SAMOA API FlinkML SAMOA API
learning
compatibility
Fault Duplication Recovery Checkpoints Checkpoints Data
tolerance feature technique on partitioning
RDD objects
Operating Cross- Windows, Cross- Cross- Cross-
system platforms macOS, platforms platforms platforms
Linux
3.2 NoSQL Platforms and Knowledge Graphs
As was previously mentioned, Big Data usually involves simultaneous processing of
heterogeneous data from a variety of different sources, and thus that data generally differs both
LAMBDA Deliverable D2.1Page 18 of 43
from source to source and in time. Having a structured, semi-structured and not structured at all
datasets as a deluge of data formats that needs to be worked on in high volume and rate requires
the use of advanced, flexible and scalable solutions.
To adequately answer the requests for data organization posed by the Big Data paradigm,
traditional relational database management systems (RDBMS) are usually replaced by modern
NoSQL solutions. Although sometimes misused as an acronym for systems having (absolutely) no
SQL in processing, NoSQL is actually an abbreviation of “not only SQL” meaning that NoSQL
systems actually sometimes employ SQL but supplement it by other technologies. These
technologies, outlined in (Patel, 2016) and (Leavitt, 2010) can be more accurately referred to as
non-relational databases (as opposed to RBDMS) because they omit the use of tables as a means
for data storage in the traditional way and such solutions offer flexible environments that can be
used for Big Data and real-time applications. Note that a recent trend in systems traditionally
known as NoSQL systems has started that adds SQL support for such systems.
Being able to work with a variety of data models in NoSQL means that there is no predefined
schema for structuring data, no tables and columns need to be defined, and in some cases,
NoSQL can even work with completely dynamic data with its structure constantly changing. One of
the most important advantages of NoSQL over RDBMS is the ability of horizontal (outward) scaling
as opposed to vertical (inward) with the differences illustrated in Figure 1. RBDMS requires many
more local resources leading to larger higher limitation and costs, while NoSQL is more optimized
for distributed computing on distant nodes or computer clusters. The join operation, essential to
RBDMS is very slow and difficult to perform across distributed networks. This difference in scaling
is especially important in discussed applications because the volume of data is constantly
increasing. Furthermore, RBDMS can result in highly complex, large and slow to process
structures when the data that needs to be stored is not natively in the appropriate format because
of the conversions that need to be applied. SQL itself can also sometimes be considered an issue
because, although its structure can be very efficient in highly structured data applications, it is
considered far too rigid for the flexibility required for Big Data. NoSQL also allows for flexible fault
tolerance policies that sometimes put speed ahead of consistency while the traditional RBDMS are
inherently ACID complaint and all queries and requests must be processed in their entirety and
without errors before a result is displayed to the user.
NoSQL database solutions can be categorized according to their data storage types, as is given in
(Corbellini, Mateos, Zunino, Godoy, & Schiaffino, 2017). The first is the key-value category where
related literature places Hazelcast, Redis, Membase/Couchbase, Riak, Voldemort and
Infinispan. Another approach is the wide-column format where Apache HBase, Hypertable and
Apache Cassandra are classified. Data can also be saved in a document-oriented manner where
MongoDB, Apache CouchDB, Terrastore and RavenDB cover most of the market share. Finally,
NoSQL databases can be graph-oriented like in, for example, Neo4J, InfiniteGraph, InfoGrid,
LAMBDA Deliverable D2.1
Figure 3. Two basic types of scaling, sourceYou can also read