2018 Central Okanagan Economic Profile - Westbank First Nation
←
→
Page content transcription
If your browser does not render page correctly, please read the page content below

2018 Central Okanagan Economic Profile

Table of Contents

   Executive Summary........................................................................................................1

   The Central Okanagan...................................................................................................1
        Statistics Reporting............................................................................................................. 2

   Demographics................................................................................................................3
       Population and Distribution.............................................................................................3
       Age Distribution....................................................................................................................4
       Population Growth Projections.......................................................................................6
       Aboriginal Population......................................................................................................... 7
       Migration..................................................................................................................................8
       Income Distribution.............................................................................................................8

   Labour Force and Education...................................................................................... 11
       Key Labour Force Statistics............................................................................................. 11
       Employment by Industry.................................................................................................. 11
       Labour Force by Occupation......................................................................................... 12
       Commuting Patterns......................................................................................................... 12
       Education Attainment....................................................................................................... 13
       Education by Subject........................................................................................................ 13

   Key Industries.............................................................................................................. 14
        Agriculture............................................................................................................................ 14
        Viticulture ............................................................................................................................. 15
        Agritourism........................................................................................................................... 18
        Tourism .................................................................................................................................. 19
        Aerospace / Manufacturing........................................................................................... 20
        Technology / Animation / Film.....................................................................................22
        Retail Trade.......................................................................................................................... 26

   Trade and Business.....................................................................................................27
        Access and Proximity to Markets.................................................................................27
        Business Counts..................................................................................................................27
        Firms by Industry Sector................................................................................................ 29

   Tax Incentives............................................................................................................. 30

   Infrastructure............................................................................................................... 31
         Transportation..................................................................................................................... 31
         Utilities................................................................................................................................... 32

   Life in the Okanagan...................................................................................................33
         Climate................................................................................................................................... 33
         Residential Real Estate.................................................................................................... 34
         Education...............................................................................................................................37
         Health..................................................................................................................................... 39
         Recreation............................................................................................................................ 39
         Cultural & Social Amenities...........................................................................................40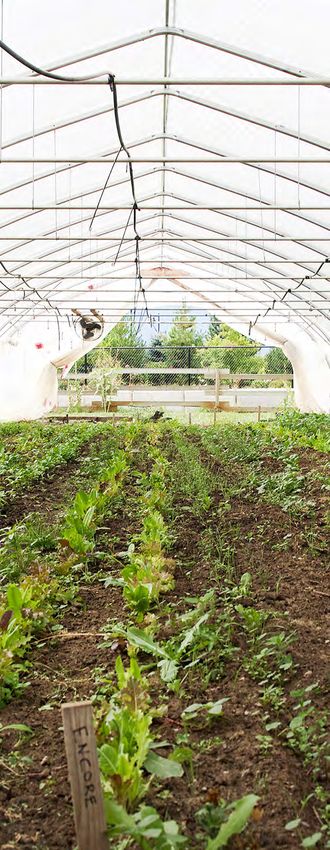
Our Thriving Communities........................................................................................ 42
     District of Lake Country.................................................................................................. 43
           Quick Facts................................................................................................................ 43
           Major Industries........................................................................................................ 43
           Community Infastructure..................................................................................... 43
           Doing Business in the Community....................................................................44

          City of Kelowna.................................................................................................................. 45
               Quick Facts................................................................................................................ 45
               Major Industries........................................................................................................ 45
               Community Infastructure..................................................................................... 45
               Doing Business in the Community.................................................................... 46

          Westbank First Nation..................................................................................................... 47
              Quick Facts................................................................................................................ 47
              Major Industries........................................................................................................ 47
              Community Infastructure..................................................................................... 47
              Doing Business in the Community.................................................................... 48

          City of West Kelowna....................................................................................................... 49
               Quick Facts................................................................................................................ 49
               Major Industries........................................................................................................ 49
               Community Infastructure..................................................................................... 49
               Doing Business in the Community.................................................................... 50

          District of Peachland......................................................................................................... 51
                Quick Facts................................................................................................................. 51
                Major Industries......................................................................................................... 51
                Community Infastructure...................................................................................... 51
                Doing Business in the Community.................................................................... 52

          Central Okanagan Electoral Area - East................................................................... 53
              Quick Facts................................................................................................................ 53
              Major Industries........................................................................................................ 53
              Community Infastructure..................................................................................... 53
              Doing Business in the Community.................................................................... 54

          Central Okanagan Electoral Area - West.................................................................. 55
              Quick Facts................................................................................................................ 55
              Major Industries........................................................................................................ 55
              Community Infastructure..................................................................................... 55
              Doing Business in the Community.................................................................... 56

Conclusion........................................................................................................................................57
Executive Summary
    The Central Okanagan Economic Development Commission (COEDC) is
    a service of the Regional District of Central Okanagan providing economic
    development services to the communities of Lake Country, Kelowna,
    Westbank First Nation, West Kelowna, Peachland and Electoral Areas
    East and West. Developed in partnership with MDB Insight this Economic
    Profile provides an overview of the Region’s current strengths, innovation
    assets and economic opportunities. It is easy to follow and provides
    helpful tips, information, and resource links to assist in the collection of
    information about the Central Okanagan.
    The Economic Profile updated in July 2018 uses the most up to date
    information and statistics available. Statistics Canada and BC Stats are
    major sources of information for this document. However, because these
    statistics are updated throughout the year, the reader may want to compare
    the statistics herein with the actual federal and provincial sources:
    Statistics Canada: www.statcan.ca
    BC Stats: www.bcstats.gov.bc.ca
    Throughout the profile, we have also included links to other websites for
    additional information.

    The Central Okanagan
    The Central Okanagan Economic Development Commission would like
    to respectfully acknowledge that the Regional District is the traditional
    territory of the syilx and Okanagan peoples.

    Breathtaking countryside, fantastic local food and wine, a four-season
    playground packed with outdoor amenities – it’s easy to see why the Central
    Okanagan is one of British Columbia’s fastest growing communities. But
    there’s more to this region than can be seen, tasted, and experienced. We
    also have a diverse, thriving economy that includes:
       • high tech aerospace,
       • animation studios crafting today’s big blockbusters,
       • world class hospitals and healthcare providers,
       • major university campuses,
       • some of the best agricultural land in Canada.

    Find out for yourself why people build their futures here: they come for
    the diverse career opportunities, and stay for the lifestyle.

1
Central Okanagan CSDs Population, 2016

Source: Statistics Canada, Census 2016; Image Source: Invest Kelowna

Statistics Reporting
Under Statistics Canada, the Central Okanagan is defined
within the boundaries of the Central Okanagan Census
Division (CD) as well as the Kelowna Census Metropolitan
Region (CMA). For the purposes of this report, the census
data for the Kelowna CMA was used for statistics labelled
‘Central Okanagan’.

The Kelowna CMA contains nine Census Sub-Divisions
(CSD): Kelowna, West Kelowna, Lake Country, Peachland,
Tsinstikeptum 9, Tsinstikeptum 10, Central Okanagan, Central
Okanagan J, and Duck Lake 7. These nine CSDs are presented
throughout this report; however, some of the CSDs have been
joined and or re-named to simplify the statistics and assist the
reader in understanding their geographical location.

The changes are as follows:
  • Tsinstikeptum 9 and Tsinstikeptum 10 (Combined) =
    Westbank First Nation
  • Central Okanagan = Central Okanagan East
  • Central Okanagan J = Central Okanagan West
  • Duck Lake 7 = Okanagan Indian Band

                                                                       2
Demographics
Population and Distribution
As of the 2016 Census, the Central Okanagan has a population The Okanagan Indian Band’s Reserve Duck Lake 7, within the
of 194,882 people, making it the fourth largest regional district Regional District of Central Okanagan, showed a decline in
in British Columbia (BC) and the largest population hub population from 2011 to 2016 which is not reflective of The
between Vancouver and Calgary. Okanagan Indian Band’s population or the regional growth
trends. The Okanagan Indian Band’s population centre is in
The Central Okanagan has seen a consistent growth in its the Northern Okanagan with the Okanagan Indian Band
population since 2006, with average growth rates that surpass Administration Department located in Vernon, for more
the province of BC as a whole. information you can contact the Okanagan Indian Band.
Figure 1: Population and Growth, 2006-2016 Of the census sub-divisions within the Central Okanagan
(Kelowna CMA), the major centres are the City of Kelowna,
Year CO Population
CO Population the City of West Kelowna, and the District of Lake Country,
Growth % which together make up 89% of the Central Okanagan’s total
2006 162,276 - population.
2011 179,839 10.8%
2016 194,882 8.4% Figure 3: Central Okanagan Population
Distribution by Census Sub-Division, 2016
BC Population Central Central
Year BC Population Okanagan Okanagan
Growth % Peachland
East 2% West
2006 4,113,487 - 2.8% 1% Okanagan
Indian Band
2011 4,400,057 7.0% Westbank .9%
First Nation
2016 4,648,055 5.6% 4.6%
CAN Population
Year CAN Population
Growth % Lake
2006 31,612,897 - Country
6.6%
2011 33,476,688 5.9%
2016 35,151,728 5.0%
Source: Statistics Canada, National Household Survey 2011 & Census 2016
West Kelowna
16.8%
Kelowna
The majority of census sub-divisions in the Central Okanagan 65.4%
(Kelowna CMA) have seen robust population growth since
2011, with Westbank First Nation experiencing the largest
growth of 27.9%.
Figure 2: Population Change, 2011-2016
30%
Source: Statistics Canada, Census 2016
25% 27.9%
20%
15%
Indian Band
Okanagan
10%
8.6% 10.4%
5% 5.7% 1.7% 8.4%
4.4% 0.8%
0
Kelowna
West Kelowna
Lake Country
Peachland
First Nation
West Bank
Okanagan East
Central
Okanagan West
Central
Kelowna CMA
-5%
-10% -13.2%
-15%
3
Source: Statistics Canada, National Household Survey 2011 & Census 2016
Age Distribution
Since 2006 the Central Okanagan (Kelowna CMA) has seen
population increases in most age categories, with youth and young
adult population growth surpassing the provincial and national averages.
While the Region remains popular with retirees, it is interesting to note the
above average growth in 25-34 years as young professionals and families
are drawn to the region’s career opportunities and relative lifestyle
affordability. When looking at major age groups the Region has a higher
percentage of those aged 65 and over and a lower percentage of those in the
0 to 14 and 15 to 64 age ranges compared to the province as a whole.

Figure 4: Central Okanagan and British Columbia Age
Group Comparison, 2016

                                                                                    64.5%
                                         14.2%

                          0 to 14                                          15 to 64
                           years                                            years

                       14.9%                                             66.9%

                                                                21.4%
               Kelowna CMA
               BC
                                                    65 years
                                                    and over

                                                18.3%

        Source: Statistics Canada, Census 2016

Figure 5: Central Okanagan and British Columbia Age Group
Comparison (Detailed Groups), 2016
        16%
        14%
        12%
        10%
         8%
         6%
               0-14        15-24         25-34          35-44    45-54      55-64   65-74   75 years
               years       years         years          years    years      years   years   and over
     Kelowna 14.2%
         CMA               11.6%         12.3%          11.4%    13.9%      15.3%   11.6%    9.7%
         BC 14.9%          11.8%         13.3%          12.7%    14.6%      14.6%   10.5%    7.7%
                                                                                                       4
       Source: Statistics Canada, Census 2016
The median age of the Central Okanagan population is 45.5 – with the median ages of
    Kelowna, Lake Country, and West Kelowna close to the median age of BC (43.0).

    Figure 6: Median Age of Central Okanagan Communities, 2016

                         43.0 BC
                         43.8           Kelowna
                         44.7           Lake Country
                         45.2           West Kelowna
                         45.5 Central Okanagan
                         50.2           Central Okanagan East
                         52.9           Westbank First Nation
                         53.7           Central Okanagan West
                         57.3           Peachland
                         57.8           Okanagan Indian Band
                         Source: Statistics Canada, Census 2016
                                                                                                        45.5
                                                                                                            years old
    Since 2006 the Central Okanagan (Kelowna CMA) has seen population increases in almost all
    age categories, but growth has been especially robust in the youth and young adult population.
    When compared to Canada, the Kelowna CMA has seen higher growth rates in the 0-14 age
    category and the 25-34 age categories.

    Figure 7: Central Okanagan Population by Age Categories, 2006-2016
                            30000
                            25000
                            20000
                            15000
                            10000
                             5000
                                 0
                                  0-14            15-24           25-34     35-44        45-54      55-64      65-74   75 years
                                 years            years           years     years        years      years      years   and over
                         Kelowna 25525
                        CMA 2006                 20815            16800     22345        25350      20595      15910    14930
                         Kelowna
                        CMA 2011 26350           22685            21055     21765        28140      25400      17690    16760
                         Kelowna
                        CMA 2016 27590           22580            23875     22220        27045      29905      22695    18975
                         Source: Statistics Canada, Census 2016, NHS 2011, Census 2006

    Figure 8: Central Okanagan, BC, Canada Age Distribution Growth Rates,
    2006-2016
      Region and Year                                0-14           15-24     25-34 35-44 45-54 55-64                        65-74   75+
      Kelowna CMA 2006-2011                         3.2%            9.0%       25.3%        -2.6%      11.0%       23.3%     11.2%   12.3%
      Kelowna CMA 2011-2016                         4.7%            -0.5%      13.4%        2.1%       -3.9%       17.7%     28.3%   13.2%
      BC 2006-2011                                  -0.3%            2.9%      13.0%        -4.9%       6.2%       21.7%     18.6%   10.7%
      BC 2011-2016                                  2.1%            -1.5%       9.2%        -1.0%      -4.0%       10.5%     31.7%   13.4%
      Canada 2006-2011                              0.5%             3.4%       8.2%        -6.6%       7.2%       19.6%     16.9%   10.9%
      Canada 2011-2016                              4.1%            -2.2%       6.5%        1.0%       -5.6%       11.8%     26.9%   12.0%
5
    Source: Statistics Canada, Census 2016, NHS 2011, Census 2006
Population Growth Projections
The Central Okanagan is expected to outpace provincial
population growth between 2018 and 2026; a net growth of
32,000 people with an average growth rate of 1.6% a year.

Figure 9: Population Growth Projections,
2006 to 2026

                           Total                                  Population
 Year
                         Population                              Growth Rate
 2006                          167,560                                        2.6%
 2007                          172,850                                        3.2%
 2008                          178,568                                        3.3%
 2009                          182,200                                        2.0%
 2010                          182,228                                        0.0%
                                                                                     historic

 2011                          183,521                                        0.7%
 2012                          185,333                                        1.0%
 2013                          186,417                                        0.6%
 2014                          190,099                                        2.0%
 2015                          193,936                                        2.0%
 2016                          197,017                                        1.6%
 2017                          200,207                                        1.6%
 2018                          203,538                                        1.7%
 2019                          206,887                                        1.6%
 2020                          210,281                                        1.6%
                                                                                     projections

 2021                          213,687                                        1.6%
 2022                          217,126                                        1.6%
 2023                          220,620                                        1.6%
 2024                          224,129                                        1.6%
 2025                          227,641                                        1.6%
 2026                          231,156                                        1.5%
Source: BC Stats, Sub-Provincial Population Projections (P.E.O.P.L.E), 2017

                                                                                                   6
Figure 10: Population Growth Projections by Age Group, 2006 to 2026
     Year                    0-14                       15-24                     25-34           35-44                     45-54              55-64       65+
     2011                   26,562                      23,912                    22,991          22,565                    28,128             24,258      33,489
     2012                   26,444                      24,033                    23,332          22,603                    27,736             25,043     34,320

                                                                                                                                                                     historic
     2013                   26,112                      24,040                    23,405          22,733                    27,148             25,653     35,532
     2014                   26,183                      24,618                    23,916          23,210                    27,039             26,273     36,706
     2015                   26,124                      25,104                    24,642          23,527                    27,282             27,187     37,946
     2016                   26,427                      25,206                    24,814          23,694                    27,049             27,959     39,298
     2017                   26,903                      24,805                    25,943          24,369                    26,726             29,114     40,714
     2018                   27,324                      24,473                    27,078          25,246                    26,194             29,508     41,953
     2019                   27,776                      23,782                    28,524          26,255                    25,815             30,093     43,130
     2020                   28,454                      22,948                    29,757          27,257                    25,744             30,296     44,439

                                                                                                                                                                     projections
     2021                   29,103                      22,157                    30,921          28,223                    26,065             30,354     45,767
     2022                   29,727                      21,719                    31,826          29,217                    26,331             29,962     47,256
     2023                   30,376                      21,488                    32,529          30,106                    26,657             29,539     48,767
     2024                   31,010                      21,663                    32,624          31,140                    27,030             29,032     50,432
     2025                   31,661                      21,719                    32,516          32,483                    27,305             28,726     51,936
     2026                   32,373                      21,781                    32,459          33,567                    27,612             28,435      53,522
    Source: BC Stats, Sub-Provincial Population Projections (P.E.O.P.L.E), 2017

    Analyzing the population growth projections by age group shows highest growth in the 35-44 age group with an
    average of 3.6% year over year from 2018-2026. The age group 15 to 24 is expected to see declines until 2023 before
    incremental growth from 2024 onwards. As Baby Boomers move into the 65 and over age category there will also be
    declines in the 55 to 64 age group. Growth in the Central Okanagan outpaces provincial projections by 1 to 2 % in
    all age groups except 55-64 where it equals provincial projections.

    Figure 11: Population Average Growth Rate
    Projections by Age Group, 2018 to 2026
                                                                                                  Aboriginal Population
        4%
                                                                                                  The Aboriginal population in the Central Okanagan (Kelowna
                                                                                                  CMA) is concentrated primarily in Kelowna, West Kelowna,
                                                                                                  and Westbank First Nation. 4.2% of BC’s total population that
        3%
                                                                                                  identifies as Aboriginal live in the Central Okanagan.
        2%
                                                                                                  Figure 12: Central Okanagan & Communities
        1%                                                                                        Aboriginal Population, 2016
                                                                                                  Community                                Population   % of Total
      0.0%                                                                                        Central Okanagan                         11,360       4.2%
                                                                                                  British Columbia                         270,585      -
     -1.0%
                                                                                                  Kelowna               6,840                           60.2%
     -2.0%                                                                                        West Kelowna          1,835                           16.2%
              0-14         15-24         25-34         35-44         45-54        55-64    65+    Westbank First Nation 1,285                           11.3%
       BC     0.9%         1.3%          1.2%          2.0%          -0.1%        0.3%     3.6%   Lake Country            740                            6.5%
       CO     2.1%        -1.4%          2.5%          3.6%          0.4%         -0.2%    3.1%   Peachland               310                            2.7%
                                                                                                  Central Okanagan East   180                            1.6%
                                                                                                  Central Okanagan West   100                            0.9%
    Source: BC Stats, Sub-Provincial Population Projections (P.E.O.P.L.E), 2017                   Okanagan Indian Band     70                            0.6%
7                                                                                                 Source: Statistics Canada, Census 2016
Migration Income Distribution
Since 2011, 2.3% of migrants to Canada choosing BC have The Central Okanagan (Kelowna CMA) has a household
migrated to the Central Okanagan (Kelowna CMA). In addi- income distribution that matches closely, within 2% differential
tion, 7.8% of migrants from other provinces to BC choose to in each income bracket, with that of BC and Canada. 51% of
live in the Central Okanagan (Kelowna CMA). households in the Central Okanagan have an income of more
than $70,000 annually.
Figure 13: Central Okanagan & Communities Key Figure 14: Central Okanagan, BC, and Canada
Labour Force Statistics, 2016 Household Income Distribution, 2016
Central British % of 30%
Okanagan Columbia BC
Place of Residence - 1 Year Ago 25%
Intra-Provincial Migrants 7,230 188,225 3.8%
Inter-Provincial Migrants 4,795 61,740 7.8% 20%
External Migrants 1,585 68,860 2.3%
Place of Residence - 5 Year Ago 15%
Intra-Provincial Migrants 20,940 503,685 4.2%
Inter-Provincial Migrants 14,950 169,115 8.8% 10%
External Migrants 4,695 235,730 2.0%
Source: Statistics Canada, Census 2016 5%
0%
under $40k $40k - $69,999 $70k - $99,999 $100k - $124,999 $125K +
Kelowna CMA BC Canada
Source: Statistics Canada, Census 2016
Figure 15: Central Okanagan Communities Household Income Distribution, 2016
35%
30%
Kelowna
West Kelowna
25% Lake Country
Peachland
Westbank First Nation
20% Central Okanagan East
Central Okanagan West
15% Okanagan Indian Band
29.8% 34.7%
10%
5%
0%
under $40k $40k - $69,999 $70k - $99,999 $100k - $124,999 $125K + 8
Source: Statistics Canada, Census 2016Median individual and household incomes have risen faster in the Central
Okanagan (Kelowna CMA) than the provincial average at 16.8% and 19.6%
respectfully when adjusted for inflation – this means wages are growing faster in
the region than the provincial growth rates.
Figure 16: Central Okanagan, BC, and Canada Household Income
Distribution, 2016
Median Median Median Median
Individual Individual % Household Household %
Community
Income Income Change Income Income Change
2015 2010 2015 2010
Central
$34,509 $29,542 16.8% $71,127 $59,456 19.6%
Okanagan
British
$33,012 $28,765 14.8% $69,995 $60,333 16.0%
Columbia
Source: Statistics Canada, National Household Survey 2011, Census 2016
Note: Numbers are sourced directly from Statistics Canada and are not adjusted for inflation.
Of seven communities in the Central Okanagan (Kelowna CMA), Central Okanagan
East has the highest median household income ($85,504) followed closely by West
Kelowna ($83,942) and Lake Country ($83,243).
Figure 17: BC
$69,995
Kelowna
$68,627
Kelowna
CMA
$71,127
West Kelowna
$83,942
Okanagan
Indian Band Central Okanagan
$50,987 Communities Median Lake Country
Household Income, $83,243
Central 2015
Okanagan
West
$66,912
Peachland
Central $72,294
Okanagan
East Westbank
$85,504 First Nation
$70,561
Source: Statistics Canada, Census 2016
9Income Composition
Income composition varies significantly across communities in the Central Okanagan as shown in the chart below. Market
generated income, which includes employment income and investment income, represents 86% of total income on average with
the remaining 14% coming from government transfer payments. The ratio of government transfers to total income tends to be
higher in communities with a higher median age, given the associated increase in retirees in those communities.
Figure 18: Composition of Income of Central Okanagan Communities, Kelowna CMA, BC and
Canada (2016)
100 11.7 11.1 12 10.1 24.7 11.6 11.3 17.9 15.6 11.9 12.9
16.3 18.1 22.4 20.3 22.5 22 22.2 24.7
80 27.1
22
16.8
60
72 70.8 65.6 69.6 65.9 66.7 60.1 65.9 62.3
58.5 57.2
40
20
0
Canada BC Kelowna Lake Okanagan Kelowna West Westbank First Peachland Central Central
CMA Country Indian Band Kelowna Nation Okanagan E Okanagan W
Government transfer payments % (Canada Pension Investment income % (private pensions, annuities and Employment income % (wages, salaries and
Plan benefits, Old Age Security and Guaranteed Income other money income) self-employment income)
Support, other income from government sources)
10Labour Force and Education
Key Labour Force Statistics
The majority of the Central Okanagan’s the labour force is located within Kelowna, West Kelowna, and Lake Country. The Central
Okanagan has had an average unemployment rate of 6.4% over the past 10 years from 2007-2017. The current unemployment
rate of 7.1%, while slightly higher than the 6.7% unemployment rate of BC, remains below the Canadian average of 7.7%.
Figure 19: Central Okanagan & Communities Key Labour Force Statistics, 2016
In Labour Participation Employment Unemployment
Community Employed Unemployed
Force Rate Rate Rate
Central Okanagan 103,840 96,490 7,345 63.7% 59.2% 7.1%
British Columbia 2,471,665 2,305,690 165,975 63.9% 59.6% 6.7%
Kelowna 64,380 37,255 4,765 65.0% 60.5% 6.9%
West Kelowna 16,960 15,880 1,080 63.6% 59.5% 6.4%
Lake Country 7,235 6,690 545 67.6% 62.5% 7.5%
Westbank First Nation 4,045 3,715 330 56.0% 51.0% 8.9%
Peachland 2,450 2,240 215 50.5% 46.1% 8.8%
Central Okanagan East 2,140 1,970 175 63.7% 58.6% 8.2%
Central Okanagan West 1,000 845 155 57.6% 48.7% 15.5%
Okanagan Indian Band 860 775 80 57.5% 51.8% 9.9%
Source: Statistics Canada, Census 2016
Employment by Industry
Employment by industry allows for an understanding Figure 20: Central Okanagan Employment by
of the skills of the Central Okanagan labour force by Industry (NAICS), 2016
industry and an indication of the areas in which our
region can provide support to investment attraction 0% 2% 4% 6% 8% 10% 12% 14%
and retention initiatives. In contrast to the labour Agriculture, forestry, fishing & hunting 2.2%
Mining and oil and gas extraction 1.6%
force, employment in a given community accounts for Utilities 0.5%
the individuals who work in that community, regard- Construction 10.9%
less of whether or not they live in that community. Manufacturing 5.6%
With the increasing participation in telework and Wholesale trade 3%
remote work arrangements this distinction is helpful. Retail trade 13%
Transportation and warehousing 4.1%
Information and cultural industries 2%
The four industries in which the majority of the Finance and insurance 3.4%
Central Okanagan’s workforce is employed include: Real estate and rental and leasing 2.2%
health care and social assistance (13.1%); retail trade Professional, scientific and technical services 6.7%
(13.0%); construction (10.9%); and accommodation Administrative & support, waste management... 5%
Education services 6.2%
and food service (9.4%). When compared to BC and Healthcare and social assistance 13.1%
Canada, the Central Okanagan (Kelowna CMA) has Arts, entertainment and recreation 2.6%
a greater proportion of workforce participating in the Accomodation and food services 9.4%
four industries noted above. Figure 20 demonstrates Other services (except public administration) 4.9%
Public administration 3.5%
the diversity of employment by industry and the
comparative strengths of the Central Okanagan Kelowna CMA BC Canada
(Kelowna CMA) to BC and Canada in these areas.
Source: Statistics Canada, Census 2016
11Labour Force by Occupation
In order to get a more complete picture of the labour force The four main occupational categories for the Central Okana-
capabilities for a particular area, it is necessary to examine gan (Kelowna CMA)workforce include: sales and service
the labour force by occupation, that is, by the core activities (26.2%); trades, transport, and equipment operators and related
associated with an individual’s employment. This is in contrast (16.2%); business, finance, and administration (14.5%); and
to the previous section, which outlines the labour force by the management (11.7%). Figure 21 demonstrates the diversity the
industry in which the individual is employed. Examining the Central Okanagan (Kelowna CMA) labour force capabilities
labour force by occupation provides a more detailed look at comparative to BC and Canada in these areas.
the individual specializations which may not be as evident
through industry-based statistics and provide more of an
indication of the extent of knowledge workers that may be
present in a local economy.
Figure 21: Central Okanagan Employment by Occupation (NOC), 2016
0% 5% 10% 15% 20% 25% 30%
Management 11.7%
Business, finance and administration 14.5%
Natural and applied sciences and related 5.2%
Health 8.1%
Education, law and social, community and government... 9.5%
Art, culture, recreation and sport 3%
Sales and service 26.2%
Trades, transport and equipment operators and related 16.2%
Natural resources, agriculture and related production 2.9%
Manufacturing and utilities 2.7%
Kelowna CMA BC Canada
Source: Statistics Canada, Census 2016
Commuting Patterns Figure 22: Central Okanagan Commuting Patterns, 2016
1.8%
The majority (68%) of workers in the Central
Okanagan (Kelowna CMA) work within
their own community (CSD). Approximately 5.2% Commuting within CSD of residence
25% commute to another community within
the Kelowna CMA for work, while 7% work Commute to a different CSD within
outside of the Central Okanagan (Kelowna CD of residence
CMA) or in another province. These statistics 24.9% Commute to a different CSD & CD
do not account for telework employment within province of residence
(Telework is defined as working from Commute to a different province
somewhere that is not your office, including or territory
68%
satellite offices and co-working spaces) which
is gaining traction provincially according
to WorkBC largely due to advancements in
online messaging, video conferencing and Source: Statistics Canada, Census 2016
cloud-based application services.
12Figure 23: Central Okanagan Highest Level of Education Attainment, 2016
Education University -
Secondary (high) College,
Attainment 35% school diploma or CEGEP or other bachelor level
30% equivalent non-university or above
The Central Okanagan (Kelowna No certificate, Apprenticeship
CMA) is home to an educated 25%
diploma, of trades
workforce, with a higher proportion 20%
degree University -
of residents holding a secondary 15%
10% below bachelor
or higher certificate, diploma or level
degree compared to the rest of 5%
BC and Canada; with 24.5% of 0%
residents holding a university level Kelowna CMA 8.4% 28.6% 11.6% 26.9% 3.3% 21.2%
accreditation, 26.9% holding college BC 9.6% 26.5% 9.1% 20.9% 3.9% 29.9%
level accreditation, and 11.6% having
Canada 11.5% 23.7% 10.8% 22.4% 3.1% 28.5%
pursued an apprenticeship or trade.
Source: Statistics Canada, Census 2016
Figure 24: Central Okanagan & Communities Education Statistics, 2016
(High) School Post Secondary
No Certificate, Diploma,
Community % Diploma or % Certificate, Diploma or %
Degree
Equivalent Degree
Central Okanagan 8,630 8.4% 29,235 28.6% 64,380 63.0%
British Columbia 244,000 9.6% 671,010 26.5% 1,617,965 63.9%
Lake Country 625 8.5% 2,100 28.7% 4,590 62.7%
Kelowna 5,280 7.9% 18,420 27.7% 42,865 64.4%
West Kelowna 1,355 8.0% 5,075 29.9% 10,565 62.2%
Westbank First Nation 660 15.0% 1,440 32.8% 2,290 52.2%
Peachland 295 10.7% 830 30.0% 1,640 59.3%
Central Okanagan East 195 8.8% 710 32.1% 1,305 59.0%
Central Okanagan West 110 9.1% 325 26.7% 780 64.2%
Okanagan Indian Band 120 14.9% 340 42.2% 345 42.9%
Source: Statistics Canada, Census 2016
Education by Subject Figure 25: Central Okanagan Education by Subject, 2016
Top fields of post-secondary study for Education 6.5%
Central Okanagan residents include archi- Visual arts, performing arts, communication... 3.8%
Humanities 3.9%
tecture, engineering, and related technol-
ogies (21.3%); business, management, and Social and behavioural scinences, law 9.2%
public administration (21.1%); and health Business, management, public administration 21.1%
and related fields (19.0%). Compared to BC Physical and life sciences and technologies 3%
the Central Okanagan (Kelowna CMA) has Mathematics, computer and information sciences 3%
Architecture, engineering, related technologies 21.3%
more residents educated in health and related Agriculture, natural resources, conservation 2.1%
fields; personal, protective, and transportation Health and related fields
services; and architecture, engineering, 19%
Personal, protective, transportation services 7.1%
and related technologies.
13 Kelowna CMA BC
Source: Statistics Canada, Census 2016Key Industries
The Central Okanagan’s economy continues to demonstrate strong
growth with an entrepreneurial culture that supported over 11,000 new
businesses starting since 2010.2 In recent years, billions of dollars have
been invested in the area, improving infrastructure and attracting high-
growth industries of film and digital animation, and technology. These
growing sectors complement existing important industry sectors of:
• Advanced Manufacturing
• Aerospace
• Agriculture and Viticulture
• Construction
• Healthcare
• Retail
• Tourism
Discover the many interesting opportunities here, and the vibrant
economy that supports them.
Agriculture
The Central Okanagan has a long history of agricultural excellence,
with the first apple trees planted in 1859, and agriculture continues
to be a major contributor to the economy. The 2017 release
of the Federal Barton Report Unleashing the Growth Potential
of Key Sectors validated that the agriculture and food sector
in Canada has the potential for substantial growth and export
improvement and the opportunity to become the trusted global
leader in safe, nutritious, and sustainable food for the 21st century.
The agriculture sector in the Central Okanagan is ready. The region Exports of BC Sweet Cherries
has many high-quality farm operations with a diverse offering of to China
products including:
• Tree fruits such as apples, apricots, cherries, peaches and plums
• 84% of the total vineyard acreage of BC
• A wide range of vegetables 2,648,048
• Farm animals such as chickens, sheep, goats, cows and horses
Agriculture in the region is supported by food processing facilities,
administration infrastructure, post-secondary horticulture and agricul-
ture programs, reliable transportation routes, and proximity to dense
population centres. The sector is supported throughout the production
cycle from seed to sale with innovative research leading to development
of new product offerings through to branding, market promotion
and sales. While agricultural parcels are smaller comparative to the 1,270,467*
1,143,839
Canadian prairie provinces due to geographical limitations of lakes
and mountainous terrain, agriculture in the region benefits from the
soil, topography and hot, sunny, dry climate.
Farm and food processing operations in the region continue to grow
and provide a range of products that meet market changes in taste 350,889
and preference. There is both local and export demand for high-value,
and organic products, and for beverages such as wine, cider, and beer. 3,832
Innovation and added-value product development drive agriculture
2012 2013 2014 2015 2016
in the region, from tech-enabled farm applications to custom product
offerings agriculture in the Central Okanagan is growing strong. Exports of BC sweet cherries to China increased significantly
with the creation of the China Cherry Trade Agreement in
2014. *Exports to China were down in 2016 due to heavy rains
2 2012 Economic Profile Regional District of the Central Okanagan; Statistics Canada, Business Patterns, December 2017 which limited the number of cherries meeting the required 14
grade for export.Viticulture Public Post-Secondary Support
With over 182 licenced wineries and more than 8,600 acres of University of British Columbia Okanagan Campus
vineyards the Okanagan Valley is a premiere grape growing offers partnerships in laboratory research and field-based
region in Canada. Regional wines have won numerous awards work to support environmental sustainability, enhance
and rank world’s best at international competitions.2 The area understanding of local ecology, and adapt to climate change.
is known for high-quality varietals, ice wines and distilled
products. From boutique vineyards to world-class operations, Okanagan College offers programs in viticulture and
the region’s wineries are rich in tradition and character. horticulture.
Many Regional wineries maintain the standards of the British Okanagan College has partnered with Westbank First Nation
Columbia Vintners Quality Alliance (BC VQA). The BC to create na’ʔk’ʷulamən (na - kool - a- min) a 6000 square
VQA program is an “appellation of origin” system, similar foot garden which contains more than 50 local Okanagan
to the AOC and DOC systems utilized in France and Italy plants of cultural significance to the syilx people.
respectively, which recognizes that the regional wines have
specific quality and characteristic due to the unique growing Examples of local agriculture and viticulture
conditions of the Okanagan Valley. Wines which are free firms
from specified faults and meeting the other requirements Gray Monk Winery founded in 1972 by George and
and technical specifications set out in the Regulation are then Trudy Heiss, is located on 75 acres of vineyards in Lake
permitted to utilize the BC VQA appellation on their labels Country. Once the oldest family owned and operated
and ensuring customer confidence. winery in the Okanagan, the winery was sold to Andrew
Peller Limited in 2016 along with two other Okanagan
Agricultural Land Reserve wineries for a combined purchase price of $95 million.
The Agricultural Land Reserve (ALR) created in 1974 protects Full time employees: 42-56
6,000 hectares of prime agricultural land within BC. The ALR
constitutes approximately 9% of the Central Okanagan’s overall Scenic Road Cider Co. is located on a century old apple
area ensuring prime agriculture land in the region is protected. orchard, Scenic Road produces authentic craft cider from
Information about the ALR and the Provincial Agricultural 100% local apples. Production facilities and the popular
Land Commission can be found here. tasting room are housed in the property’s 80-year-old
packinghouse. Full time employees: 4
The Okanagan Regional Adaptation Strategies, Wise Earth Farm established in 2011 is a two-acre, micro
BC Climate Action Initiative scale, urban vegetable farm located in Kelowna. Growing
The ability of agricultural producers to adapt to climate change a large variety of delicious, organically grown veggies and
is often linked to physical resources and decision-making herbs throughout the entire growing season they are always
processes that are beyond the individual farm. Some of the pushing the boundaries to extend the availability of their farm
most significant issues affecting future food production in BC products throughout the year. Wise Earth farm products can
include: water management (water supply and storage, drainage be found through farm gate sales or at the Kelowna Farmers’
and ditching); emergency planning; land use practices; and & Crafters’ Market. Full time employees: 4
regional infrastructure3. Agriculture operators and stakeholders
in the Central Okanagan contributed to strategic planning on
the impacts of climate change on the Okanagan Valley resulting
in the Regional Adaptation Strategies – Okanagan Report.
The report outlined a distinctive set of local sector impacts
and priorities, as well as a series of strategies and actions
for adapting and strengthening resilience of the agriculture
industry and can be read here.
2 Wine BC Okanagan Valley winebc.com/discover-bc-wine-country/okanagan-valley/
3 Climate Action Initiative, BC Agriculture and Food https://www.bcagclimateaction.ca/
regional/overview/adaptation-strategies/
15Home Is
Where
The Harvest
Is
Jealous Fruits, a family-owned business,
is the leader in the British Columbian ex-
port cherry industry, and their namesake
brand is the foremost Canadian cherry
brand worldwide. While Jealous Fruits
was founded in 2008, the family farm
Coral Beach Farms has been producing
cherries since 1903 and current own-
ership is 4th generation. A vertically
integrated farming and food processing
business model, Jealous Fruits produces
cherries, primarily fresh but also pitted
and flash frozen, to over 30 countries
globally with their largest markets being
China and the USA. Full Time Employees:
15 full-time year-round; 900 employees
during peak season
Made
With Love,
Light, and
Gratitude
Founded in 1995 Little Creek Dressing is
a family owned and operated food pro-
cessing company creating wholesome,
flavourful dressings and marinades that
support Healthy Eating, Healthy Living,
and a Healthy Planet. Made using the
highest quality of organic ingredients
each dressing has its own unique artisan
flavour from the perfectly paired vinegar,
fruit and spice combinations. All dress-
ings are organic, vegan, and produced
using renewably-sourced energy. Little
Creek Dressing is committed to provid-
ing delicious earth conscious products
to customers in markets globally. Full
Time Employees: 10
16Central Okanagan Farm and Farm Operator Statistics
The following tables give selected statistics to indicate the range and diversity of agricultural activities in the Central Okanagan.
Share of Share of B.C.
Census of Agriculture Crop Area 2016
2016 B.C. Total Total 2016
Data
2016 Hay Crop 1,267ha X
Total Farmland Area 23,461ha 0.9% Field Crops 144ha X
Number of Farms 879 5% Fruits, Berries & Nuts 3,677ha 14.5%
Average Farm Size 27ha n/a Vegetables 121ha 1.9%
Total Farm Operators 1,300 4.9% Nursery Products X X
Total Farm Capital $2,021,193,744 5.4% Sod Grown for Sale X X
Total Gross Farm Receipts $120,147,514 3.2% Greenhouse Flower
8,915m2 X
Total Number of Employees 4,467 10% Production
Source: Statistics Canada and Adapted from Statistics Canada, Census of Agriculture, 2016 Greenhouse Vegetable
4,639m2 X
Production
Other Greenhouse
28,472m2 6.7%
Employed Labour Force by Central Okanagan Production
Census Sub-Division Mushrooms X X
Industry Central Okanagan Christmas Trees 34ha X
NAICS
Description Census Division (Total)
Area Irrigated 5,621ha X
111-112 Farms 1585 Source: Statistics Canada and Adapted from Statistics Canada, Census of Agriculture, 2016
1150 Support Activities 100
for Farms
Livestock and other animals No. of No. of
3121 Beverage 685 on farms farms animals
Manufacturing
Hens & Chickens 167 10,833
Total 2370
Turkeys 17 X
Source: Statistics Canada, Census 2016, 2016
Total Other Poultry 30 286
Cattle & Calves 78 3,733
Share of B.C.
Farmland Use 2016 Dairy Cows 3 5
Total 2016
Crops 5,711ha 1% Beef Cows 44 1,797
Summerfallow 74ha 1.4% Pigs 12 44
Tame or Seeded Pasture 347ha 0.2% Sheep & Lambs 44 806
Natural Land for Pasture 8,834ha 0.6% Horses & Ponies 152 1,092
All Other Land 1,420ha 2.4% Goats 32 241
Total 16,386ha Bison 1 1
Source: Statistics Canada and Adapted from Statistics Canada, Census of Agriculture, 2016 Llamas & Alpacas 18 99
Rabbits 8 16
Colonies of Bees for Honey 51 1,188
Source: Statistics Canada and Adapted from Statistics Canada, Census of Agriculture, 2016
17Provincial and Regional Agricultural Marketing Initiatives
There are currently several provincial and regional marketing initiatives promoting
the variety of local agriculture products available in the Central Okanagan.
Grow BC, Feed BC, Buy BC Initiatives to strengthen BC’s agrifood and seafood
sector and expand the domestic market for BC food and beverage products.
Meet Your Maker Okanagan Networking initiative for farmers and ranchers
from Farm Folk City Folk.
Buy Local, Buy Fresh Okanagan Valley Directory of Okanagan food producers
from the Okanagan Greens Society.
Kelowna Farm to Table Okanagan Tourism directory of local farms and
restaurants that produce and serve local food.
We Heart Local Thompson–Okanagan Directory of local agricultural products,
season schedules, recipes and farm events.
Agritourism
Agritourism represents a major area of economic growth and opportunity in
the Central Okanagan with traditional farm operators developing sustainable
agriculture-related businesses that provide farm experiences for visitors to enjoy.
Some of the regions diverse Agritourism activities include:
• Agricultural heritage exhibits
• Farm tours and farm demonstrations
• Farm related educational activities including cooking classes using farm
products from the farm
• Hay, tractor and sleigh rides
• Pumpkin patch tours and other u-pick activities
• Corn mazes
• Bird and wildlife refuges and rescue services
Tourism Kelowna’s Studio and Farm Self-Guided Tour program and The West Side
Farm Loop offer a diverse range of local agriculture-based experiences on producing
farms. Stop in to enjoy the wide range of farm products for tasting and touching
as well as our many local farmers’ markets offering a selection of local produce.
Locally produced foods can be sampled by residents and tourists alike in the
many restaurants, offering the chance to experience the talents of local chefs and
wine-makers.
Building on the strong tradition of excellent agriculture production and the
burgeoning interest in local agritourism experiences the agriculture sector in the
Central Okanagan is growing strong.
More information about this industry sector is available in the Industry Profile
which can be obtained from the Central Okanagan Economic Development
Commission at:
Toll Free: (877) 332-2673
Phone: (250) 469-6280
Email: info@investkelowna.com
Address: 1450 K.L.O. Road, Kelowna BC, V1W 3Z4
Website: www.investkelowna.com
18Tourism
Tourism is one of the major economic drivers of the Central Okanagan,
responsible for a diversity of jobs, a robust tax base, infrastructure upgrades
and development, and private sector business investment. In the Central
Okanagan tourism is a significant contributor to the local economy,
accounting for approximately 8,350 direct tourism jobs, $240 million in
wages and $337 million in visitor spending.
Tourists in the Central Okanagan enjoy exceptional experiences in all
seasons thanks to its moderate climate. What began as a seasonal tourism
destination known for its outstanding beaches and ski resorts has evolved
to include:
• Active tourism such as hiking, biking, and water sports
• Agritourism and an incredible culinary scene to accompany it
• Cultural and heritage experiences
• Festivals
• Meetings and conventions
• Sporting events such as golf and mountain biking
• Wineries – cideries and breweries too! – offering tours and tastings
Tourists to Central Okanagan have no trouble finding places to stay with
over 45 hotels, motels, and resorts, approximately 100 bed and breakfasts,
and over 20 campgrounds to choose from.
Annual Direct Impact of Kelowna’s Tourism Sector
$240
million 5,570
8,350 direct
jobs in wage earnings
full time
equivalents
(FTEs)
1.9 million
$337 visitors annually
million $142
$370 million
in visitor spending
in tax revenue
million
in gross domestic
product
Source: Intervistas, Economic Impact of Tourism in Kelowna, 2017
19Manufacturing / Aerospace from the following labs4:
• Advanced Materials and Fabrication
The Central Okanagan’s diverse manufacturing sector • Device and Materials Testing and Impact
comprised of 609 manufacturing firms with 5,760 employees • Mental Health and Human Performance
ranges from the traditional such as agri-food and wood • New Product Design and Rapid Prototyping
product processing to high-tech aerospace, with metal,
plastic, concrete and fiberglass products. Fabricated metal • Composites Research Network Facility at UBCO is a
manufacturing, non-metallic mineral manufacturing, trans- collaboration of academia and industry partners supporting
portation equipment manufacturing, plastics and rubber the composites industry with support nodes throughout
products, and beverages are anticipated to lead the way Western Canada.
in growth as the manufacturing industry in the region • UBCO Materials and Manufacturing Research Institute
continues to expand. The cross section of manufacturers (MMRI) serves as a multi-disciplinary, inter-departmental
makes it easy for existing and new businesses to find research hub linking with other regional, national and in-
high quality supply partners locally. ternational universities, industry partners and government
The Central Okanagan is home to a growing segment of research organizations.
well-established and new aerospace companies and suppliers. The cross section of manufacturers in the valley makes it easy
Maintenance, repair, overhaul/in-service support, rotary for existing and new businesses to find high quality supply
wing, and avionics are well represented, and there is an partners locally, the diversity of local firms includes:
increasing number of companies offering a diverse range
of products and services and supported by the Kelowna Composite Materials
International Airport. Composites One is the leading supplier of composites 8
The region is also benefiting from The Digital Technol- materials in North America. Key products include over 200
ogy Supercluster part of the Government of Canada’s aerospace specs including Boeing and Airbus, materials and
Innovation Supercluster Initiative investing up to $950 equipment for composite manufacturing, technical and repairs,
million to support business-led innovation superclusters prepreg, adhesive, potting compounds, epoxy resins, honey-
with the greatest potential to energize the economy. comb core, tooling boards and more. Full Time Employees: 15
FormaShapetm is recognized in the composites industry
Manufacturing as leader in the application of Closed Molded Resin Transfer
Manufacturers in the area produce metal, wood, plastic, Molding technology. Founded in 1981, the company operates
concrete and fiberglass products, specialty food goods, out of an ISO 9001 certified 80,000 square foot purpose-built
textiles and chemicals. Central Okanagan’s dry climate is facility, using lean manufacturing principles. Full Time Em-
especially ideal for fiberglass/composite and wood manufac- ployees: 51-200
turing. The Central Okanagan will continue to be benefit Food Processing
from expansion and growth in the local manufacturing
sector as a result of: Sun-Rype Products Ltd. is a fruit-based food and beverage
• proximity to key export markets manufacturer located in Kelowna. Sun-Rype has been produc-
• growth within the local markets ing juices and fruit snacks for global and domestic markets
• new firms arriving since its foundation in 1946 and in 2018 was recognized by
• existing firms expanding Export Development Canada as Exporter of the Year. Full
time employees: 400
Local sectors such as fabricated metal manufacturing,
non-metallic mineral manufacturing, transportation equip- Metal Manufacturing
ment manufacturing, plastics and rubber products, and Azimuth Solar Products Inc. is a Kelowna-based manu-
beverages are anticipated to lead the way in growth. facturer of mobile solar generators. They are also a reseller
for cutting-edge power management systems, as well, as
Post-Secondary Support Manufacturing recreational solar products. Azimuth Solar Products’ 2-axis,
The manufacturing sector is strongly supported by local 360 degree, full-rotation, portable solar generator has four
academic and training institutions including the University folding solar panels and lets you follow the sun for maximum
of British Columbia Okanagan Campus and Okanagan input and one-day battery charging. Full time employees: 2-10
College. This support includes: Monashee Manufacturing provides custom metal fabrication
• The Survive and Thrive Applied Research (STAR) and production machining throughout North America
facilities at the University of British Columbia Okanagan since 1935 and produces its own line of truck snow plow
(UBCO) provide access to R&D, Equipment and Talent 20
4 STAR Resources and Facilities star.ubc.ca/resources-facilities/assemblies. The company has supplied and serviced local, the Southern Interior as well as a Flight Centre providing
provincial and export markets from its present location in private and commercial pilot licenses in partnership with
Kelowna since its incorporation and is the oldest established the Okanagan Business Program. Full time employees: 81
machine shop in Kelowna. Full time employees: 40
Jupiter Avionics Corporation research and development
Wood Manufacturing design, development and manufacture of airborne audio
Geometrik designs and manufactures wood acoustical communication equipment. Full time employees: 13
ceiling and wall panels combining noise control and
Reidco Metal Industries Ltd. specializes in custom
beauty. With a portfolio that includes University of British
Columbia’s law building, Twitter Headquarters, the Stanford manufacturing and production runs of steel and aluminum
University law building, and the Surrey Olympic Games parts from its 65,000 square foot facility. Full time employees:
Preparation Centre they have experience serving clients 70
across North America and Europe. Full time employees: 40
Public Post-Secondary Support: Aerospace
Gorman Bros. Lumber, Ltd. a lumber mill that manufactures
spruce and lodge pine pole boards, and fir pilings located in The Learning Factory for Advanced Composites is a
West Kelowna and founded in 1951. Full time employees: 250 joint initiative between the University of British Columbia
Tolko Industries Ltd. manufactures and markets specialty
Okanagan Campus, the Composites Research Network
forestry products including lumber, plywood, veneer and and the Avcorp Group. The consortium is developing
oriented strand board. With company headquarters in a commercial production facility of composite aircraft
Vernon and one of their 16 production facilities in parts in an environment that will collect sensor-based
Kelowna, Tolko products are sold around the world. Full data to develop computational models of the composite
time employees: 3,500 manufacturing process.
Aerospace Department and Aircraft Maintenance
Aerospace Engineer programs offered by Okanagan College work
A cluster of 30 aerospace companies form a significant part directly with industry to train the next generation of
of the manufacturing industry in the Central Okanagan. skilled technicians.
This includes the anchor company KF Aerospace – the Commercial Aviation Diploma program at Okanagan
region’s largest private employer with 700 employees – College focuses on commercial aviation by providing
which provides maintenance, engineering and pilot training students with business experience along with the aviation
services. The aerospace industry is further supported by the training required by Transport Canada.
Kelowna International Airport.
Air-Hart Aviation Flight School provides comprehensive
The Regional District of Central Okanagan’s Eco- Flight Training (commercial and private license) and Float
nomic Development Commission (COEDC) with Plane/Seaplane (floatplane rating and 50-hour bush course)
support from Global Affairs Canada and the Kelowna as well as advanced Seaplane training.
International Airport (YLW), has created specific resources
about the Aerospace sector including Central Okanagan Okanagan Mountain Helicopters offers comprehensive
Aerospace Core Competencies Study, Asset Map helicopter pilot training tailored to meet the needs and
and a Regional Database. demands of commercial helicopter companies in Canada.
Examples of Aerospace Firms More information about this industry sector is available
in the Manufacturing / Aerospace Sector Profile which
Anodyne Electronics Manufacturing Corporation
can be obtained from the Central Okanagan Economic
designs and manufactures specialized communication Development Commission at:
systems and products for various special role
aircraft. Full-Time Employees: 94 Toll Free: (877) 332-2673
Phone: (250) 469-6280
ASDAC C.N.C. Machining Ltd. builds landing gear for Email: info@investkelowna.com
fixed wing aircraft and structural components for wings Address: 1450 K.L.O. Road, Kelowna BC, V1W 3Z4
and fuselage parts, as well as Inconel engine rotating parts Website: www.investkelowna.com
for turbine helicopter engines. Full time employees: 16
Carson Air provides Medevac services to the Province
of BC; repatriation to Canadians abroad returning for
21 medical services; cargo services to Federal Express,
transportation of freight throughout Western Canada, andYou can also read