LEADING VERTICALLY INTEGRATED GENERIC PLAYER - Investor Presentation - March 2019 - Aurobindo Pharma

Page created by Maria Webster
 
CONTINUE READING
LEADING VERTICALLY INTEGRATED GENERIC PLAYER - Investor Presentation - March 2019 - Aurobindo Pharma
LEADING VERTICALLY INTEGRATED GENERIC PLAYER

Investor Presentation - March 2019
LEADING VERTICALLY INTEGRATED GENERIC PLAYER - Investor Presentation - March 2019 - Aurobindo Pharma
Safe Harbor Statement
This presentation is provided for informational purposes only and does not constitute or form part of any offer or invitation to sell
or issue, or any solicitation of any offer to purchase or subscribe for any interest in or securities of Aurobindo Pharma, nor shall
it, or any part hereof, form the basis of, or be relied on in connection with, any contract therefore.

This presentation contains statements that constitute “forward looking statements” including and without limitation, statements
relating to the implementation of strategic initiatives, and other statements relating to our future business developments and
economic performance.

While these forward looking statements represent our judgment and future expectations concerning the development of our
business, such statements reflect various assumptions concerning future developments and a number of risks, uncertainties
and other important factors could cause actual developments and results to differ materially from our expectations. These
factors include, but are not limited to, general market, macro-economic, governmental and regulatory trends, movements in
currency exchange and interest rates, competitive pressures, technological developments, changes in the financial conditions of
third parties dealing with us, regulatory and legislative developments, and other key factors that we have indicated could
adversely affect our business and financial performance.

Aurobindo Pharma undertakes no obligation to publicly revise any forward looking statements to reflect future events or
circumstances.

This document is strictly confidential and may not be disclosed, reproduced or redistributed, in whole or in part, to any other
person.

For updates and specific queries, please visit our website www. aurobindo.com
                                                                                                                                        1
LEADING VERTICALLY INTEGRATED GENERIC PLAYER - Investor Presentation - March 2019 - Aurobindo Pharma
Aurobindo Pharma – Overview

        10th Largest generic                          2nd Largest listed                         3rd Largest volume       Amongst Top 10 Gx      32 years
          company by sales                         Indian Pharmaceutical                          supplier in the US**   companies in 4   out   in existence
             globally#                             company by revenues*                                                  of Top 5 Europe
                                                                                                                             Countries@

               $ 2.6 Bn                             27 Manufacturing                                       155+            >26 Billion          >20,000
          Global Revenues in                         Facilities globally                           Markets Presence      Diverse dosage forms   Employees
                 FY18                                                                                                    manufactured in FY18
                                                                                                                                                               2
# Source: Evaluate Pharma; *As per FY18 revenues; ** Source: IQVIA MAT Dec 2018 data; @ Source: IQVIA MAT Q4 2017
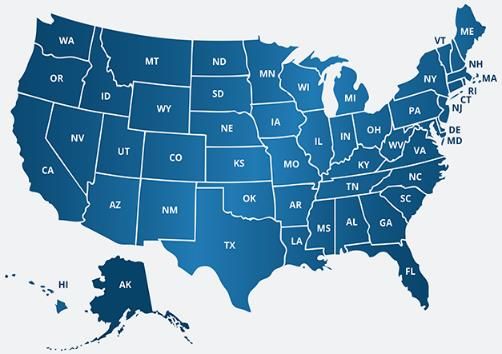
LEADING VERTICALLY INTEGRATED GENERIC PLAYER - Investor Presentation - March 2019 - Aurobindo Pharma
The Journey So Far…
                                                                             2014 - 16
                                                                              Acquired Western European commercial
                                                                               operations from Actavis
                                                                              Acquired Natrol
                                                                              Established OTC presence
                                                                              Entered into Biosimilars and Vaccines
                                                                              Filed first peptide DMF
                                  2006-08                                    2017-19
                                   Acquired UK based Milpharm                Acquired Generis in Portugal and Apotex Inc’s
                                   Acquired formulations facility,            businesses in 5 European countries
                                    AuroLife, in US                           Focus on differentiated technology platforms
                                  2009-12                                      and Specialty Pharmaceuticals
                                   Commenced Aurolife operations             Acquired R&D assets from Advent
                                                                               Pharmaceuticals Pty, Australia
                                   Received first approval for controlled
                                    substance drug in US                      Acquired a portfolio of seven marketed
                                                                               oncology injectable products from Spectrum
                                  2013
                                                                               Pharmaceuticals Inc.
                                   Commenced marketing specialty
1992-2006                                                                     Entered into a definitive agreement to acquire
                                    injectables in USA
 Started API manufacturing                                                    dermatology and oral solids businesses from
                                   Building capabilities in Penem and         Sandoz Inc., USA
 Initial Public Offering (‘95)     Oncology
 Entered formulation business                                                              2014-2019
  (‘02)                                    2006 - 2013
                                                                             Strengthening market penetration in the
        Pre-2006                       Formulation Focus                                    US & EU
                                                +                                               +
        API Focus                 Establishing Global Footprint                 Expanding into Specialty Products
                                                                                                                                3
LEADING VERTICALLY INTEGRATED GENERIC PLAYER - Investor Presentation - March 2019 - Aurobindo Pharma
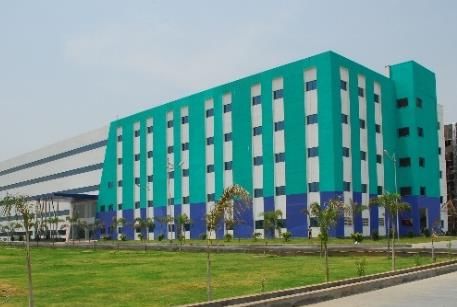
Emerged into a leading global generic player

                           Revenue ($ Mn)                                      EBITDA ($ Mn) & Margin                              Net Profit ($ Mn)   Geographical Revenue Mix
                                                                                                  23%
                                             2,562                                                                                                        International   Domestic
                                                                                                                                                376
                                                                                                  588
                                                                                                                                                                           10
                                                                                                                                                            37

                                                                                                                                                                           90
                                                                                                                                                            63
                           378
                                                                                 14%                                               37
                                                                                   53
                          2008                2018                                2008           2018                              2008        2018        2008           2018

                              Business Mix                                         Employee Base                              ANDAs – Filing Status      DMFs – Filing Status
Formulations, 39%

                          6%                  5%                                                                                                                          236
                                              6%                                                20,000+                                         519
                          16%
                                                           Formulations, 82%

                          8%                 26%
                          9%

                                                                                                                                                           122
                                             45%
                          61%                                                     6,800+
                                                                                                                                   128
                                             18%

                         2008                2018
                      API US         EU     ARV GMs                                                                                                                                  4
                                                                                  2008           2018*                             2008        2018*       2008           2018*
                    Note: Data related to FY2008 and FY2018. Fx rate: $1 = Rs. 64.3928; GMs: Growth Markets; * As on 31 Dec 2018
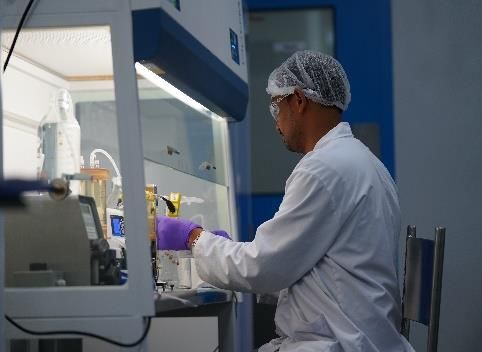
LEADING VERTICALLY INTEGRATED GENERIC PLAYER - Investor Presentation - March 2019 - Aurobindo Pharma
Core Strengths

                                             • Among Top 3 in >65% of commercial portfolio in US(1) in terms of prescriptions
                                             • Large US portfolio(2) - 519 ANDAs filed; 369 with final approval, 28 Tentative approval(3), and 122
                                               under review
     Scale & Diversity                       • Extensive product portfolio & pipeline across the globe
                                             • Experienced and focused leadership team
                                             • Building diversified product basket in speciality segments
                                             • Through M&As, adding more specialized products, new technologies and scale in our core markets

                                            • Large manufacturing facilities inspected by various regulatory authorities including US FDA and
                                              EMA
                                            • Over the last 3 years, over 125 ANDAs were filed including 52 ANDAs in the last 12 months*
            Strengths                       • High level of vertical integration; around 70% of API requirement is manufactured in-house
                                            • Focus on complying with global quality and EHS standards
                                            • Dedicated commercial and BD teams focused on developing new partnerships
                                            • Speed and effectiveness in execution

(1)Source: IQVIA QTR Dec 2018; (2) As on 31st Dec 2018; (3) Tentative approvals include 9 ANDAs approved under PEPFAR; *Jan-Dec 2018                 5
LEADING VERTICALLY INTEGRATED GENERIC PLAYER - Investor Presentation - March 2019 - Aurobindo Pharma
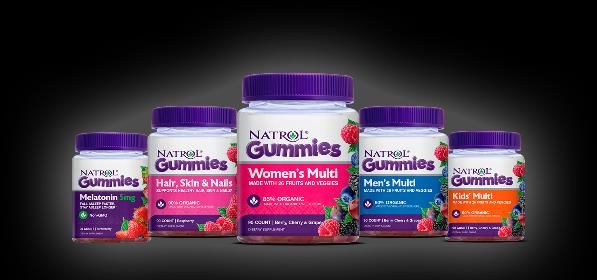
US Business Highlights

                            Revenue ($ Mn)                                                                                                                      Revenue Mix
                                                 1,156
                                                                                 Injectables                                                                                       Dietary                                 Orals
                                  1,019
                     930                                       939                   7%                                                                                          Supplements                               70%
      792                                                                                                                                                                           11%
                                                                                                                                                            Share of Non-
                                                                                                                                                           Orals significantly       OTC
                                                                                                                                                               improved              3%

                                                                                                                                                                                    Injectables
                                                                                                                                                  Orals                                 16%
                                                                                                                                                  93%
     FY15            FY16         FY17           FY18        9MFY19                                                                    FY14                                                                   9MFY19

          Cumulative ANDA Filings and Approvals                                                                                                                  Filing Mix
                                                                                                                                         304                                                         65
                                                              519

                                                                                                       Includes ANDAs of Orals, OTC,
                                                 478

                                                                                                          Dermatology, Nasals and
                                  429                         122
                     398

                                                                                   Non - Injectables
    376                                          117                                                                                                                                                                42
                                  115                          28

                                                                                                                                                                                     Injectables
                                                 34

                                                                                                                 Opthalmic
                  147
    183                           38
                                                                                                                                                          108
                     36
     27                                                       369
                                                 327
                                  276
                  215
    166
                                                                                                                                       Approved    Awaiting final                                  Approved    Awaiting final
                                                                                                                                                     approval                                                    approval
 31-Mar-15     31-Mar-16       31-Mar-17    31-Mar-18      31-Dec-18

    Final Approval          Tentative Approval         Under Review                                                                                                                                                                6
Tentative Approvals as on 31st Dec 2018 include 9 ANDAs approved under PEPFAR;                                      Awaiting final approval includes tentative approval
LEADING VERTICALLY INTEGRATED GENERIC PLAYER - Investor Presentation - March 2019 - Aurobindo Pharma
US Business – Segment Wise Highlights

            Orals                                                          Injectables
            •     70% of overall US business in 9MFY19                     •    16% of overall US business in 9MFY19
            •     Volume share increased to 5.2% (MAT Dec 2018) from       •    Volumes increased ~29%* (MAT Dec 18 vs. MAT Dec
                  4.3% (MAT Dec 2017)*                                          17)
            •     Filed 29 ANDAs and launched 29 products in 2018          •    Filed 18 ANDAs and lunched 9 products in 2018
            •     Future pipeline includes                                 •    Future pipeline includes
                       Controlled substances with ADF                             Complex injectables including microspheres
                       Oncology                                                   Oncology
                       505b2 products for select patient segments                 Hormones

            OTC                                                        Dietary Supplements

            •     3% of overall US business in 9MFY19                  •       11% of overall US business in 9MFY19
            •     Filed 5 ANDAs and Launched key products including    •       Introduced Gummies
                  Omeprazole tablets in 2018                           •       Future growth drivers includes
            •     Future pipeline includes                                        New product introduction
                       Rx to OTC switch opportunities                            Geographical expansion
                       Branded OTC

                                                                                                                                  7
*Data as per IQVIA;
LEADING VERTICALLY INTEGRATED GENERIC PLAYER - Investor Presentation - March 2019 - Aurobindo Pharma
US: Expanding Portfolio Mix Towards Differentiated Products

                             Portfolio mix is complemented with the introduction of high-value products

                                                                                          ANDAs        Addressable Market in US$ Bn

                                                                                                       16.1

                                    24.5
                                                                24.2
                                                                                                       161

                     6.0*
                                    91
                                                                 81              3.7                                                                0.7
       9.0                                                                                                                               4.6
                                                   1.4                                                                      0.7
                      42                                                                   0.4                     0.5                                        0.3
                                                                                 30                                                       21        30
       19                                          17                                      11                               12
                                                                                                                    2                                         2
  Anti Diabetic      ARV           CNS         Controlled       CVS          Gastro    Ophthalmics    Others      Penem    Resp       Oncology & SSP/Ceph Dermatology
                                              Substances                                                                              Hormones

    Addressable Market at US$ 92.1 Bn including ~US$ 61.1 Bn for Under Review and Tentatively approved ANDAs

          Future pipeline to include Oncology, Hormones, Depot injections, Inhalers, Biosimilars, topicals &
                                                     Patches
Addressable market refers to the market size as per IQVIA. Data is for the total 519 ANDAs filed by the company

*Does not include the addressable market of the products approved under PEPFAR                                                                                          8
Source: IQVIA MAT Dec 2018 data
LEADING VERTICALLY INTEGRATED GENERIC PLAYER - Investor Presentation - March 2019 - Aurobindo Pharma
Sandoz’s Dermatology and Oral Solids Businesses – Acquisition* overview

   Aurobindo Pharma USA Inc. entered into a definitive agreement with Sandoz Inc., USA to acquire
    its dermatology and oral solids businesses
   Acquired portfolio with c.70% revenue contribution by oral solids and c.30% by dermatology, before
    any potential FTC – led divestments
   The acquired portfolio is expected to generate over $0.9 billion in sales for the first 12 months after   Melville, Long Island, NY
    completion of the transaction for Aurobindo, before any potential FTC-led divestments
   Acquisition also adds 3 manufacturing facilities in the US
   Aurobindo would become the 2nd largest generic player in the US by number of prescriptions
   Acquired portfolio consists of authorized generics and in-licensed products opening up future
    opportunities for Aurobindo
                                                                                                              Hicksville, Long Island, NY
   Adds a leading dermatology franchise
                 #2 Dermatology player in the US
                 Dermatology presence across generics, branded and OTC
                 Well established dermatology focused commercial and manufacturing infrastructure
   Further diversified portfolio with addition of approximately 300 products including projects in
    development
   Significant synergy and value creation potential from the acquisition

                                                                                                                                            9
*Subject to regulatory approvals;
Aurobindo would become the 2nd Largest Generic Player in the US Post
            Sandoz’s businesses acquisition

           Market Share in the US by Number of Prescriptions Dispensed

                                     2nd                                4th

                            14.3%

                                    8.6%

                                    3.1%                 6.4%
                                                                5.7%   5.5%
                                                                              4.1%
                                                                                     3.3%   3.0%   3.0%   2.8%   2.8%   2.7%
                                    5.5%                                      3.1%

                                                                              1.0%
                                      Post-Acquisition

                                                                                                                               10
1) Source: IQVIA MAT Jul 2018
Acquisition of branded oncology injectables from Spectrum Pharmaceuticals - Overview
   Acrotech Biopharma, a step-down subsidiary of Aurobindo Pharma Limited has acquired portfolio of seven marketed oncology
    injectable products from Spectrum Pharmaceuticals
   Acquisition brings-in an experienced branded commercial infrastructure in the US
   Acquired portfolio is expected to generate a revenue of around $100 million for the first 12 months post completion of the
    transaction
   Transaction will be EPS accretive from first full year of ownership

                                                                                                Trusted community oncology
                                  Franchise provides                                            franchise providing practice
                                  leadership position in the                                    value and patient resources
                                  PTCL market                                                   in mCRC

                                   Market leading branded                                Highly effective and efficient
                                   conditioning agent in                                 radioimmunotherapy treatment for
                                   bone marrow transplant                                patients with FL

                                   Unique treatment option for patients in rare form ALL with material
                                   growth opportunity in broader ALL and NHL markets                                             11
EU Business Highlights

    Strong foothold in Europe                                                                         Revenue (€ Mn)

     •     Operations in 11 countries with full fledged Pharmacy, Hospital       13% CAGR in FY15 – FY18            577
           and Tender sales infrastructure with commercialized 450+ INNs
                                                                                                 434        446             450
     •     Ranks amongst the Top               10@
                                        Generic companies in four out of             413
           Top-5 EU countries. France & Germany are top 2 markets for the
           company
     •     Turned around loss-making business units through increasing a)
           switch to cost-competitive manufacturing locations and, b)
           operational efficiencies
                                                                                     FY15       FY16       FY17     FY18   9MFY19

 Recent Acquisition                                                              Key growth drivers

        Acquired Apotex Inc’s operations in 5 European countries in Feb          Portfolio Expansion through launches of targeted Day 1
         2019                                                                      products, Oncology range, Hormones, Niche low volume
           • Establishes Aurobindo as one of the leading generics                  Injectables and Orals. Pipeline of over 250 products
              companies in Europe                                                  under development
           • Gains well-established commercial network in 5 countries             Opportunity of > $ 5 Bn of addressable sales coming off
              including those in Eastern European countries i.e. Poland            patent in our key markets in near term (2019-2020) and
              and Czech Republic                                                   > $ 13 Bn in the medium term (2021-2022)#
           • Creates significant value opportunity through multiple
                                                                                  Future growth potential in countries like Italy, Spain,
              avenues for revenue growth and cost synergies
                                                                                   Portugal & France as the penetration of generics
                                                                                   improve
                                                                                                                                         12
# As per internal estimates – Excluding biologics; @ Source: IQVIA MAT Q4 2017
Aurobindo’s Footprint in Europe Post Apotex Acquisition

                           France                                                                 Spain: Existing + Acquired
►    Ranks #1 by volume for hospital segment;   5th                                ►   13th largest generic company
     position in the retail market
                                                                                   ►   Number of products total marketed: 182
►    Number of products currently marketed: 268
                         Germany                                                              Netherlands: Existing + Acquired
                                                                                   ►   3rd largest generic company, Ranks #1 in OTC
►    Ranked #7
                                                                                   ►   Number of products total marketed: 306
►    Number of products currently marketed : 239
                                                                                   ►   Oral solids manufacturing facility
                           Portugal
                                                                                                Belgium: Existing + Acquired
►    2nd largest generic company
►    Number of products currently marketed : 285                                   ►   Market Position: 5th (Gx)

►    Oral solids manufacturing facility                                            ►   Number of products total marketed: 90

                       United Kingdom                                                                  Poland: Acquired
                                                                                   ►   Market Position: 15th (Gx)
 ►   7th largest generic company
                                                                                   ►   Number of products total marketed: 62
 ►   Number of products currently marketed : 98
                            Italy                                                                  Czech Republic: Acquired
►   Market position: 8th                                                           ►   Ranks #10 among generic companies and
►   Number of products currently marketed : 164                                        #7 in OTC segment
                                                      Existing Presence            ►   Number of products total marketed: 76
                         Romania
                                                      Existing + Acquired
►    16th largest generic company
►    Number of products currently marketed : 42       Entry into new geographies

                                                                                                                                      13
Source: Data on file
Growth Markets & ARV Business – Highlights

Growth Markets Business                                                                           Revenue ($ Mn)
                                                                          14% CAGR in FY15-FY18
                                                                                                                   139
   Key markets includes Canada, Brazil and South Africa                                                                   130
                                                                                                       113
   Targeted to build branded generics presence in select markets             93          99

   In the process of strengthening       operations and portfolio in
    specific identified countries
   Future product launches in Oncology and specialty injectables
                                                                            FY15         FY16         FY17         FY18   9MFY19

ARV Business                                                                                      Revenue ($ Mn)

   Focus on global tenders floated by Multi-Lateral Organizations like                   185          177
    Global Fund, USAID/PEPFAR and Country specific MOH tenders                158
                                                                                                                   130
   Supplies life-saving ARV’s to ~3 Mn HIV patients spread over                                                            97
    more than 125 countries
   Comprehensive portfolio of 32 products in 1L Adults, 2L Adults
    and pediatric formulations
                                                                             FY15        FY16         FY17         FY18   9MFY19
   Filed over 1,100 ARV dossiers for registrations across the globe

                                                                                                                                   14
API Business - Highlights

   API capacity is strategic in-terms of vertical integration and supply reliability

   Additional investments are made for capacity creation and capability building

   Customers include innovator and large generic companies

   API business continue to focus on complex products with varying volumes

   Focus on continuous improvement of manufacturing processes to meet market needs

   Continue to have sustained growth in more advanced regulated markets (EU, Japan & USA)

   API facilities have been inspected by various regulatory authorities including USFDA and UK MHRA

                     Revenue ($ Mn)                                         Reaction Volumes (KL)

                                                                                                    6,759
                                                                                        6,676

                                                                               6,502

      443      442       454      460                               6,343
                                           357

     FY15     FY16       FY17    FY18    9MFY19                     FY15       FY16     FY17        FY18
                                                                                                            15
Consolidated Financial Performance – Q3FY19
                                                                     Q3         Q3      %       Q2      %
 Value $ Mn
                                                                    FY19       FY18    Chg     FY19    Chg
 Formulations                                                       605.1      555.9    8.9    562.6   7.6
 API                                                                128.3      119.2    7.6    116.7   9.9
 Formulations % of sales                                           82.5%       82.3%           82.8%

 Revenue from Operations                                            733.4      675.1    8.6    679.3   8.0

 Gross Profit                                                       400.8      392.1    2.2    387.2   3.5

 Overheads                                                          249.6      232.5    7.4    240.5   3.8

 EBIDTA (before Forex & other                                       151.2      159.7   -5.3    146.7   3.1
 income)                                                           20.6%       23.7%           21.6%
 Fx Gain / (Loss)                                                        7.0    1.1            -5.7
 Other Income                                                            1.9    4.0    -53.6    3.8    -50.3
 Finance Cost                                                            6.6    2.9    125.8    5.1    31.1
 Depreciation                                                        22.7      21.5     5.6    23.4    -3.0
 PBT from ordinary activities                                       130.7      140.4   -6.9    116.3   12.4
 Exceptional Item*                                                   -3.5       0.0            -3.8
 PAT (after JV share, minority
                                                                     99.1      92.6     7.0    87.4    13.4
 interest)

*Exceptional items for the period represents acquisition related costs
                                                                                                               16
Financial Performance

         Revenue from Operations ($ Mn)                                                     EBITDA & PAT Margin (%)                                  EPS (INR/Share)

                                         2,562                                                                            23.0                             39.3    41.4
                                                                                               22.8          22.8
                 2,137      2,253                                               21.2                                                               34.7
                                                      2,048                                    19.9          19.8         19.7      20.3
  1,986                                                                                                                                                                     30.4
                                                                                18.4                                                        27.0
                                                                                                                                    16.7
                                                                                                             15.3         14.7
                                                                                               14.5
                                                                                13.0                                                12.5

                                                                               FY15           FY16           FY17         FY18    9MFY19
   FY15          FY16       FY17         FY18       9MFY19
                                                                                           EBITDA Margin                  Adj PBT Margin   FY15    FY16    FY17    FY18    9MFY19
                                                                                           PAT Margin

        Gross Block & Fixed Asset Turnover                                                          Net debt / Equity                                Net Debt/EBITDA

1,000                                                          4                                                                           1.6
                                                                                 0.77
                                3.2                                                                                                                1.3
                     3.1
 750                                                                                           0.58
           2.7                              2.7       2.4      3                                                                                                             1.1
                                                                                                                                                                    0.9
 500                                                                                                                                                        0.8
                                                                                                             0.30        0.30     0.29
                                                               2
 250
           786       628       806       1,086      1,166
   0                                                           1
          FY15      FY16      FY17       FY18 9MFY19                             FY15         FY16    FY17       FY18            9MFY19    FY15    FY16     FY17    FY18   9MFY19
                  Gross Block ($ Mn)                                                             Net Debt/Equity                                      Net Debt/EBITDA
                  Gross Fixed Asset Turnover

                                                                                                                                                                                    17
    FY15 numbers are as per IGAAP; Gross Block is calculated as Tangible Assets + Intangible Assets excluding Goodwill
Debt Profile
         Fx Loan US$ Mn

                                        $ Mn                  Mar-16   Mar-17   Mar-18      Sep-18       Dec-18

   748       481      731   758   771   Fx Loan restated       748      481      731          758          771
                                        Rupee Loan              7       38        1            39          42
                                        Sales Tax Deferment     6        0        0             0           0
                                        Gross Debt             762      519      732          797          813
                                        Cash Balance           122      80       194          245          254
                                        Net Debt               640      439      538          551          559
                                        Finance Cost          1.8%     1.5%     2.0%          2.6%        3.3%

                                                                                       Fx Debt and Fx Cash Balance are reinstated
                                                                                                                                    18
Focus on Building a Diverse and Robust Specialty Products Portfolio

Oncology & Hormones        Peptides          Depot Injections    Controlled Substances

     Topicals         Transdermal Patches        Inhalers               Nasals

    Biosimilars            Vaccines         505(b)(2) products   Consumer Healthcare     19
Focus on Building a Diverse and Robust Specialty Products Portfolio (1/2)

                         Oncology &
                                                  Topicals                Nasals                Peptides          Depot Injection
                         Hormones
     Products
      under                   79                     22                      5                     14                     4
   development

   Addressable
   Market Size              $45 Bn                 $5 Bn                 $0.5 Bn                $12.2 Bn               $3.6 Bn

   Filing Status
                      ANDAs*: Oncology-                                                                             To start from
                                                 ANDAs*: 2              ANDAs*: 2            6 DMFs filed*
                       11 & Hormones- 8                                                                               2HFY20

                                                                                           Plans to file 5 more
    Filing Target
                      To file all products   To file all products   To file all products                           Plans to file all
                                                                                           DMFs over next 18
                      over next 3 years      over next 2-3 years          by FY20                                 products by FY22
                                                                                                months

      Products
      Approved            3 ANDAs*                    -                      -                  6 DMFs                    -

     Revenue
   generation to           Q1FY20                   FY21              FY20 / FY21                 FY21                  FY22
    start from

                                                                                                                                       20
*As on 31 Dec 2018;
Focus on Building a Diverse and Robust Specialty Products Portfolio (2/2)

                       Transdermal
                                                 Inhalers               Biologics          Vaccines
                         Patches
     Products
      under                   8                      9                      6*                1
   development

    Addressable
    Market Size           $3.2 Bn                $9.5 Bn                 $35 Bn            $6.2 Bn

   Filing to start
        from                FY20                   FY20                   FY21              FY21

    Filing Target
                     To file all products   To file all products   First set of products
                                                                                            FY21
                     over next 3 years      over next 3 years        to filed by FY22

      Products
      Approved                -                      -                       -                -

     Revenue
   generation to            FY21                   FY22                   FY22              FY22
    start from

                                                                                                      21
*First wave;
Enhanced Research & Development Capabilities

5 R&D centers in Hyderabad, India >1,500 scientists and analysts                                   R&D Spend – $ Mn (as % of revenue)

   Focused on difficult to develop APIs, peptides, etc.                                                                                  5.0%* 5.6%*
   Develop modern process technologies like enzyme chemistry                                                                    4.3%* 103
                                                                                                                      4.0%*                           92
   Dosage Form R&D for developing niche oral, sterile and specialty injectable products                    3.6%*                 81
                                                                                                  3.3%
   Portfolio of more than 800 products
                                                                                                            57         72
   Biologics: Developing diverse pipeline of biosimilars in Oncology and Immunology. CHO-         45
    GS based cell lines with productivity of ~ 4.0 g/L
                                                                                                 FY14      FY15      FY16       FY17      FY18 9MFY19
                                                                                                * calculated on revenues Ex acquired Actavis business and Generis

1 R&D center in Dayton, New Jersey – 25 scientists and analysts
   Developing depot injectable and tamper/abuse-resistant technology products
   Concentrating on development of various niche oral formulation and controlled substances
   Portfolio of more than 30 products

                                                                                                                                               APLRC-2
1 R&D center in Raleigh, North Carolina – 40 scientist and analysts
   Developing various respiratory and nasal products, including inhalers
   Dermal Delivery portfolio including transdermal and topical products
   Portfolio of more than 40 products

All R&D centres have world-class talent and are equipped with state of the art infrastructure
                                                                                                                                            Raleigh, NC             22
Supported by well qualified and trained Regulatory and Intellectual Property teams
Thank You

For updates and specific queries, please visit our website www. aurobindo.com

Investor Relations:
Phone: +91-40-66725401
          +91 98486 67906
Email:    ir@aurobindo.com

Corporate Office:
Water Mark Building, Level-6, Plot No.11, Survey No. 9, Kondapur, Hitech City,
Hyderabad - 500084

Registered Office:
Plot No. 2, Maitrivihar, Ameerpet, Hyderabad – 500038                            23
You can also read