Investor Presentation May 2016 - Mapletree Industrial Trust
←
→
Page content transcription
If your browser does not render page correctly, please read the page content below
Investor Presentation May 2016
Important Notice
This presentation shall be read in conjunction with Mapletree Industrial Trust’s (“MIT”) financial results for Fourth Quarter
Financial Year 2015/2016 in the SGXNET announcement dated 25 April 2016.

This presentation is for information only and does not constitute an offer or solicitation of an offer to sell or invitation to
subscribe for or acquire any units in Mapletree Industrial Trust (“Units”).

The past performance of the Units and MIT is not indicative of the future performance of MIT or Mapletree Industrial Trust
Management Ltd. (the “Manager”).

The value of Units and the income from them may rise or fall. Units are not obligations of, deposits in or guaranteed by the
Manager or any of its affiliates. An investment in Units is subject to investment risks, including the possible loss of the
principal amount invested. Investors have no right to request the Manager to redeem their Units while the Units are listed. It is
intended that unitholders may only deal in their Units through trading on the Singapore Exchange Securities Trading Limited
(“SGX-ST”). Listing of the Units on the SGX-ST does not guarantee a liquid market for the Units.

This presentation may also contain forward-looking statements that involve risks and uncertainties. Actual future
performance, outcomes and results may differ materially from those expressed in forward-looking statements as a result of
risks, uncertainties and assumptions. Representative examples of these factors include general industry and economic
conditions, interest rate trends, cost of capital, occupancy rate, construction and development risks, changes in operating
expenses (including employees wages, benefits and training costs), governmental and public policy changes and the
continued availability of financing. You are cautioned not to place undue reliance on these forward-looking statements, which
are based on current view of management on future events.

Nothing in this presentation should be construed as financial, investment, business, legal or tax advice and you should
consult your own independent professional advisors.

2
Agenda

    1    Overview of Mapletree Industrial Trust

    2    Portfolio Highlights

    3    4Q & FY15/16 Financial Performance

    4    Outlook and Strategy

3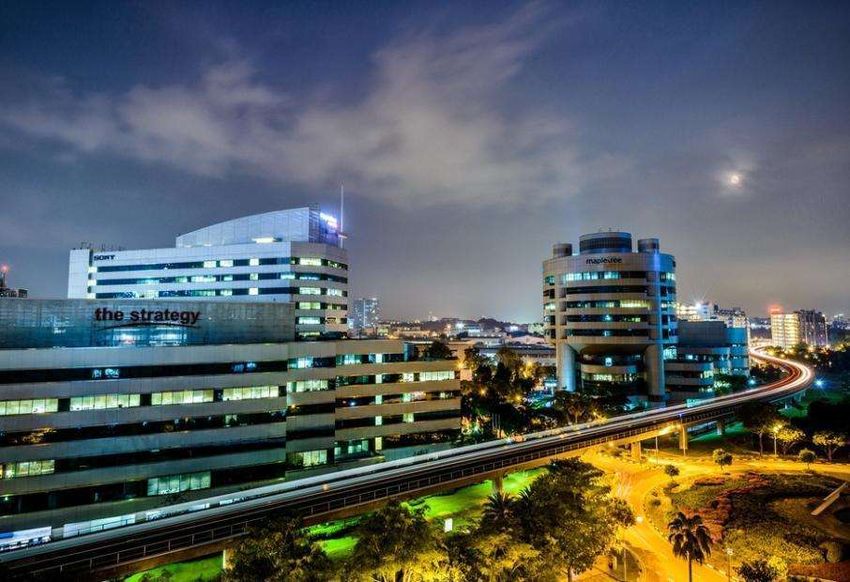
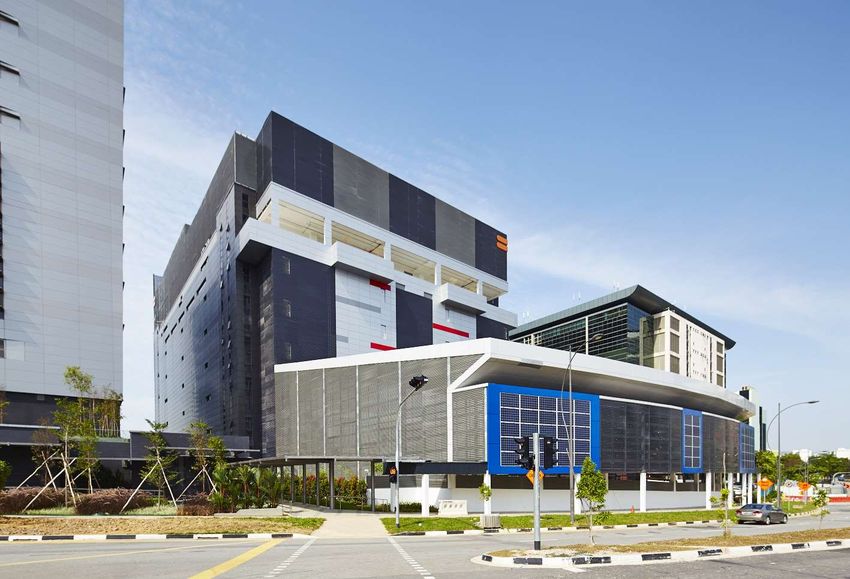
OVERVIEW OF
MAPLETREE INDUSTRIAL TRUST

Hi-Tech Building,
Build-to-Suit Data Centre for Equinix
Overview of Mapletree Industrial Trust
             Mapletree Investments Pte Ltd              Public & Inst
                                                                                            MIPL
Sponsor      (“MIPL”)                                   Unitholders

             Owns 34.2% of MIT                         65.8%                                     34.2%
                                                                                                                Trustee

             Focused on industrial real estate
Investment   assets in Singapore, excluding                                                                    Manager
mandate      properties primarily used for logistics
             purposes
                                                                                                               Property
                                                                        MIT Portfolio
             85 properties valued at S$3.6 billion                                                             Manager

             19.7 million sq ft GFA                                                Light Industrial
Portfolio                                                                             Buildings
                                                                                        2.7%
             14.8 million sq ft NLA                            Stack-up/Ramp-up
                                                                   Buildings                             Flatted Factories
                                                                     12.6%
             Mapletree Industrial Trust                                                                        44.0%

Manager      Management Ltd.
             100% owned by the Sponsor                  Business Park
                                                          Buildings
                                                           15.8%
             Mapletree Facilities Services                                     Portfolio Value
Property     Pte. Ltd.
Manager                                                                           S$3.6 billion
             100% owned by the Sponsor

Trustee      DBS Trustee Limited
                                                         Hi-Tech Buildings
                                                              24.9%

                                                                                  As at 31 Mar 2016
5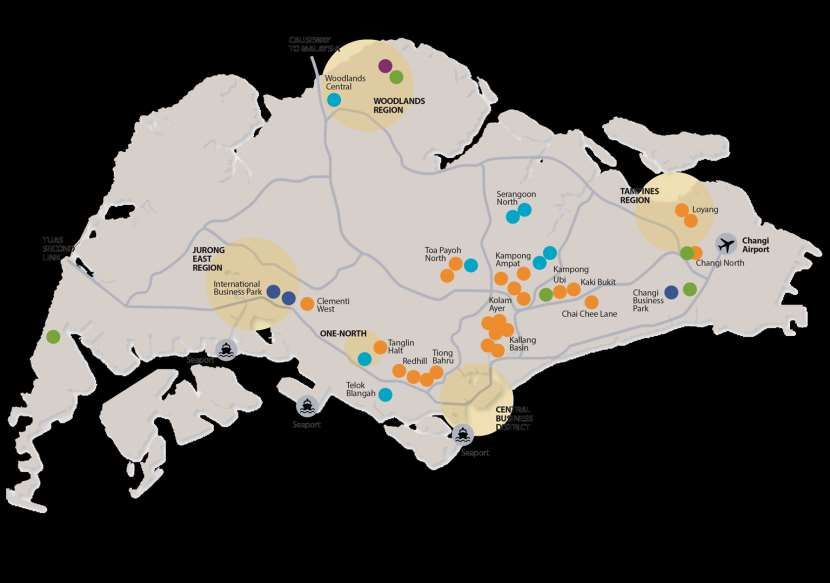
Broad Spectrum of Industrial Facilities
      FLATTED FACTORIES                                 STACK-UP/RAMP-UP
                                                        BUILDINGS
      High-rise multi-tenanted industrial buildings
      with basic common facilities used for light       Stacked-up factory space with vehicular
      manufacturing activities.                         access to upper floors. Multi-tenanted space
                                                        suitable for manufacturing and assembly
                                                        activities.

      HI-TECH BUILDINGS                                 LIGHT INDUSTRIAL
                                                        BUILDINGS
      High specification industrial space with higher
      office content for tenants in technology and      Multi-storey developments usually
      knowledge-intensive sectors. Usually fitted       occupied by an anchor tenant for light
      with air-conditioned lift lobbies and common      manufacturing activities.
      areas.

      BUSINESS PARK BUILDINGS
      Multi-storey suburban office buildings in
      specially designated “Business Park zones”.
      Serve as regional headquarters for MNCs as
      well as space for R&D and knowledge-
      intensive enterprises.

6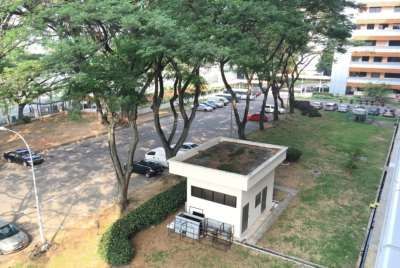
Strategically Located across Singapore
    Close to Public Transportation Networks and Established Industrial Estates
                                                                  Flatted Factories
                                                                  Hi-Tech Buildings
                                                                  Business Park Buildings
                                                                  Stack-up/Ramp-up Buildings
                                                                  Light Industrial Buildings
                                                                  Major Expressways
                                                                  Ongoing development projects

7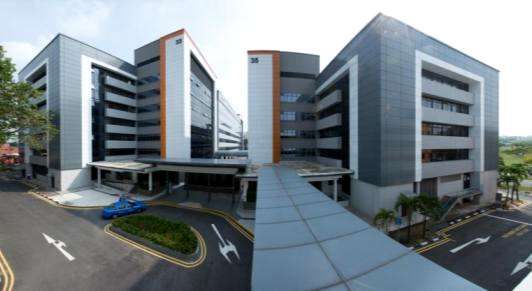
Sustainable and Growing Returns
 Distributable Income                                                                                                                 DPU (cents)
      (S$ million)
60                                                                                                                                          3.00
                                                                                                                           2.79 2.82 2.81
                                                                                                                    2.73
                                                                                                        2.67 2.65
                                                                                                 2.60
                                                                              2.51 2.51 2.51                                    50.3 50.4
                                                                    2.43 2.47
50                                                         2.37                                                     48.2 48.9               2.50
                                                 2.29 2.32                                                 46.7
                                       2.22 2.26                                                 45.4 46.0
                                2.16
                         2.05                                                   42.2 42.6 42.8
             1.93 1.98                                              40.2 41.1
40                                                           38.9                                                                           2.00
                                            36.9 37.5 37.7
                                35.2 35.8
      1.52               31.6
30           28.3 29.0                                                                                                                      1.50

      22.3

20                                                                                                                                          1.00

10                                                                                                                                          0.50

 0                                                                                                                                          0.00
      3Q¹    4Q   1Q     2Q     3Q     4Q   1Q    2Q    3Q    4Q    1Q    2Q    3Q   4Q   1Q     2Q     3Q   4Q     1Q     2Q   3Q   4Q
      FY10/11            FY11/12                  FY12/13                 FY13/14                FY14/15                   FY15/16

                                                 Distributable Income (S$ million)        DPU (cents)
      ¹
          MIT was listed on 21 Oct 2010.

  8
Comparative Trading Performance since IPO1,2
        Unit Price and Market Cap                           S$                  Return on Investment                                  %
        Closing Unit price                                1.615                 Total Return⁴                                    130.2
        Market Capitalisation                         2.9 billion³              Capital Appreciation                                 73.7
                                                                                Distributions                                        56.5

               200.0%
                                                                                                                       MIT Unit Price
                                                                                                                          +73.7%

               150.0%
                                                                                                                    FTSE ST REITS Index
                                                                                                                          +4.4%

               100.0%

                                                                                                                FTSE Straits Times
                                                                                                                      Index
                                                                                                                     -13.1%
                50.0%

                  0.0%
                     Oct 10              Oct 11              Oct 12              Oct 13              Oct 14             Oct 15

                        Rebased MIT Unit Price          Rebased FTSE ST REITs Index             Rebased FTSE Straits Times Index
    1     Rebased MIT’s issue price of S$0.93 and opening unit prices of FTSE ST REITs Index and
          FTSE Straits Times Index on 21 October 2010 to 100.
    2     All information as at 20 May 2016. Source: Bloomberg.
    3     Based on MIT’s closing unit price of S$1.615 on 20 May 2016 and total units in issue 1,801,250,264.
9   4     Sum of distributions and capital appreciation for the period over the issue price of S$0.93.
Significant Events
2011 2012 2013 2014 2015 2016
Jul Mar Jan Jan Jan Mar
Acquired tranche 2 S$125 million Implemented TOP for AEI at Toa TOP and BCA-IDA S$60 million
of JTC’s 2nd Phase 7-year 3.75% Fixed Distribution Payoh North 1 Green Mark 10-year 3.79%
Divestment Rate Notes Reinvestment Plan Cluster Platinum Award Fixed Rate Notes
Exercise Portfolio (Maiden Issuance) (DRP) (S$40 million) (New Data
(S$400 million) Centres) for
Equinix
(S$108 million)
Jul Sep Jul Mar May
S$176.9 million S$45 million Temporary Redevelopment of S$75 million
Equity Fund 10-year 3.65% Occupation Permit the Telok Blangah 8-year 3.02% Fixed
Raising Exercise Fixed Rate Notes (TOP) for asset Cluster into a build- Rate Notes
enhancement to-suit (BTS) facility
initiative (AEI) at for Hewlett-Packard
Woodlands Central (S$226 million)
Cluster
(S$30 million)
Oct May Oct
TOP and BCA Acquired Light New AEI at Kallang
Green Mark Gold Industrial Building Basin 4 Cluster
Award (Buildings) at Changi North (S$77 million)
for K&S Corporate (S$14 million)
Headquarters
(S$50 million)
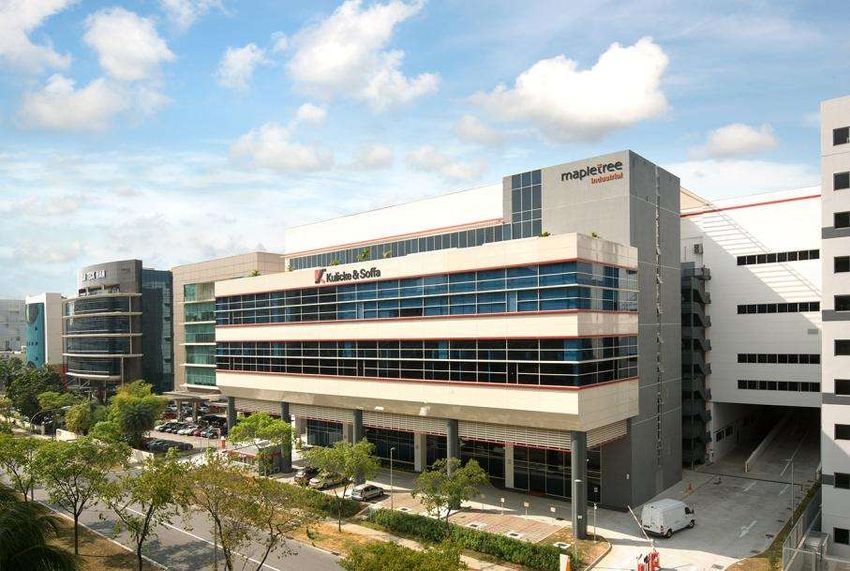
10PORTFOLIO HIGHLIGHTS Hi-Tech Building, K&S Corporate Headquarters
Resilient Portfolio Performance
                                                                                                                                                  Gross Rental Rate
Occupancy
                                                                                                                                                     S$ psf/mth
  100%
                                                                  95.4% 95.5%
                        94.3% 94.5% 95.1% 95.0% 94.9% 95.0% 95.2%              93.9%                                      93.5% 93.8%
                                                                                                                                       94.7% 94.6%
            92.3% 93.2%                                                              92.5%
                                                                                           91.3% 90.7% 91.5% 90.8%
                                                                                                                    90.2%
   90%                                                                                                                                        $1.90        $2.00
                                                                                                                           $1.86 $1.88 $1.89
                                                                                                        $1.82 $1.83 $1.84
                                                                                            $1.75 $1.77
                                                                         $1.71 $1.70 $1.73
   80%                                                             $1.68
                                                                    $1.59    $1.61
                                    $1.54           $1.55   $1.56
                            $1.52           $1.53
                    $1.49
   70%      $1.45
                                                                                                                                                           $1.50

   60%

   50%
                                                                                                                                                           $1.00
   40%

   30%

                                                                                                                                                           $0.50
   20%

   10%

    0%                                                                                                                                                     $0.00
            3Q      4Q      1Q      2Q      3Q      4Q      1Q      2Q        3Q     4Q   1Q   2Q    3Q    4Q   1Q      2Q   3Q   4Q   1Q   2Q   3Q   4Q
             FY10/11                 FY11/12                         FY12/13                   FY13/14                  FY14/15             FY15/16
                                                                            Occupancy (LHS)         Rental Rate (RHS)
    12
Segmental Occupancy Levels
97.4% 96.2% 100.0% 99.7%
94.8% 94.7% 94.7% 94.6%
92.1% 93.4% 90.3% 90.1%
Flatted Factories Hi-Tech Buildings Business Park Stack-Up/Ramp-Up Light Industrial MIT
Buildings Buildings Buildings Portfolio
Left Bar Right Bar
(3QFY15/16) (4QFY15/16)
13Rental Revisions
Gross Rental Rate (S$ psf/mth)¹
Before Renewal
$4.17 After Renewal
$3.92
New Leases
$3.62
Passing Rent
$3.85
$2.34
$2.23 $2.14
$1.79 $1.84 $1.68 $2.12
$1.60
$1.42 $1.45
$1.77
$1.27
Flatted Factories Hi-Tech Buildings Business Park Buildings Stack-Up/Ramp-Up Buildings
Renewal 67 Leases 7 Leases 21 Leases 5 Leases
Leases (201,082 sq ft) (19,307 sq ft) (115,941 sq ft) (57,383 sq ft)
New 30 Leases 9 Leases 2 Leases 1 Lease
Leases (75,314 sq ft) (34,595 sq ft) (4,112 sq ft) (3,972 sq ft)
For period 4QFY15/16
¹ Gross Rental Rate figures exclude short term leases; except Passing Rent figures which include all leases.
14Healthy Tenant Retention
LONG STAYING TENANTS RETENTION RATE FOR 4QFY15/16
Up to 1 yr
>10 yrs 94.9%
8.0% 91.3%
17.0%
>1 to 2 yrs 79.4%
9.8% 69.2% 71.8%
4 years or
less,
37.7% > 2 to 3 yrs
More than 4 12.9%
years 23.6%
62.3%
>3 to 4 yrs
7.0% Flatted Hi-Tech Business Stack-Up / Light Portfolio
>5 to 10 yrs Factories Buildings Park Ramp-Up Industrial
35.4% Buildings Buildings Buildings
>4 to 5 yrs
9.9% Based on NLA.
As at 31 Mar 2016
By number of tenants.
62.3% of the tenants have leased the properties for more than 4 years
Tenant retention rate of 71.8% in 4QFY15/16
15Lease Expiry Profile
EXPIRING LEASES BY GROSS RENTAL INCOME (%)
31.4%
24.1%
21.1%
13.0%
10.4%
FY16/17 FY17/18 FY18/19 FY19/20 FY20/21 & Beyond
Flatted Factories Hi-Tech Buildings Business Park Stack-up / Ramp-up Light Industrial
Buildings Buildings Buildings
Portfolio WALE by Gross Rental Income = 2.8 years
As at 31 Mar 2016
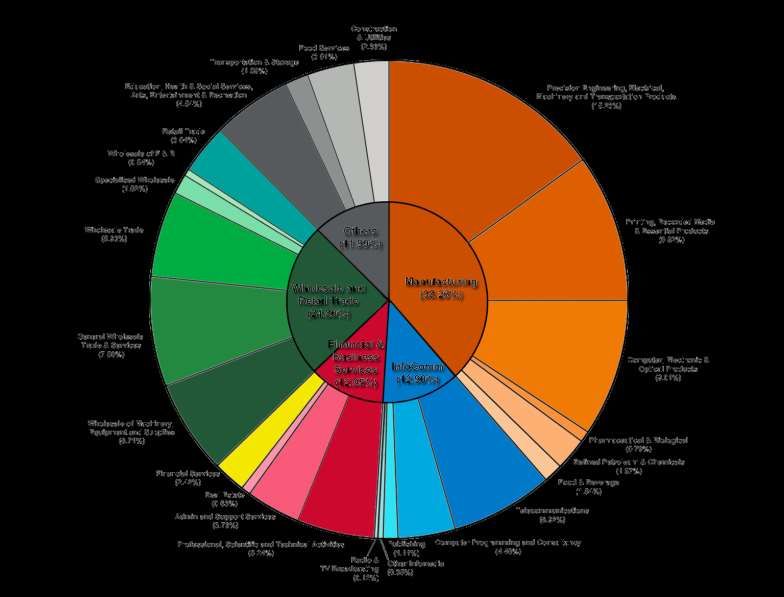
16Large and Diversified Tenant Base
TOP 10 TENANTS (BY GROSS RENTAL INCOME)
Over 2,000 tenants
Largest tenant contributesTenant Diversification Across Trade Sectors
No single trade sector accounted >16% of Portfolio’s Gross Rental Income
By Gross Rental Income
18 As at 31 Mar 2016BTS – Hewlett-Packard
Property GFA Estimated Cost Date of Completion
2 Hi-Tech Buildings 824,500 sq ft S$226 million¹ Phase 1 : By 4Q2016
Phase 2 : By 2Q2017
Phase 2: Superstructure works in progress Artist’s impression of completed development
S$226 million¹ BTS project for Hewlett-Packard on track for completion
Unlocking value by almost doubling GFA to 824,500 sq ft
100% committed by Hewlett-Packard for lease term of 10.5² + 5 + 5 years
with annual rental escalations3
¹ Includes book value of S$56 million (as at 31 Mar 2014) prior to commencement of redevelopment.
² Includes a rent-free period of six months.
3 Hewlett-Packard will pay gross rents and MIT will be responsible for property tax and
19 property operating expenses.AEI – Kallang Basin 4 Cluster
Location Additional GFA Estimated Cost Date of Completion
26, 26A, 28 & 30
336,000 sq ft1 S$77 million 1Q2018
Kallang Place
Development of Hi-Tech Building at existing car park Artist’s impression of new Hi-Tech Building
Development of 14-storey1 Hi-Tech Building (at existing car park) and
improvement works to existing buildings
Located at Kallang iPark, an upcoming industrial hub for high value-
add and knowledge-based businesses
Well-served by major expressways and public transportation
1 Obtained provisional permission from Urban Redevelopment Authority on 28 March 2016. The increase in number of storeys
20 (from 13-storey to 14-storey) was due to the higher approved gross floor area of approximately 336,000 sq ft.Committed Sponsor with Aligned Interest
REPUTABLE SPONSOR BENEFITS TO MIT
1. Leverage on Sponsor’s network
Leverage on Mapletree’s financial strength,
market reach and network
Leading Asia-focused real estate and
2. Alignment of Sponsor’s interest with
capital management company
Unitholders
Mapletree’s stake of 34.2% demonstrates
Owns and manages in excess of
support in MIT
S$30.0 billion of office, logistics,
industrial, residential, corporate
3. In-house development capabilities
lodging/serviced apartments and retail
Able to support growth of MIT by providing
properties
development capabilities
Manages 4 Singapore-listed real estate
4. Right of First Refusal to MIT
investment trusts and 5 private equity real
Sponsor has granted right of first refusal to
estate funds with assets in Singapore and
MIT over future sale or acquisition of
across Asia
industrial or business park properties in
Singapore¹
Operates out of 9 countries in Asia Pacific
Sponsor won the government tender for a
and Europe, with assets in Asia, Australia,
126,700 sq ft industrial site located next to
Europe and USA
Tai Seng MRT Station
¹ Excluding Mapletree Business City.
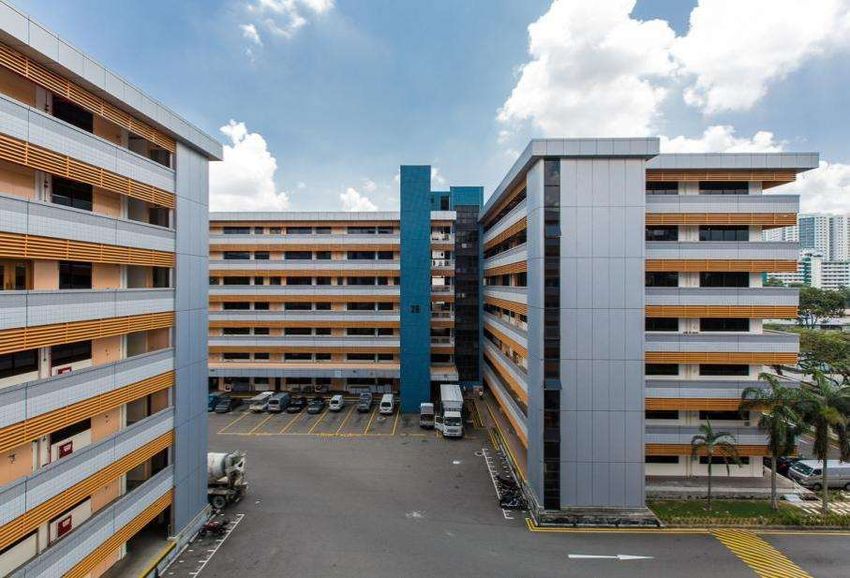
214Q & FY15/16 FINANCIAL PERFORMANCE Flatted Factory, Kallang Basin 4 Cluster
4Q & FY15/16 Results Highlights
Growth driven by contribution from completed BTS data centre for Equinix and
resilient portfolio performance
FY15/16 Distributable Income: S$197.8 million ( 9.4% y-o-y)
FY15/16 DPU: 11.15 cents ( 6.9% y-o-y)
4QFY15/16 Distributable Income and DPU were S$50.4 million and 2.81 cents respectively
Resilient portfolio performance in 4QFY15/16
Healthy average portfolio occupancy of 94.6%
Stable average portfolio passing rental rate of S$1.90 psf/mth
Continued momentum in growing the Hi-Tech Buildings segment
Redevelopment at Telok Blangah Cluster on track for completion
Commencement of AEI at Kallang Basin 4 Cluster
Increase in portfolio value of S$133.7 million
Portfolio revaluation gain of S$82.0 million and capitalised cost of S$51.7 million from
development and improvement works
Proactive capital management
Successfully issued S$60 million 3.79% 10-year medium term notes (MTN), extending the
maturity profile to FY25/26
23Statement of Total Returns (Year-on-Year)
4QFY15/16 4QFY14/15
/ ()
(S$’000) (S$’000)
Gross revenue 83,992 79,408 5.8%
Property operating expenses (21,974) (21,637) 1.6%
Net property income 62,018 57,771 7.4%
Interest on borrowings (6,633) (6,185) 7.2%
Trust expenses (7,073) (6,807) 3.9%
Net income 48,312 44,779 7.9%
Net fair value gain on investment properties
81,964 197,424 (58.5%)
and investment properties under development
Total return for the period before tax 130,276 242,203 (46.2%)
Income tax (expense) / credit (*) 7¹ (102.6%)
Total return for the period after tax 130,276 242,210 (46.2%)
Net non-tax deductible items (79,893) (195,484) (59.1%)
Amount available for distribution 50,383 46,726 7.8%
Distribution per Unit (cents) 2.81 2.65 6.0%
* Amount less than S$1,000
Footnote:
¹ The income tax credit relates to adjustment passed upon finalisation of industrial building allowance claimed
24 when MIT was a private trust.Statement of Total Returns (Year-on-Year)
FY15/16 FY14/15
/ ()
(S$’000) (S$’000)
Gross revenue 331,598 313,873 5.6%
Property operating expenses (86,482) (85,260) 1.4%
Net property income 245,116 228,613 7.2%
Interest on borrowings (25,923) (23,785) 9.0%
Trust expenses (28,577) (26,836) 6.5%
Net income 190,616 177,992 7.1%
Net fair value gain on investment properties
81,964 197,424 (58.5%)
and investment properties under development
Total return for the period before tax 272,580 375,416 (27.4%)
Income tax expense (*) (1,076)1 (100.0%)
Total return for the period after tax 272,580 374,340 (27.2%)
Net non-tax deductible items (74,750) (193,503) (61.4%)
Amount available for distribution 197,830 180,837 9.4%
Distribution per Unit (cents) 11.15 10.43 6.9%
* Amount less than S$1,000
Footnote:
¹ The income tax expense relates mainly to industrial building allowances claimed when MIT was a private trust,
25 which has been disallowed by the Inland Revenue Authority of Singapore.Statement of Total Returns (Qtr-on-Qtr)
4QFY15/16 3QFY15/16
/ ()
(S$’000) (S$’000)
Gross revenue 83,992 83,251 0.9%
Property operating expenses (21,974) (21,372) 2.8%
Net property income 62,018 61,879 0.2%
Interest on borrowings (6,633) (6,443) 2.9%
Trust expenses (7,073) (7,203) (1.8%)
Net income 48,312 48,233 0.2%
Net fair value gain on investment properties
81,964 - N.M.**
and investment properties under development
Total return for the period before tax 130,276 48,233 170.1%
Income tax expense (*) - N.M.**
Total return for the period after tax 130,276 48,233 170.1%
Net non-tax deductible items (79,893) 2,075 (3,950.3%)
Amount available for distribution 50,383 50,308 0.1%
Distribution per Unit (cents) 2.81 2.82 (0.4%)
* Amount less than S$1,000
N.M.** - Not meaningful.
26Balance Sheet
31 Mar 2016 31 Dec 2015 / () 31 Mar 2015 / ()
Total Assets (S$’000) 3,623,941 3,532,645 2.6% 3,515,954 3.1%
Total Liabilities (S$’000) 1,158,717 1,164,144 (0.5%) 1,203,771 (3.7%)
Net Assets Attributable to
2,465,224 2,368,501 4.1% 2,312,183 6.6%
Unitholders (S$’000)
Net Asset Value per Unit (S$) 1.37 1.33 3.0% 1.32 3.8%
27Portfolio Valuation
Property segment Valuation as at Valuation as at Capitalisation rate
31 Mar 2016 (S$ m) 31 Mar 2015 (S$ m)
Flatted Factories 1,566.4 1,531.2 6.50% to 7.25%
Hi-Tech Buildings¹ 886.0 805.9 6.50% to 7.00%
Business Park Buildings 561.5 549.8 6.00%
Stack-up/Ramp-up Buildings 447.8 441.2 7.00%
Light Industrial Buildings 96.2 96.1 6.50% to 6.75%
Total 3,557.9 3,424.2
Valuation of portfolio increased 3.9% to S$3,557.9 million; increase in valuation was due to a portfolio
revaluation gain of S$82.0 million and capitalised cost of S$51.7 million from development and
improvement works
Revaluation gain of S$82.0 million was driven by improved portfolio performance, construction progress
at Telok Blangah Cluster¹ and commencement of AEI at Kallang Basin 4 Cluster2
Net Asset Value per Unit increased from S$1.32 as at 31 March 2015 to S$1.37 as at 31 March 2016
1
The redevelopment of the Telok Blangah Cluster as a BTS facility for Hewlett-Packard Singapore had commenced in FY14/15.
On 31 March 2015, the Telok Blangah Cluster was reclassified from a Flatted Factory Cluster to a Hi-Tech Building Cluster.
² The AEI involves the development of a new 14-storey high specification building which obtained provisional permission from Urban
Redevelopment Authority on 28 March 2016.
28Strong Balance Sheet
31 Mar 2016 31 Dec 2015
Strong balance sheet to
pursue growth opportunities
Total Debt S$1,022.4 million S$1,039.6 million
Proceeds of S$22.9 million
Aggregate from distribution
28.2% 29.3%
Leverage Ratio
reinvestment plan (DRP) in
Weighted Average
4.0 years 3.6 years 3QFY15/16 mainly used to
Tenor of Debt
fund project requirements
and repay loans drawn
previously to fund
completed projects
No DRP for 4QFY15/16
Distribution
‘BBB+’ rating with Stable
Outlook by Fitch Ratings
100% of loans unsecured
with minimal covenants
29Well Diversified Debt Maturity Profile
DEBT MATURITY PROFILE
Successful issuance of S$60 million 3.79% 10-year MTN on 2 Mar 2016
Weighted average tenor of debt was 4.0 years
25.9%
18.1%
14.9%
265.0
125.0
9.1% 9.8%
7.3%
152.1 5.9%
4.6% 100.0 4.4%
92.9
60.0 75.0 60.0
47.4 45.0
FY16/17 FY17/18 FY18/19 FY19/20 FY20/21 FY21/22 FY22/23 FY23/24 FY24/25 FY25/26
Bank Borrowings (S$ million) MTN (S$ million)
As at 31 Mar 2016
30Interest Rate Risk Management
31 Mar 2016 31 Dec 2015 88.0% of debt is hedged for
a weighted average term of
Fixed as a % of 2.7 years
88.0% 85.6%
Total Debt
Weighted Average
2.7 years 2.1 years In total, S$470 million of
Hedge Tenor
hedges will expire in
FY16/17, of which
4QFY15/16 3QFY15/16
S$210 million has been
extended/replaced
Weighted Average
2.5% 2.4%
All-in Funding Cost
Replacements of expiring
Interest Coverage interest rate hedges are
8.0 times 8.3 times
Ratio*
expected to be more costly
in view of historical low
interest rates of these
* Includes capitalised interest.
expiring hedges
31OUTLOOK AND STRATEGY Business Park Buildings, The Strategy and The Synergy
Singapore Industrial Market
DEMAND AND SUPPLY FOR MULTI-USER FACTORIES DEMAND AND SUPPLY FOR BUSINESS PARKS
('000 sq m) Occupancy Rate (%) ('000 sq m) Occupancy Rate (%)
600 100 600 100
94.7%
500 95 500 95
90.1%
400 90 400 90
300 87.3% 85 300 85
81.7%
200 80 200 80
100 75 100 75
0 70 0 70
-100 65
-100 65
-200 60
-200 60
2006 2007 2008 2009 2010 2011 2012 2013 2014 2015 1Q2016 2016F
2006 2007 2008 2009 2010 2011 2012 2013 2014 2015 1Q 2016 2016F
Net New Demand Net New Supply Occupancy Rate MIT 4QFY15/16 Occupancy Rate
Net New Demand Net New Supply Occupancy Rate MIT 4QFY15/16 Flatted Factories' Occupancy Rate
Total stock for factory space: 35.8 million sq m
Potential net new supply of about 2.1 million sq m (~5.8% of existing stock) in 2016, of which
Multi-user factory space accounts for 0.5 million sq m (~4.4% of existing stock)
Business park space accounts for 0.3 million sq m (~13.2% of existing stock)
Average rents for industrial real estate for 4QFY15/16
Multi-user Factory Space: S$1.88 psf/mth (-1.1% q-o-q)
Business Park Space: S$4.29 psf/mth (No change q-o-q)
33 Source: URA/JTC Realis, 28 Apr 2016Outlook
The economy grew by 1.8% year-on-year in the quarter ended 31 Mar 2016,
same pace of growth in preceding quarter¹. For 2016, MTI has maintained the
GDP growth forecast at 1.0 to 3.0%².
The business environment is expected to remain challenging, given the muted
global economic outlook and large supply of industrial space in Singapore.
In addition, the ongoing economic restructuring in Singapore is expected to
result in the cost increase of outsourced service contracts.
Continued focus on active asset management & prudent capital management
Focusing on tenant retention to maintain portfolio occupancy
Shifting towards performance-based contracts where feasible to manage
cost pressures
Implementing appropriate interest rate hedging strategies
¹ Ministry of Trade and Industry (Advance Estimates), 14 Apr 2016
² Ministry of Trade and Industry, 24 Feb 2016
34To Deliver Sustainable and Growing Returns
SECURE investments to IMPROVE competitiveness
deliver growth and of properties
diversification
Value- Implement proactive
Pursue DPU-accretive Proactive marketing and leasing
creating
acquisitions and Asset initiatives
Investment
development projects Management
Management Deliver quality service and
Secure BTS projects with customised solutions
pre-commitments from Improve cost effectiveness
high-quality tenants to mitigate rising operating
Consider opportunistic costs
divestments Prudent Capital Unlock value through asset
Management enhancements
OPTIMISE capital structure to
provide financial flexibility
Maintain a strong balance sheet
Diversify sources of funding
Employ appropriate interest rate
35 management strategiesEnd of Presentation
For enquiries, please contact Ms Melissa Tan, Vice President, Investor Relations,
DID: (65) 6377 6113, Email: melissa.tanhl@mapletree.com.sgYou can also read