Shock-Wave Properties and Deformation-Induced Structure of Commercial-Purity Titanium
←
→
Page content transcription
If your browser does not render page correctly, please read the page content below
ISSN 0031-918X, Physics of Metals and Metallography, 2021, Vol. 122, No. 8, pp. 794–799. © The Author(s), 2021. This article is an open access publication.
Russian Text © The Author(s), 2021, published in Fizika Metallov i Metallovedenie, 2021, Vol. 122, No. 8, pp. 851–857.

                                                                        STRENGTH
                                                                      AND PLASTICITY

          Shock-Wave Properties and Deformation-Induced Structure
                      of Commercial-Purity Titanium
       A. V. Pavlenkoа, A. V. Dobromyslovb, N. I. Talutsb, *, S. N. Malyuginaа, and S. S. Mokrushinа
           а RussianFederal Nuclear Center–Zababakhin All-Russian Scientific Research Institute of Technical Physics,
                                          Snezhinsk, Chelyabinsk oblast, 456770 Russia
          b
            Mikheev Institute of Metal Physics, Ural Branch, Russian Academy of Sciences, Ekaterinburg, 620108 Russia
                                                 *e-mail: NinaTaluts@imp.uran.ru
                                        Received January 12, 2021; revised April 1, 2021; accepted April 5, 2021

         Abstract—The shock compressive wave profiles of commercial-purity titanium samples under different load-
         ing conditions have been measured. The spall strength of titanium as a function of the strain rate and tem-
         perature of deformation has been found. High-rate plastic deformation mechanisms have been studied. High-
         rate plastic deformation under the investigated loading conditions has been shown to occur by slip and twin-
         ning. The α → ω transformation has been established to begin at 12.2 GPa.

         Keywords: titanium, shock-wave loading, dynamic strength, high-rate plastic deformation, structure
         DOI: 10.1134/S0031918X2108010X

                   INTRODUCTION                                                          velocity profiles. Therefore, this work aims to analyze
    A rather large number of works are devoted to the                                    the free-surface velocity profiles and to analyze the
investigation of titanium behavior under shock loading                                   structure and microstructure of VT1-0 titanium sam-
[1–12]. A major part of them deals with the investiga-                                   ples after shock loading performed at various strain
tion of the mechanisms of plastic deformation and                                        rates in the α-phase region.
fracture under plane shock-wave loading of commer-
cial-purity VT1-0 titanium. Dynamic yield strength is                                                       EXPERIMENTAL
less sensitive to material composition, structure, and
test temperature than yield strength [1]. An increase in                                     The object of the investigation was commercial-
temperature from 20 to 600°C does not affect the                                         purity VT1-0 titanium. The total amount of additives
resistance to high-rate plastic deformation [2]. An                                      in it (Si, Fe, O, H, N, C, other impurities) did not
annealing-induced decrease in dislocation density                                        exceed 0.97 wt %.
reduces the hardness of the material, but increases its                                      The shock-wave experiments were carried out with
dynamic yield strength considerably [3]. High-rate                                       the help of single-stage gas gun with a caliber of 44 mm,
deformation results in the formation of shear bands in                                   at the Russian Federal Nuclear Center–Zababakhin
the fracture region and adiabatic shear bands [4, 5].                                    All-Russian Scientific Research Institute of Technical
    Impact compression of titanium causes the α → ω                                      Physics. The collision velocity was measured by the
transformation. According to different data [6–9], this                                  electrocontact technique with an error of 0.2% [13].
transformation occurs at different pressures. The pres-                                      A VT1-0 titanium rod 35 mm in diameter was the
sure depends on impurities in titanium, in particular,                                   initial workpiece for samples and impactors. The sam-
the presence of oxygen [8]. The thickness of the sam-                                    ples were cut perpendicularly to the rod axis. The sam-
ple, the peak shock-wave pressure, the loading tech-                                     ples and impactors were cut in the shape of disks with a
nique, and the temperature also affect the transforma-                                   diameter of 34 mm and a thickness from 0.3 to 10 mm.
tion pressure.                                                                               The velocity profiles of the free sample surface
    The majority of the data were obtained from the                                      were analyzed to find the elastic-plastic properties of
analysis of complete wave profiles. There are virtually                                  the material under study. The free surface velocity pro-
no structural studies of VT1-0 titanium after different                                  files were recorded at a time resolution of 2 ns and a
loading conditions. The structural data available in the                                 measurement accuracy in the velocity range under
literature are often limited only to X-ray diffraction                                   study of not less than 1% using VISAR [14] and PDV
patterns and optical images [5, 9].                                                      [15] laser interferometric techniques.
    Nevertheless, systematic structural studies can                                          The collision velocity was changed from 0.35 to
improve the importance of the available free-surface                                     2.00 km/s. Tests were carried out in the pressure range

                                                                                    794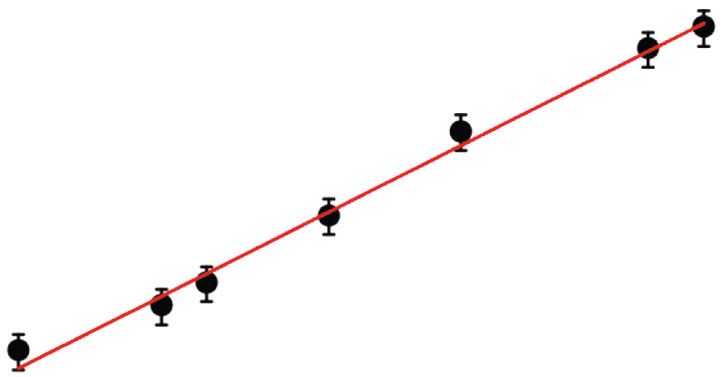
SHOCK-WAVE PROPERTIES AND DEFORMATION-INDUCED STRUCTURE 795
2.4
1.8 2.00
1.5 1.45
W(t), km/s
1.2 1.34
0.9
0.91
0.6
0.50
0.3
0.35
0
0 0.5 1.0 1.5 2.0
t, μs
50 μm
Fig. 2. Velocity profiles of the free surface of the VT1-0
titanium sample were taken at room temperature and at
Fig. 1. Structure of VT1-0 titanium in the initial state. different collision velocities (values are near profiles).
3.9–26.5 GPa and the strain rate range in rarefaction elastic precursor with compression stress behind its
waves 1 × 10⁵–3 × 10⁶ s–1. The temperature of the front equal to the dynamic elastic limit, and a plastic
samples was varied from –108 to 784°C. The samples shock wave. A three-wave configuration of the shock
were cooled in liquid nitrogen and heated with an wave exhibiting an α → ω transformation precursor
induction heater. was recorded in experiments at impact velocities of
The structure of the 4-mm-thick samples was 1.34 and 1.45 km/s. The α → ω transformation in
examined. The structure of the samples was examined VT1-0 titanium begins at 12.2 GPa. This value agrees
by X-ray diffraction (XRD) analysis, optical metallog- quite well with the data of [9]. The velocity of the plas-
raphy, and transmission electron microscopy (TEM). tic wave increases naturally with increasing shock
X-ray diffraction analysis was carried out using a compression pressure, whereas the time when the
DRON-3 diffractometer with a diffracted-beam plastic wave reaches the target surface decreases reg-
graphite monochromator in CuKα radiation. Optical ularly.
metallography was conducted on a Neophot-2 metal- The resultant free surface velocity profiles were
lographic microscope. Electron microscopic exam- used to obtain the spall strength and shear stress relax-
ination was performed using a JEM-200CX electron ation in the material under study. The spall strength
transmission microscope. Microhardness was mea- was calculated using the drop in the free surface veloc-
sured using a PMT-3M tester at an indentation load of ity during the unloading of the shock-compressed
0.98 N. state. The calculation was made taking into account
the correction for distortion of the velocity profile due
to the difference between the velocities of the spall
RESULTS AND DISCUSSION pulse and the plastic wave in the unloading region [14].
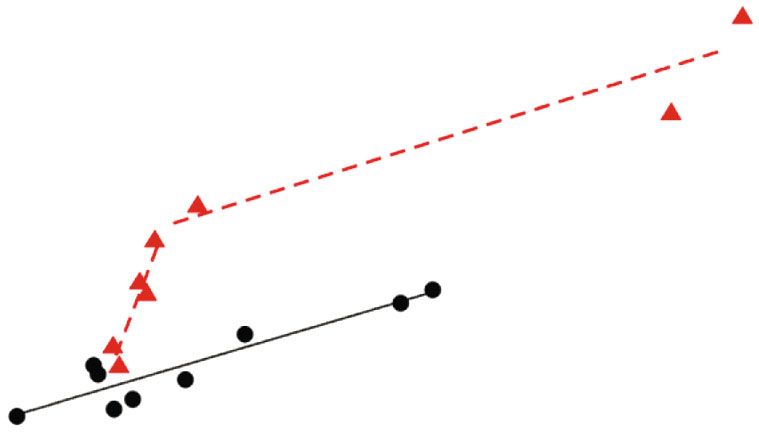
According to the X-ray investigation of the phase Figure 3 shows the spall strength vs. strain rate of
composition of VT1-0 titanium, it consists of the VT1-0 titanium. At low pressures, in the α-phase
α phase in its initial state. The diffraction peaks in the region, the spall strength increases monotonically
XRD patterns are quite narrow, indicating that there until the strain rate reaches 7 × 10⁵ s–1 (indicated by
are no significant distortions in the structure. circles and a solid line), at which the spall strength is
The metallographic examination shows only grain ~4.3 GPa.
boundaries in the sample (Fig. 1). There is no signifi-
cant difference in the grain structure in the transverse The experiments were divided into two groups in
and longitudinal sections of the initial workpiece. In the region of high pressures. The first group included
both cases, the average grain size is 11–13 μm. the experiments at nearly constant strain rates from
~2 × 10⁵ to ~3 × 10⁵ s–1. In this group, different com-
The microhardness in the initial state is Hμ =
pleteness of α → ω transformation can be achieved by
1837 ± 55 MPa. varying the impact velocity, and the spall strength
Figure 2 shows the velocity-time profiles of the free increases noticeably from ~3.7 to ~4.9 GPa (α → ω
surface of the VT1-0 titanium samples (the impact group is indicated by triangles and dotted lines). The
velocity is indicated next to each profile). second group includes the experiments performed at
The wave profiles with an impact velocity less than an impact velocity of ∼2.0 km/s. In this case, α → ω
1.0 km/s show a splitting of the shock wave into an transformation was complete. The spall strength grew
PHYSICS OF METALS AND METALLOGRAPHY Vol. 122 No. 8 2021796 PAVLENKO et al.
(a) (b)
6 “ω”-phase 107
σsp, GPa
ε· p, s–1
5
α–ω
106
4 α-phase
105
105 106 4 6 8 10 12
· s–1
ε, P, GPa
Fig. 3. (a) Spall strength of VT1-0 titanium as a function of the deformation rate and α → ω transformation degree. (b) The max-
imum deformation rate as a function of the pressure amplitude. Room-temperature loading.
from ∼4.9 to ∼6 GPa when the strain rate was increased elongated in this direction. These pileups are in fact
from ~3 × 10⁵ to ~3 × 10⁶ s–1 (ω-phase group). cross sections of extended planar dislocation pileups.
Analysis of the temperature effect showed that the There are only several regions with microtwins
spall strength decreases with increasing temperature. (Figs. 4c, 4d). Typically, almost all these twins contain
The spall strength at the initial sample temperature of dislocations inside themselves. Twinning in α titanium
784°C and strain rate of ~2 × 10⁵ s–1 is 2.4 GPa, which during plastic deformation can occur along six planes
is 40% lower than its value under normal conditions. [16]. The predominant type of twinning depends on
When the temperature decreases to ‒108°C, the spall both the loading scheme and the temperature of defor-
strength remains almost the same. In general, these mation. The twinning planes at room temperature are
data agree with the results of [10]. the {10 12} , {1121}, and {1122} planes. The twinning
The shock-wave loading at impact velocities below plane in electron microscopic study is determined by
1.0 km/s results in a two-wave configuration of the the known direction of its trace on the image and the
shock wave, the material remains to be an α-phase known axes of the matrix and twin zones. Figure 4d
one, and the strain rate increases during shock com- shows the matrix with the [211] zone axis. The absence
pression (Fig. 3b). Therefore, the structural studies of all twin reflections makes it impossible to determine
were carried out on the samples retained after room- its zone axis. Therefore, the twinning plane was found
temperature loading at impact velocities V = 0.35 and only using the matrix orientation. To do this, we iden-
0.57 m/s; the strain rate increased from ~3 × 10⁵ to tified the direction of the intersection of all possible
~1 × 10⁶ s–1. twinning planes with the foil plane. A comparison of
these directions with the twinning plane trace direc-
The loading of VT1-0 titanium at a velocity of
0.35 km/s (peak pressure of 3.9 GPa) forms a spall tion in Fig. 4d shows that only the trace from the (1102)
crack in the cross-section approximately at the middle plane coincides with it.
of the sample thickness. An increase in the pressure to An increase in the impact velocity to 0.57 km/s
6.4 GPa at the cost of increasing the impact loading causes a significant increase in the dislocation den-
velocity to 0.57 km/s increases the cross-sectional size sity as compared to the dislocation density after the
of the main crack significantly. It passes through the low-velocity loading (Fig. 5). The dislocation num-
middle part of the sample in the same way as it did in ber density was estimated to be ~1016 m–2. The dislo-
the previous case, but the crack is more developed. cations are distributed mainly homogeneously, but
Electron microscopic study shows that the pulse there are regions with a low dislocation density,
impact at V = 0.35 km/s results in high-rate plastic where dislocations are elongated along crystallo-
deformation of VT1-0 titanium through slip and twin- graphic directions (Figs. 5a, 5b). Similar to the struc-
ning (Fig. 4). The dislocation structure of the sample ture formed during the low-velocity loading, the tita-
is nonuniform. In addition to regions containing a nium structure in this case exhibits bands with a large
large number of uniformly distributed dislocations number of dislocations (Fig. 5b).
(Fig. 4a), there are regions with specific pileups of A subgrain structure (Figs. 5c, 5d) forms rapidly
elongated dislocations. For example, two pileups can under these loading conditions and an increase in the
be seen in Fig. 4b. temperature results in partial polygonization.
They spread almost parallel to each other. More- The number density of microtwins increases
over, some dislocations located between them are also slightly in comparison with that under low-velocity
PHYSICS OF METALS AND METALLOGRAPHY Vol. 122 No. 8 2021SHOCK-WAVE PROPERTIES AND DEFORMATION-INDUCED STRUCTURE 797
(a) 0.5 μm (b) 0.5 μm
011tw
111
011 120
(c) 0.5 μm (d) 0.5 μm
Fig. 4. Microstructure of VT1-0 titanium after pulsed room-temperature impact at V = 0.35 km/s. The twinning plane is indicated
by the dashed line: (a) dislocations, (b) dislocation pileups, and (c), (d) microtwins.
loading (Figs. 5e, 5f). In many regions, microtwins conditions we used. Their formation was found [17] to
stop growing at the boundaries of the polygonal struc- occur at higher shock wave amplitudes.
ture that is being formed.
High-rate plastic deformation occurs by slip and
The microhardness was measured along the cross twinning under all loading conditions under the inves-
section of the samples. The microhardness after pulse tigation. There are few twins on the microlevel, and
loading at V = 0.35 km/s increases to 2016 ± 80 MPa. their number increases insignificantly with increasing
The microhardness increment is 9.7%. The high- loading velocity. Therefore, slip makes the main con-
velocity loading at V = 0.57 km/s increases the micro-
tribution to stress relaxation. The dislocation density
hardness of the alloy to an average value of 2098 ±
69 MPa (by 14.2% relative to the initial microhard- increases greatly with increasing loading velocity,
ness). After both loading regimes, the microhardness reaching values exceeding 1016 m–2 at impact velocity
level within the measurement error does not change V = 0.57 km/s. The dislocation density was noted [18]
along the thickness of the disks. to be one of the main factors responsible for the for-
mation of a cellular dislocation structure. However, no
The wave profiles for VT1-0 titanium mainly agree evidence of the cellular structure formation is
with the data from [1, 3, 12] obtained under similar detected, despite high dislocation density in the VT1-0
loading conditions. In addition, we found that the titanium samples under study. This is probably
strain rate-dependent spall strength changes differ- because no fixed Lomer–Cotrell locks are formed in
ently at different pressures; namely, it grows mono-
the titanium structure during high-rate plastic defor-
tonically with the strain rate at low pressures, whereas
it grows faster at high pressures. This behavior of the mation. No cellular dislocation structure has been
spall strength can be attributed to the formation of the shown [19] to form in the copper single crystal after
ω phase in this pressure range. loading by spherically converging shock waves if there
are no fixed Lomer–Cotrell locks in the structure. In
The appearance of the spall cracks indicates that titanium, slip mainly proceeds along prismatic and
they formed through the nucleation of a large number of pyramidal planes. The absence of a cellular structure
pores, their growth, and subsequent pore coalescence. in the investigated samples suggests that slip along
In contrast to the work [5], the formation of adia- these planes does not cause the formation of fixed
batic shear bands is not observed under the loading Lomer–Cotrell locks.
PHYSICS OF METALS AND METALLOGRAPHY Vol. 122 No. 8 2021798 PAVLENKO et al.
(a) 0.5 μm (b) 0.5 μm
(c) 0.5 μm (d) 0.5 μm
(e) 0.5 μm (f) 0.5 μm
Fig. 5. Microstructure of VT1-0 titanium after pulsed room-temperature impact at V = 0.57 km/s: (a), (b) dislocations elongated
along crystallographic directions, (c), (d) subgrain structure, and (e), (f) microtwins.
In addition to uniformly distributed dislocations, because plastic deformation starts at low effective
there are also plane dislocation pileups in the stresses.
deformed titanium structure. They form due to
densely localized deformation resulted from plastic
deformation occurring in several closely located slip CONCLUSIONS
planes. The dislocation density in these pileups is very The effect of shock compression on the rheological
high. Edge dislocations and edge components of properties and deformation structure of VT1-0 tita-
mixed dislocations reach grain boundaries when nium was studied.
stresses are high, therefore, mainly screw dislocations We found that the α → ω transformation began at
remain in the localized deformation band, since the 12.2 GPa.
velocity of edge dislocations many times exceeds the
velocity of screw dislocations. The spall strength of titanium depends on the strain
rate and changes differently; namely, at low pressures,
The spall strength increases with increasing strain it grows monotonically with the strain rate, and at high
rate, due to both a decrease in the tensile stress zone pressures it increases substantially in the ω-phase for-
width and an increase in the dislocation density. The mation region, depending on the α → ω-transforma-
spall strength decreases with increasing temperature, tion completeness.
PHYSICS OF METALS AND METALLOGRAPHY Vol. 122 No. 8 2021SHOCK-WAVE PROPERTIES AND DEFORMATION-INDUCED STRUCTURE 799
The recorded dynamic elastic limit and the spall 5. A. I. Petrov and M. V. Razuvaeva, “Localization of
strength decrease at a temperature of 784°C. plastic strain under shock-wave loading of titanium al-
loy with a crack,” Tech. Phys. 48, 714–716 (2003).
Spall cracks form through the nucleation, growth,
and subsequent coalescence of pores. 6. A. R. Kutsar, M. N. Pavlovskii, and V. V. Komissarov,
“A two-wave configuration of a shock wave in titani-
High-rate plastic deformation under the investi- um,” Pis’ma Zh. Eksp. Teor. Fiz. 35 (3), 91–94 (1982).
gated loading conditions was shown to occur by slip 7. S. V. Razorenov, A. V. Utkin, G. I. Kanel, V. E. Fortov,
and twinning. Twinning occurs over the {10 12} plane. A. S. Yarunichev, K. Baumung, and H. U. Karow,
No adiabatic shear bands were been observed. “Response of high-purity titanium to high-pressure
impulsive loading,” High Pressure Res. 13, 367–376
ACKNOWLEDGMENTS (1995).
8. E. Cerreta, G. T. Gray III, A. C. Lawson, T. A. Mason,
The electron microscopic examination was carried out and C. E. Morris, “The influence of oxygen content on
using a JEM-200CX electron microscope at the Center of the α to ω phase transformation and shock hardening of
the Collaborative Access “Test Center of Nanotechnologies titanium,” J. Appl. Phys. 100, 013530 (2006).
and Advanced Materials,” Institute of Metal Physics, Ural 9. V. A. Borisenok, M. V. Zhernokletov, A. E. Kovalev,
Branch, Russian Academy of Sciences. A. M. Podurets, V. G. Simakov, and M. I. Tkachenko,
“Phase transitions in shock-loaded titanium at pres-
FUNDING sures up to 150 GPa,” Combust., Explos. Shock Waves
(Engl. Transl.) 50, 346–353 (2014).
This work was performed within the state assignment
(theme “Pressure” No. АААА-А18-118020190104-3) and 10. E. B. Zaretsky, “Impact response of titanium from am-
supported in part by Rosatom (state contracts bient temperature to 1000°C,” J. Appl. Phys. 104,
123505 (2008).
nos. N.4kh.44.90.13.1111 and N.4kh.44.9B.16.1012).
11. C. W. Greeff, D. R. Trinkle, and R. C. Albers, “Shock-
induced α–ω transition in titanium,” J. Appl. Phys. 90
OPEN ACCESS (5), 2221–2226 (2001).
This article is licensed under a Creative Commons Attri- 12. G. I. Kanel’, G. V. Garkushin, A. S. Savinykh, and
bution 4.0 International License, which permits use, sharing, S. V. Razorenov, “Effect of small preliminary deforma-
adaptation, distribution and reproduction in any medium or tion on the evolution of elastoplastic waves of shock
format, as long as you give appropriate credit to the original compression in annealed VT1-0 titanium,” J. Exp.
author(s) and the source, provide a link to the Creative Com- Theor. Phys. 127, 337–341 (2018).
mons license, and indicate if changes were made. The images 13. A. V. Pavlenko, S. I. Balabin, O. E. Kozelkov, and
or other third party material in this article are included in the D. N. Kazakov, “A one-stage light-gas gun for studying
article’s Creative Commons license, unless indicated other- dynamic properties of structural materials in a range up
wise in a credit line to the material. If material is not included to 40 GPa,” Instrum. Exp. Tech. 56, 482–484 (2013).
in the article’s Creative Commons license and your intended 14. A. V. Pavlenko, S. N. Malyugina, V. V. Pereshitov, and
use is not permitted by statutory regulation or exceeds the I. N. Lisitsina, “A VISAR two-channel laser interfero-
permitted use, you will need to obtain permission directly metric complex for studying properties of materials un-
from the copyright holder. To view a copy of this license, visit der shock-wave loading,” Instrum. Exp. Tech. 56, 240–
241 (2013).
http://creativecommons.org/licenses/by/4.0/.
15. S. S. Mokrushin, N. B. Anikin, S. N. Malyugina,
A. V. Pavlenko, and A. A. Tyaktev, “An interferometer
REFERENCES with time-and-frequency signal compression for study-
ing properties of materials in shock wave experiments,”
1. G. I. Kanel, S. V. Razorenov, E. B. Zaretsky, B. Herr- Instrum. Exp. Tech. 57, 475–478 (2014).
man, and L. Meyer, “Thermal “softening” and “hard-
ening” of titanium and its alloy at high strain rates of 16. B. A. Kolachev, Physical Metal Science of Titanium
shock-wave deforming,” Phys. Solid State 45, 656–661 (Metallurgiya, Moscow, 1976) [in Russian].
(2003). 17. A. Dobromyslov, N. Taluts, and E. Kozlov, “Phase and
2. G. I. Kanel, S. V. Razorenov, and G. V. Garkushin, structure state of titanium loaded by spherically converg-
“Rate and temperature dependences of the yield stress ing shock waves,” High Pressure Res. 33, 124–128 (2013).
of commercial titanium under conditions of shock- 18. N. A. Koneva, L. I. Trishkina, and E. V. Kozlov, “Cel-
wave loading,” J. Appl. Phys. 119, 185903 (2016). lular dislocation substructures in polycrystals of FCC
3. G. I. Kanel, S. V. Razorenov, G. V. Garkushin, solid solutions based on copper: Holt’s relation and the
A. V. Pavlenko, and S. N. Malyugina, “Change of the size effect,” Bull. Russ. Acad. Sci., Phys. 76, 1201–
kinetics of shock-wave deformation and fracture of 1204 (2012).
VT1-0 titanium as a result of annealing,” Phys. Solid 19. A. V. Dobromyslov and N. I. Taluts, “Deformation
State 58, 1191–1198 (2016). microstructure of a copper single crystal after load-
4. Yu. I. Mescheryakov, A. K. Divakov, N. I. Zhigacheva, ing by spherically converging shock waves,” Phys.
and Yu. A. Petrov, “Shock induced phase transforma- Met. Metallogr. 120, 296–302 (2019).
tion and mechanisms of spallation in shock loaded tita-
nium alloys,” AIP Conf. Proc. 505, 439 (2000). Translated by T. Gapontseva
PHYSICS OF METALS AND METALLOGRAPHY Vol. 122 No. 8 2021You can also read