Literature report Sugar reduction in yogurt: Technological possibilities and sensorial ob- servations - Bundesamt für Lebensmittelsicherheit ...
←
→
Page content transcription
If your browser does not render page correctly, please read the page content below
Literature report

        Sugar reduction in yogurt:
Technological possibilities and sensorial ob-
                servations

                       On behalf of the FSVO

Barbara Guggenbühl, Magali Chollet, Matteo Lucchetti, Helena Stoffers

                           October 2020

                                  1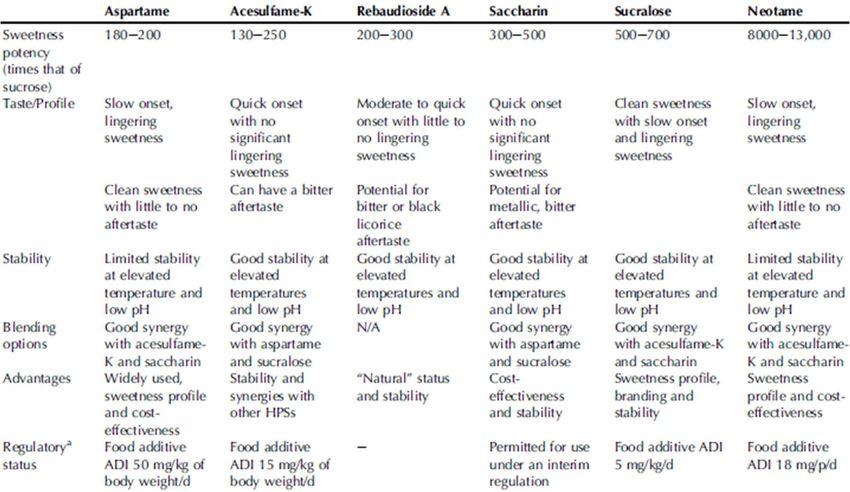
Content
1       Summary......................................................................................................................................... 3
2       Method of research, keywords........................................................................................................ 5
3       Introduction ..................................................................................................................................... 6
4       Definitions ....................................................................................................................................... 6
     4.1    Yogurt types ............................................................................................................................... 6
     4.2    Sugars ........................................................................................................................................ 7
     4.3    “Added sugars” ........................................................................................................................... 8
5       Sugar consumption in Europe and Switzerland .............................................................................. 9
6       The role of sugar in foods ............................................................................................................. 10
7       Perception of sweetness ............................................................................................................... 12
     7.1    Aroma taste interactions ........................................................................................................... 13
     7.2    Interaction with texture ............................................................................................................. 15
     7.3    Interaction with fat .................................................................................................................... 18
     7.4    Interaction with color ................................................................................................................. 18
8       Strategies for sugar reduction ....................................................................................................... 20
     8.1 Gradual sugar reduction ........................................................................................................... 21
        8.1.1 Silent reduction ................................................................................................................ 21
        8.1.2 Perceptible reduction of sugar content ............................................................................ 22
        8.1.3 Time interval between reduction steps ............................................................................ 23
     8.2 Replacement of sugars............................................................................................................. 25
        8.2.1 Sweetness replacers ....................................................................................................... 28
            8.2.1.1         High-intensity sweeteners (HIS) ........................................................................................... 28
            8.2.1.2         Taste enhancers .................................................................................................................. 31
            8.2.1.3         Flavors with modifying properties (FMP) .............................................................................. 32
            8.2.1.4         Addition of proteins for flavor enhancement ......................................................................... 33
        8.2.2       Bulking replacers ............................................................................................................. 36
            8.2.2.1         Sugar alcohols ..................................................................................................................... 36
            8.2.2.2         Rare or alternative sugars .................................................................................................... 38
            8.2.2.3         Dietary fibers ........................................................................................................................ 39
            8.2.2.4         Maltodextrins (MDs) ............................................................................................................. 40
     8.3 Technological adaptations ........................................................................................................ 42
        8.3.1 Bacterial Cultures............................................................................................................. 42
            8.3.1.1         Starter cultures .................................................................................................................... 42
            8.3.1.2         Cultures with specific flavor and texturing compounds ......................................................... 43
            8.3.1.3         Culture with different sugar metabolic pathway .................................................................... 44
        8.3.2       Enzymes .......................................................................................................................... 46
        8.3.3       Modifications of matrix structure ...................................................................................... 48
            8.3.3.1         Spatial distribution/ layering of sucrose ................................................................................ 48
            8.3.3.2         Microencapsulation .............................................................................................................. 48
            8.3.3.3         Size of the fruit pieces .......................................................................................................... 49
9       General Conclusions..................................................................................................................... 50
10      Literature ....................................................................................................................................... 53

                                                                                2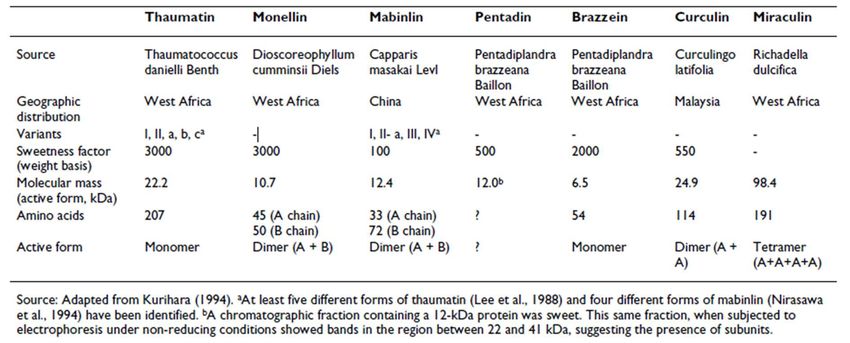
1 Summary
The following report consists of a compendium of review papers and scientific studies on sugar reduc-

tion, specifically focused on dairy products and particularly on yogurts. These articles discuss the role

of sugar in product formulation, potential cross-modal interactions between flavor, texture and color

occurring in a food matrix and their possible optimization, based on sensory and/or technological ap-

proaches.

An important strategy is the sequential or “silent” sugar reduction in which the reduction steps are cho-

sen in such a way that the consumer cannot detect the difference between the product with the initial

sugar concentration and the sugar-reduced product. The main advantage is that there is no reformula-

tion needed. However, there is little knowledge on the number of possible reduction steps before con-

sumers perceive a difference to the original product and product acceptance starts to decrease. Since

the difference thresholds highly depend on the type of food matrix product specific reduction steps have

to be determined. There is limited information on suggested time periods that need to be awaited before

a next reduction step can be taken.

Most studies found in literature about sugar reduction focuses on sugar replacement. In yogurt, partic-

ularly high intensity sweeteners have been extensively tested. The main disadvantage of these sweet-

eners remains their different sensory quality and temporality compared to sucrose and their controver-

sial effects on long-term health.

The addition of appropriate aromas allows an increase in the perceived sweetness intensity due to

cross-modal interactions, but literature on this topic is scarce and the results of the various interactions

are product-specific and difficult to predict.

The addition of protein to improve the yogurt texture is widely used in the dairy industry. This step could

also offer a way to improve sweetness intensity of yogurts as sweetness may be influenced by the

caseinate-whey protein ratio as well as type of production of whey concentrate. The addition of sweet

peptides seems a promising strategy to reduce sugar in food products. However, there is still little re-

search on their potential application in yogurt and there is no evidence on safety and health aspects

                                                     3
The specific choice of bacteria cultures used for yogurt production may represent another valid strategy

to actively reduce the amount of added sugars in yogurt. Supporting the formation of compounds natu-

rally occurring in yoghurt such as enzymes, peptides, glucose or aroma compounds may directly or

indirectly (lower production of lactic acid) enhance the perceived sweetness of yogurt. However, scien-

tific studies evaluating the metabolic pathways used by bacteria to form these desired compounds are

still rare. In addition, the effect on sweetness enhancement by this strategy might be rather small.

Another proposed strategy to reduce sugar content in food is the use of multisensory integration princi-

ples, such as a combination of various approaches like texture modification, aroma addition, and food

coloring. No study was found in the literature that evaluated the effect on sweetness perception of sys-

tematically combined known sensory cross modal interactions. Therefore, it is difficult to estimate the

size of a possible sugar reduction by simultaneous application of the above-mentioned strategies.

                                                    4
2 Method of research, keywords
Literature research on sugar reduction in yogurt and dairy-based products encompassed peer reviewed
scientific journals, books and patent searches and was conducted based on the following literature
search providers:
Scopus
Pubmed
Google Scholar
ScienceDirect
Espacenet
Google Patents
The keywords used for the literature search on sugar reduction (typed in different combinations) are
listed below:
Amino acids Reduction
Aroma Reformulation
Casein salt
Coffee Sensitivity
Consumer acceptance Sensory, sensory contrast
Culture Silent sugar reduction
Dairy Starch
Desserts Strawberry
Enhancement Sugars / Sugar / Sucrose / Saccharose
Fermentation / Syrup / Sweetener
Flavor / Flavor Sweetness
Interactions Technology
Milk Texture
Modulation Thresholds
Perception Whey
Protein Yogurt / Yogurt / Jogurt / Joghurt
53 Introduction
The impact of excessive sugar intake on health is currently one of the most discussed public health
issues, which also includes regulatory aspects. Various studies have shown a positive correlation be-
tween a high sugar intake in the diet and the risk of pathologies such as obesity, diabetes type II, coro-
nary heart diseases as well as caries. Therefore, decreasing sugar consumption is considered to be the
most efficient and promising strategy to lower the risk for these health problems. Guidelines published
in 2015 by the World Health Organization (WHO) on sugar consumption recommend a reduction of
intake of “free” sugars (added mono/di-saccharides) to less than 10% of total energy intake. This corre-
sponds to less than 50g sugar per day (WHO 2015).
Sugar reduction targets the organoleptic and chemical/physical characteristics of a wide range of food
products and involves various approaches depending on the type of product investigated.
The aim of this report is to give an overview of the scientific literature on potentially new and already
applied approaches for sugar reduction, focusing mainly on yogurt and other dairy products.
4 Definitions
4.1 Yogurt types
Yogurt is produced by bacterial fermentation of milk. The classic yogurt starter culture consists of the
two symbiotic species of lactic acid bacteria S. thermophilus and Lb. delbruecckii ssp. bulgaricus. These
microorganisms convert lactose into lactic acid, which is responsible for the acidic taste of yogurt. Thus,
the pH is reduced to between 4.2 to 4.5 depending on strain composition of the starter culture. (Das,
Choudhary, and Thompson-Witrick 2019). In addition to the acid, the lactic acid bacteria also produce
typical yoghurt flavour components such as acetaldehyde, diacetyl and acetoin (Chen et al. 2017).A
wide range of different types of yogurt is offered by food producers. Plain yogurt made from whole milk
typically consists of 85.6% water, 4% protein, 3.6% fat, 3.6% lactose, and approximately 1% minerals
and different vitamins (Sieber 2012). Stirred and set yogurts are the two main yogurt types produced in
Switzerland. Stirred yogurts are obtained by stirring the yogurt after acidification before filled in contain-
ers sold on the market, while for the set products the acidification takes place directly in the yogurt
container. The stirred technology is commonly used for fruit-containing yogurts, while set yogurt is
mostly used for “brown” flavors such as coffee, chocolate and vanilla as well as fruit yogurts flavored
only with fruit aroma molecules. Additionally, in the past years, yogurts with an increased protein content
have appeared on the Swiss market.
64.2 Sugars
A multitude of terms is used to describe sugars or dietary mono- and di-saccharides and the definitions
often differ between countries (Table 1).
Table 1: Definitions used for sugars in dietary recommendations (adapted from SACN (2015))
Term Definition
Non-milk extrinsic sugars Sugars not contained within the cellular structure of food except lactose in
(NMES)* - UK 1991 milk and milk products.
Intrinsic sugars - UK 1991 Intrinsic sugars are those naturally incorporated into the cellular structure
of foods
extrinsic sugars – UK 1991 extrinsic sugars are those sugars not contained within the cellular structure
of a food (i.e. lactose in milk and milk products)
Free sugars* - WHO 2015 Monosaccharides and disaccharides added to foods and beverages by the
manufacturer, cook or consumer, and sugars naturally present in honey,
syrups, fruit juices and fruit juice concentrates (excludes lactose in milk
and milk products)
Added sugars - US 2005 Sugars and syrups added to foods during processing and preparation.
Added sugars do not include naturally occurring sugars such as lactose in
milk or fructose in fruits
Added sugars – EFSA 2009 Sucrose, fructose, glucose, starch hydrolysates (glucose syrup, high-fruc-
tose syrup) and other isolated sugar preparations used as such or added
during food preparation and manufacturing.
Total sugars - EFSA 2009 endogenous (sugars naturally present in foods such as fruit, vegetables,
cereals and lactose in milk products) and added sugars
* Non-milk extrinsic sugars includes 50% of the fruit sugars from stewed, dried or canned fruit, but free sugars includes none.
74.3 “Added sugars”
Based on the definition given by the “European High Level Group on Nutrition and Physical Activity” the
Federal Food Safety and Veterinary Office (FSVO) of Switzerland provided its own definition for ‘added
sugars’. The term “added sugars” is specifically used to refer to “sucrose, fructose, glucose, starch hy-
drolysates (glucose syrup, high-fructose syrup) and other isolated sugar preparations used as such or
added during food preparation and manufacturing. The term “added sugars” also includes sugars pre-
sent in honey, syrups, fruit juices, fruit juice concentrates, and sugars from other foods with sweetening
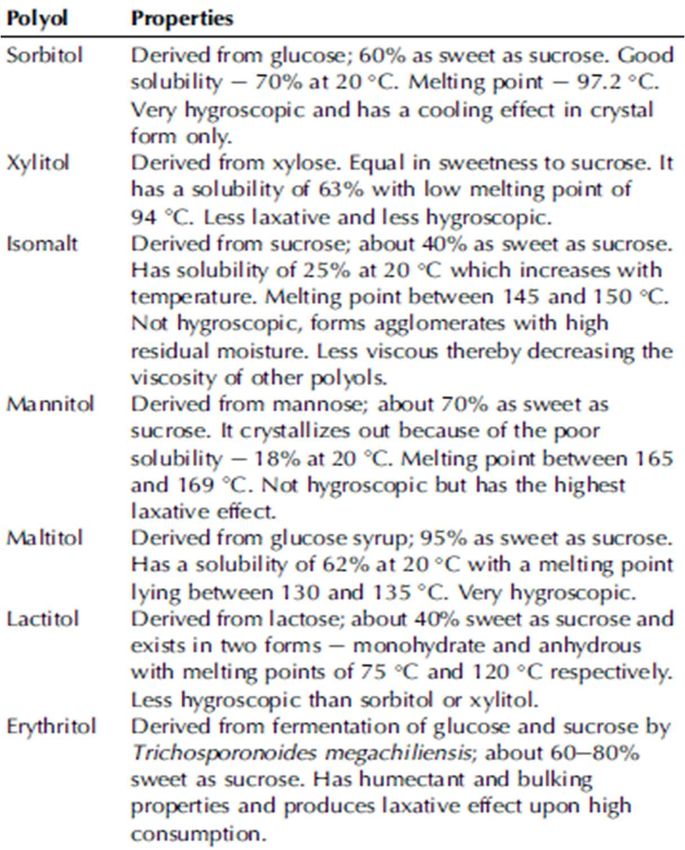
properties (e.g. fruit powder, fruit pulp or malt extract). Sugar alcohols (polyols) such as sorbitol, xylitol,
mannitol, and lactitol, are usually not included in the term “added sugars”. The present definition is in
agreement with the nutrition claim “with no added sugars” (EC-Regulation 2006), which is part of Swiss
Food Law. The FSVO also highlights the difference between the term “added sugar” and “of which
sugars”. The latter is often found on product labels in Switzerland in addition to the amount of carbohy-
drates. The term “of which sugars” refers to all mono- and disaccharides, which includes both ‘added
sugars’ and sugars naturally present in food such as lactose in dairy products.
According to the FSVO there are three categories of ingredients that add sugar to food:
Category 1: Ingredients consisting of sugars (100% sugars)
Glucose, dextrose, grape sugar, fructose, laevulose, d-tagatose, sucrose, saccharose, crystal
sugar, refined sugar, icing sugar, candied sugar, rock sugar (from cane or beets, whole and
crude), maltose, malt sugar, barley sugar, isomaltulose, caramel sugar, “aromatized” sugars
(vanilla, vanillin, cinnamon sugars), etc.
Category 2: Ingredients containing sugars (mono-/ disaccharides as ‘added sugars’)
Liquid sugar, sugar beet syrup and molasses, sugarcane syrup, sugars from fruits, starch syrup,
glucose syrup, fructose syrup, high-fructose-corn syrup (HFCS), caramel syrup, honey, invert
sugar, molasses, malt extract, concentrated fruit juice, syrups (fruits, agave, maple), fruit pow-
der, pulps, purees, etc.
Category 3: Composite ingredients containing ingredients of category 1 and/or 2
Sugared fruit pieces and cereal flakes, fruit jam, etc.
The declaration of “added sugars” on product labels is useful to provide reliable information about the
actual amount of added sugar in the product as well as to facilitate monitoring and regulation of added
sugars in the diet. However, in contrast to the US, it is not mandatory to declare “added sugars” in the
EU/CH.
85 Sugar consumption in Europe and Switzerland
In Europe, sugars represent between 15 and 21% of the total energy intake of adults and approximately
16 to 26% of children. When only added sugars are considered, sugar accounts for 7 to 11% and 11 to
17% of daily energy intake of adults and of children, respectively, highlighting the major contribution of
these sugars on the energy intake (Azaïs-Braesco et al. 2017). In Switzerland, the FSVO estimates that
the average daily intake of sugars is 110 g per day, i.e. about double the amount recommended by the
WHO (FSVO 2019b). Independent of age, gender and country, four main food categories are the major
contributors of total sugar intake in Europe: sweet products (e.g. confectionery, chocolate, jam), fruit,
beverages and dairy products (in order of importance) (Azaïs-Braesco et al. 2017). In Switzerland, the
three main food sources of added sugars are sweet products (47%), beverages (29%) and dairy prod-
ucts (9%) with yogurt accounting for 6% (Chatelan et al. 2019). Although dairy products are considered
as healthy products as they are important suppliers of essential nutrients such as calcium and vitamins
yogurts are often sweetened with saccharose to balance the yogurt acidity.
For some years now, the Swiss Federal Government has set itself the goal of reducing the sugar content
in products, which contain high amounts of added sugars and are consumed on a daily basis. The aim
is to promote a healthy lifestyle and on the long run reduce the healthcare costs associated with a high
sugar intake. In 2015, the “Milan Declaration”, an agreement aiming to gradually reduce the sugar con-
tent in yogurts and breakfast cereals, was signed by the Swiss government and leading food producers
(FSVO 2019b).
In order to monitor the progress of the agreed sugar reduction, data on sugar content of fruit yogurts
and flavored set yogurts as well as other products such as cereal is collected and analyzed annually in
Switzerland. In 2016, the FSVO conducted a first survey on the sugar content of yogurt. The monitoring
of 348 sweetened yogurts from seven companies showed that an average of 9.4 g sugars per 100 g are
added to yogurts (min 5.5 g and max 17.0 g/100g) (Infanger 2017). The results of the survey conducted
in 2018 showed a 4.3% decrease in the median added sugar content of fruit yogurts (median for added
sugar in yogurt in 2016 = 9.2g/100g and for 2018=8.8g/100g) (FSVO 2019c).
A recent international study showed that in 2018 flavored yogurts contained an average of 12.4 g total
sugars per 100 g in UK, 10.1g/100g in South Africa and 11.9 g/100g in Australia (Coyle et al. 2019).
96 The role of sugar in foods
Sugar is a major energy contributor to human nutrition. However; today, energy intake in the form of
sugar consumption has become a major public health problem. Nevertheless, sugar is an important food
ingredient due to its wide range of functionalities. It enhances flavor perception and viscosity and can
act as a bulking and coloring agent, as well as a preservative. Furthermore, it is widely accepted that
sweetness intensity is a major factor determining consumer acceptance of a high percentage of a wide
range of food products. Thus, any reduction of the sugar content of a product should be done while
trying to avoid changes of the sensory product characteristics which are crucial for consumer ac-
ceptance (Markey, Lovegrove, and Methven 2015).
The most important characteristics of sugars is their potential to evoke a sweet taste. As already men-
tioned sweetness intensity has a high impact is a major factor determining on consumer acceptance of
a food product. Sugar-derived sweetness influences the perception of various other product character-
istics. Especially the interaction between perceived sweetness and sourness is a well-known phenom-
enon in many foods and beverages (Baldwin, Goodner, and Plotto 2008; Keast and Breslin 2003).
Particularly in yogurt, the sensation of sourness that derives mainly from the activity of the lactic acid
bacteria can be balanced by the addition of sugars.
Moreover, selected sugars have the potential to increase the intensity of specific aromas, such as
strawberry (Pfeiffer et al. 2006), vanilla and caramel (Guinard and Mazzucchelli 1999) as well as citrus
(Fujimaru and Lim 2013). In contrast, sweetness is interacting with other taste qualities for example by
suppressing bitterness (Pineli et al. 2016) as well as saltiness (Gillan 1982).
Sugars have also a significant impact on the perception of food texture, especially for solid products. In
particular, sugars have been shown to influence viscosity (Pangborn, Trabue, and Szczesniak 1973)
and thickness (Oliveira et al. 2015), as well as structural characteristics of foods, such as emulsion
stability (Maskan and Göǧüş 2000), the unfolding and aggregation of proteins during heat treatment
(Kulmyrzaev, Bryant, and McClements 2000), or gelatinization (Chantaro and Pongsawatmanit 2010).
Sugar also influences the color of a product. Especially when heated, sugar breaks down and can react
with proteins (Maillard reaction) resulting in the color and desirable flavors that characterizes many
cooked foods (Pareyt et al. 2009). In frozen fruits and jellies, sugar was shown to prevent unwanted
color changes of the product such as enzymatic browning and fading of the color caused by water
absorption (Varzakas, Labropoulos, and Anestis 2012).
10From a food safety point of view, sugars play a role in food preservation. An increase in sugar concen-
tration results in a decreased water activity that can inhibit microbial growth and, in consequence, extend
the shelf life of a product (Farkas 2007; Smith et al. 2004).
117 Perception of sweetness
Sweet is together with salty, bitter, sour and umami one of the well-known taste qualities, perceptible by
humans. According to recent research, there are also human taste receptors for a so-called fat taste
(Mattes 2009). Evidence shows that humans have an inborn preference for sweetness. In addition,
physiological factors such as age, sex and BMI also influence sweet taste perception (Jotterand Chap-
arro, Moullet, and Farina 2017). Technically, the term "taste" should only be used as a description for
the pure gustatory properties (i.e. sweet, salt, sour, bitter).The mixture of taste and olfactory sensations
that is perceived during the ingestion of most foods is called "flavor" and is used for the qualitative/quan-
titative sensory perception derived from the interaction between tastants and odorants (Rozin 1982).
Taste receptor cells (TRC) responsible for the perception of sweetness and other taste qualities are
mainly located in the oral cavity but are also present in the gastrointestinal system (Iwatsuki et al. 2012).
Physiologically, sweet, bitter and umami tastes are mediated by different G protein-coupled receptors
(GPCRs), type 1 taste receptors (T1Rs) for sweet and umami, and type 2 taste receptors (T2Rs) for
bitter taste. Type 1 taste receptor 3 (T1R3) subunit combines with the type 1 taste receptor 2 (T1R2)
subunit to form a distinct sweet taste receptor, which is expressed in the oral cavity and provides input
on the caloric and macronutrient content of ingested foods (Carniel Beltrami, Döring, and De Dea
Lindner 2018). This receptor recognizes all natural and artificial compounds perceived as sweet by hu-
mans (Belloir, Neiers, and Briand 2017).
The receptor cells transmit the information via specific nerve fibers to the brain areas involved in taste
processing (Steinert et al. 2011). In the brain, the information deriving from the interaction of the taste
receptors with the sweet molecule is processed and interpreted. The generated output at the cerebral
level is called “cognitive level”. Therefore, physiological and cognitive stimuli are tightly interconnected
and both participate in the evaluation of a tasting experience.
The perception of sweetness is determined not only by its intensity, but also by its temporality (persis-
tence). Temporality is defined as how the quality and/or intensity of a perceived food characteristic
change over time (McCain, Kaliappan, and Drake 2018). Natural and artificial sweeteners often have an
aftertaste and show a temporality different to that of sucrose. For example, aspartame often shows a
bitter note at higher concentrations and sweetness lingers much longer compared to sucrose. According
to Das and Chakraborty (2015), a possible explanation for the qualitative sweetness differences be-
tween natural and artificial sweeteners may be that taste receptor cells respond differently to the group
of sweeteners as a result of the often very different chemical structure. Indeed, natural sugars such as
12sucrose use the cyclic adenosine monophosphate pathway to elicit membrane depolarization while ar-
tificial sweeteners use the inositol triphosphate (IP3) and diacylglycerol pathway for signal transduction.
Every person has its own preference for sweetness, which generally decreases with age (Drewnowski
et al. 2012), but also depends on the amount of intake of sweet substances. Mahar and Duizer (2007)
showed that women with a high consumption of sweetener (natural or artificial) preferred sweeter orange
juice than those persons with a low sweetener intake. Additionally, the perception of a specific sensation
can be influenced by simultaneous stimuli of a different sensory modality (cross modal interactions)..
For example, the perception of (sweet) taste is influenced by visual cues, auditory cues, smell, the
trigeminal system, and touch (Narumi et al. 2011).
7.1 Aroma taste interactions
Taste is primarily perceived on the tongue in contrast to volatile, aroma-active molecules (odorants).
The latter can be perceived in two different ways.
1) 'Orthonasal' olfaction: Direct action of the aroma active compound from air to odor receptors located
in the upper part of the nose. For this type of the term “odor” is used;
2) 'Retronasal’ olfaction: Indirect action via connection between mouth cavity and nose. In this case, it
is called an 'aroma'.
Odors and taste are bound together via associative learning and synthetic attention (i.e. attention to the
flavor as a whole in contrast to analytical attention with one stimulus) (Prescott 2015).
Interestingly, during odor characterization, it is very common for panelists to use descriptors that are
more associated with taste rather than with odor, such as ‘sweet’ (Barba et al. 2018). According to
Stevenson, Prescott, and Boakes (1995) and Frank and Byram (1988) the perceived sweetness of cer-
tain odors could arise from associations with sweet-tasting foods. Odorants can acquire taste-like qual-
ities (e.g., ‘‘sweet’’ odor of vanilla, ‘‘salty’’ odor of sardine) by learned association (Lim, Fujimaru, and
Linscott 2014). According to Noble (1996) the perceived intensity of tastes is especially increased in
flavored solutions when there is a logical (i.e. congruent) association between them, such as between
sweetness and fruitiness, but not for incongruence, like e.g. for ham and sweetness. Odor-induced en-
hancement of sweetness was observed for different congruent mixtures of sucrose and fruits: with lemon
aroma (Frank, van der Klaauw, and Schifferstein 1993); with strawberry aroma (Frank, van der Klaauw,
and Schifferstein 1993), with vanilla aroma (Sakai et al. 2001); with green fruity aroma as well with peach
aroma (Barba et al. 2018).
13In contrast, the perceived quality or intensity of a tastant may be also decreased by the addition of
specific odorants (Murphy and Cain 1980; Murphy, Cain, and Bartoshuk 1977). For example, strawberry,
caramel, coffee, orange, maracuja and peach odor tended to increase sweetness intensity of sucrose
in solution. In contrast, liquorice, damascene, and angelica oil led to a decrease in sweetness intensity.
Moreover, the same odor does not always induce an equal effect on sweetness. Lemon seems some-
times to enhance sweet taste intensity, sometimes to suppress it and other times to have no effect. One
explanation for these observed differences for the effect of lemon may be influenced by cultural back-
ground. For example, the association between lemon and sweet is less frequent in France than in Vi-
etnam where lemon soft drinks are very popular (Valentin, Chrea, and Nguyen 2006).
Most of the studies on taste-odor interactions used aqueous solutions for testing, but also a few were
done using dairy products. In whipped cream containing sucrose, sweetness intensity increased when
a strawberry flavor was added compared to the product containing only sucrose (Frank and Byram
1988).
The addition of vanilla aroma enhanced sweetness perception in milk (Lavin and Lawless 1998; Wang
et al. 2018) and in a cocoa beverage but not in caffeinated milk beverages (Labbe et al. 2006). An
increase in vanilla concentration resulted in a higher perceived sweetness intensity also in vanilla fla-
vored dairy dessert (Alcaire et al. 2017). In a study with chocolate flavored milk, the addition of artificial
vanilla flavor (0.025%) did not significantly affect citation frequency of the attribute ‘sweet’ in samples
with a 20% reduction in added sugar. In contrast, a high (0.050%) concentration of vanilla flavor in-
creased the sweetness of the chocolate milk with a 40% reduction in sugar. In addition, both concentra-
tions (0.025% or 0.050%) of vanilla flavor increased perceived sweetness intensity in chocolate milk
with a 60% sugar reduction (Oliveira et al. 2015).
147.2 Interaction with texture
Many studies have shown that flavor release is linked to the texture of the product, which in turn is
dependent on the way the food structure changes during consumption. Flavor release depends not only
on the amount of sweet stimulus released in the mouth during food consumption but also on the effects
of physicochemical and cognitive interactions (Tournier et al. 2009). Interactions may occur at a neuro-
logical level where gustatory and trigeminal inputs converge, or even at a perceptual level where previ-
ous dietary experiences could influence taste judgements (Christensen 1980).
The diffusion rate of the stimulus within food, the rheological behavior of the product and the binding of
sweet compounds with other food components can potentially impact the flavor release (Arancibia,
Costell, and Bayarri 2013). Furthermore, the flavor release during eating could be modulated by masti-
cation and modified by the dilution with saliva (Ruth and Roozen 2000).
Generally, an increase in firmness of a solid food or an increase viscosity of a fluid food results in a
decrease of sweetness intensity perceived during eating. Early investigations on threshold values for
sweetness of liquids, foams and gels prepared from tomato juice and milk-egg-custard showed that
thresholds were lowest in liquids and foams, and highest in gels (Mackey and Valassi 1956). Wagoner
et al. (2018) studied the effects of texture on sweetness dose-response profiles of whey protein solutions
sweetened with either sucrose, sucralose, stevia, or monk fruit extracts. The more viscous or semisolid
samples textures required higher amounts of sweetener to reach iso-sweetness. A possible explanation
for this observation is a slowed or partial inhibition of the transport of the sweet stimulus compound both
within the food matrix,and also between the food matrix and taste receptors reduces the perception of
sweetness intensity (Arancibia, Costell, and Bayarri 2013).
Sweetness perception is also linked to water mobility. With increasing thickener concentration, the volume
of free water decreases, leading to a lower water activity and water mobility (Christensen 1980). In
consequence, sweetness intensity is decreased, most likely due to a prolonged transport time of the
water soluble sweet molecules to the taste receptor cells in the mouth (Christensen 1980). Furthermore,
dissociation of free water molecules arranged around the periphery of the sugar molecule produces a
high membrane potential across the taste cell, thereby enhancing sweetness perception (Hollowood,
Linforth, and Taylor 2002).
Perceived sweetness intensity depends not only on the concentration of the thickening agent but also
on the type of the thickening agent. For example, the addition of different types of soluble starch
(0.125%-4%) to aqueous sucrose solutions (0.1-1M) resulted in an increase of perceived sweetness
15intensity. In contrast, no sweetness enhancement of soluble starch was observed for solutions contain-
ing fructose (0.43 M), glucose (0.82 M), sorbitol (0.82 M), aspartame (0.0037 M) Saccahrin (0.0042 M)
or cyclamate (0.016 M) ((Kanemaru, Harada, and Kasahara 2002).
Tournier et al. (2009) examined texture–taste, texture–aroma and aroma–taste interactions in custard
desserts. Taste and aroma did not affect texture perception most likely because the rheological prop-
erties of the desserts were not modified. Texture affected the taste intensity but not the aroma inten-
sity, whereas aroma influenced taste perception and vice-versa. As the observed results on cross
modal interactions were not always congruent, it was concluded that the examined sensory interac-
tions were specific for both, product and sensory modality.
In gelatin gels, structure modifications at macroscopic or microscopic levels might enhance sweetness
intensity due to an inhomogeneous distribution of sucrose (Holm, Wendin, and Hermansson 2009;
Mosca et al. 2012; Mosca et al. 2015). Therefore, a possible strategy to increase the sweetness inten-
sity in the context of sugar reduction is to distribute sugar particles in a non-homogenous way in the
product.
In terms of rheological properties yogurt is defined as a pseudo-plastic material. Stirred or drinking yo-
gurts show the behavior of a viscoelastic fluid whereas set yogurts belong to the product group of vis-
coelastic solids (Lee and Lucey 2010). The physical properties of yogurt gels can be explained using a
model for casein interactions. There is a balance between attractive forces such as hydrophobic at-
tractions, casein cross-links contributed by calcium phosphate nanoclusters and covalent disulfide
cross-links between caseins and denatured whey proteins and repulsive forces e.g. electrostatic or
charge repulsions, which are mostly negative at the start of fermentation (Batt and Tortorello 2014).
Therefore, changing the protein content is a potential method for modifying yogurt texture and aroma
release. Indeed, yogurt enriched with casein had a lower aroma release than yogurt enriched with
whey protein (Saint-Eve, Juteau, et al. 2006).
Microscopically it has been shown, that a network of casein micelles linked together in clusters, chains
and strands creates pores of variable size in which the aqueous phase is confined (Modler and Kalab
161983). The network formation and textural properties of yogurts can be influenced by technological pa-
rameters during production, such as changing the temperature or stirring, whereby the process of stirring
results in weaker gels (Lee and Lucey 2010; Lee and Lucey 2004).
Fat reduction in yogurt has been associated with poor texture. Consumers significantly discriminated
fat-free/low fat yogurt from the full fat versions with most common verbatim used being "creamy",
“sweet” for the full fat versus "watery", "sour" for the fat-free samples (Laguna et al. 2017). According
to Sandoval-Castilla et al. (2004) and Torres et al. (2018) the protein network of reduced fat yogurt is
less dense, more open, and showsa higher level of serum pores compared to a full fat yogurt. This is a
consequence of smaller casein micelles aggregates, probably due to lower number of fat globules act-
ing as linking protein agents.
177.3 Interaction with fat
Besides other functional properties, fats are an excellent solvent for flavor compounds, which show a
high hydrophobicity. In sucrose/fat mixtures, in liquids an increasing fat level suppresses sweetness
whereas increasing sucrose concentration suppresses the perception of fat in solids (Drewnowski et al.
1989; Hayes and Duffy 2007). Similar results were observed in a model system consisting of skimmed
milk, different concentrations of sunflower oil and sweet compounds (including sucrose, aspartame and
sucralose) (Wiet et al. 1993).The reduction of fat levels led to a slight increase in perceived sweetness
for the three sweetening compounds when tested separately. However, this effect appeared to be non-
linear and concentration-dependent, reflecting a complex interaction between fat, type of sweetener,
and sweetness level. A study with a dairy-based emulsion found that, despite constant viscosity, an
increase in emulsified fat led to an increased sweetness sensitivity. In addition, the fat content also
influenced the difference threshold; the higher the concentration of fat in a dairy-based emulsion was,
the more a sugar reduction was perceived (Hoppert et al. 2012).
An explanation for this phenomenon could be that fatty acids stimulate taste receptor cells (Mattes
2009). On the other hand, Lynch et al. (1993) showed that a coating in the mouth with coconut oil might
suppress sweetness sensation.
In low fat yoghurts, fat content was found to significantly enhance creamy flavor, sweet taste and mouth-
feel, but significantly reduce astringency, bitter and sour taste (Folkenberg and Martens 2003). Saint-
Eve, Juteau, et al. (2006) concluded that aroma release and perception of sweetness were greater in
low-viscosity yogurts with low fat content than in high-viscosity yogurts with high fat content. During
phenotypical measurements of oral sensations. Hayes and Duffy (2007) stated that mixtures of fat and
sweet compounds may exhibit hedonic synergy; however, the only interaction observed in this study
between sucrose and fat was the apparent suppression of sweetness at high levels of fat. In contrast,
Tuorila et al. (1993) found that sucrose enhanced perceived fattiness and fat content increased sweet-
ness perception in strawberry yogurts, highlighted the close relationship between perception of sweet-
ness and fattiness in yogurt. Considering the contradictory results found in literature, the role of fat in
sweetness perception of yogurt is not clear.
7.4 Interaction with color
Visual stimuli such as for example color strongly influence the expectation about sensory perception
during food consumption. For example, consistent color flavor/odor associations have been found be-
tween red and pink and strawberry as well as between yellow and orange and lemon (Demattè,
18Sanabria, and Spence 2006). A study by Huisman, Bruijnes, and Heylen (2016) showed that round red
shapes were associated with sweetness whereas angular green shapes were associated with sourness.
However, color and shape visualizations did not influence the taste perception of sweetened and un-
sweetened yoghurts.
Other studies showed that the addition of green or yellow color decreased the sweetness in pear nectar
or respectively in strawberry and cherry drinks (Pangborn and Hansen 1963; Kostyla, Clydesdale, and
McDaniel 1978). In comparison, the addition of red color increased sweetness in both strawberry and
cherry drinks (Kostyla, Clydesdale, and McDaniel 1978). In yogurts with a forest berry flavor a higher
concentration of red colorant resulted in a higher sensation of sweetness intensity. However this effect
was not observed in yogurts with strawberry and orange aroma (Calvo, Salvador, and Fiszman 2001).
Moreover, the color of tableware can also influence the sensory perceptions (Huisman, Bruijnes, and
Heylen 2016). For example, both white and pink colored yogurt eaten from a white spoon were perceived
as sweeter than when eaten from a black spoon (Harrar and Spence 2013). Similarly, red strawberry
mousse was rated sweeter when tested from a white plate compared to a black plate (Piqueras-Fiszman
et al. 2012).
198 Strategies for sugar reduction
Regarding a healthy and balanced nutrition, sugar reduction is currently a “hot” topic, together with salt
and fat reduction, due to the impact on the healthcare system and the promotion of a healthy lifestyle
(DLG 2018). Strategies found in literature on sugar reduction in dairy products can be grouped as fol-
lows:
Gradual sugar reduction
Reduction or total replacement of added sugars by addition of sweetening substitutes
Sweetness enhancers
Technological adaptations
o use of specific bacterial starter cultures
o Use of enzymes, e.g. lactase
o food micro-layering with sugar
o spatial distribution of sugar in the matrix and sugar encapsulation
take advantage of sensory interactions
Simultaneous application of different above-mentioned strategies
The main and most promising strategies are discussed below, also considering their strengths and lim-
itations.
208.1 Gradual sugar reduction
For products already on the market, one of the most promising strategies for a sugar reduction in terms
of effectiveness, potential, and immediate results is a gradual decrease of sugar concentration over time
(Ma et al. 2016). The idea of this strategy is based primarily on the hypothesis that there will be an
overall downward shift in sweetness preference following a period of exposure to sugar-reduced prod-
ucts. The two main strategies for a gradual reduction in sugar content are
imperceptible reduction of the sugar content = "silent" reduction
The consumer does not notice the reduced sweetness intensity associated with the reduction.
perceptible reduction of the sugar content
The consumer perceives the lower sweetness intensity associated with the reduction. The re-
duction in sugar content is deliberately high and is often implemented and advertised in new
product lines. The change in the sensory profile of the product caused by the sugar reduction
does not always lead to a reduction in the acceptance of the product.
8.1.1 Silent reduction
The most common method to find the concentration steps by which sucrose can be reduced without
resulting in a perceptible sweetness difference is the determination of the difference threshold. The
difference threshold or “just noticeable difference” (JND) is defined as the smallest difference in sugar
concentration that causes a difference in the perception of sweetness intensity for at least 50% or 75%
of the individuals, depending on the stringency of the test (Lawless and Heymann 2010; Lima, Ares,
and Deliza 2018). The difference threshold, as any other sensory threshold, depends strongly on the
food matrix and therefore, has to be determined individually for each product.
JND values for sweetness for different food and beverages reported in the literature are limited. Deter-
mined values were: 6.7% in chocolate flavored milk (Oliveira et al., 2016), 6.21% of the added sugar
content in grape nectar (Lima, Ares, and Deliza 2018), 8.5% in orange nectar (Pineli et al. 2016) and
7.0–11.0% in pound cakes (Chang and Chiou 2006). Starting at five different initial sugar concentrations
levels difference thresholds between 4.2 and 8.14% of the added sugar concentration were determined
in three different fruit nectars (passion fruit, range/passionfruit and orange/pomegranate) (Oliveira et al.
2018).
These results support the theory that JND’s follow Weber’s law. This psychophysical law states that the
difference threshold between two stimuli is not an absolute value, but depends on the level of the initial
concentration of the stimulus (reference of Weber). It is also suggested that difference thresholds are a
21constant proportion of the stimulus intensity (Lawless and Heymann 2010). Stevens's Law, was found
to better match the stimulus-response curves for certain sensory phenomena, such as smell and taste,
as the stimulus intensity in the equation is additionally raised to a higher power (Nutter 2010).
8.1.2 Perceptible reduction of sugar content
Research on chocolate milk with Uruguayan consumers showed that sequential sugar reductions can
be set at 6.7% without affecting consumers' sensory and hedonic perception. A further sugar reduction
of up to 29% did not result in different overall liking (Oliveira et al. 2016). A previous study with the same
product showed that a 20% reduction of added sugar resulted in changes of sweetness intensity, which
was perceived by both, trained assessors and consumers. However, product liking was not significantly
affected by sugar reduction up to 40% of the initial concentration of 9% added sucrose (Oliveira et al.
2015). The evaluation of acceptability of chocolate milk showed that a sugar reduction up to 30% (from
205mmol/L sucrose) was accepted by both, young adults and children (Li et al. 2015).
Results of a study with mocha and strawberry yogurts suggested that Swiss consumers showed a pref-
erence for sugar-reduced yogurt compared to the sucrose level usually found in commercially available
yogurts (Chollet et al. 2013). Similarly, in a study with Moroccan consumers evaluating yoghurts from
the market and sugar reduced yogurts (20-30% reduction of added sugar) the latter showed the highest
acceptance (Benkirane et al. 2017).
Brazilian consumers testing sucrose reduced orange nectars (juices with added sugar) showed a clear
difference in sweetness liking. While nectars with 5.5% added sucrose were ideally sweet for one group,
samples with 10.5% added sugars showed an ideal sweetness for the second group (Pineli et al. 2016).
The average ideal sweetness among all consumers was determined for samples containing 7.3% su-
crose. The rejection threshold i.e. the point where preference was significantly lower than for the refer-
ence was found at a concentration of 7.2% (Pineli et al. 2016).
In sugar reduced grape nectars reduction steps bigger than JND of 6.21% resulted in distinctly per-
ceptible changes in the sensory characteristics, but had only little effect on average overall liking
scores (Lima, Ares, and Deliza 2018). Children had more problems to recognize changes in the sen-
sory profile but were more sensitive towards liking compared to adults.
Similar results were observed in a test with 50 consumers evaluating different fruit nectars. No signifi-
cant differences in overall liking were detected for products with a 20% sugar reduction. However,
consumers showed a broad range of different hedonic reactions towards sugar reduced juices
22(Oliveira et al. 2018). In conclusion, results found in literature suggest that a high percentage of con-
sumers accepts a sugar reduction bigger than the difference threshold without changing the hedonic
judgement at least for different fruit juices and fruit nectars.
8.1.3 Time interval between reduction steps
There is almost no information in the literature about the time interval by which the next step for a sugar
reduction could be set. However, experiences with salt reduction could probably be partially transferred
to sugar reduction.
According to Wise et al. (2016), when individuals adopt a sodium-lowered diet, they perceive a given
concentration of sodium to be more salty than it was before starting their diet or preferred products with
reduced salt content over time. Therefore, gradual salt reduction might lead to a decrease in preferred
saltiness intensity and, consequently, to a lower sodium intake. This hypothesis has been confirmed in
a study by Methven, Langreney, and Prescott (2012), where individuals receiving a soup with no added
salt showed an increase in liking after only three times of exposure.
In a study on salt reduction in white bread, a 25% reduction in the sodium content could be achieved
with reduction steps of 5% for six consecutive weeks. The consumer acceptance was not affected as
no differences in the scores for flavor or liking of the bread were observed (Girgis et al. 2003) .
In a study by Wise et al. (2016) subjects rated intensity and pleasantness of vanilla puddings and rasp-
berry beverages with various sucrose concentrations during five consecutive months. The low-sugar
subjects rated both low and high sucrose concentrations in puddings as 40% sweeter than the corre-
sponding control group. A less pronounced effect on rated sweetness was observed for the beverages.
Rated pleasantness was not affected for neither of the two products.
In another study, a group of 20 adults had to avoid all products with added sugars and sweeteners for
two weeks (Bartolotto 2015). After this period, 95% of participants found that sweetened food and bev-
erages tasted sweeter than before the abandonment of sweet products. Additionally, 86.6% of partici-
pants stopped their craving for sugar after six days.
In contrast, a four-week exposure to sugar-reduced biscuit (28% sugar reduction) did not affect the
participants’ liking of the original biscuit but did increase liking for less reduced variants (Biguzzi, Schlich,
and Lange 2014). In a second study, a stepwise exposure to sugar-reduced biscuits did not affect liking
either (Biguzzi, Lange, and Schlich 2015).Two sequential sugar reduction steps of 6.66% each in one
23year were recommended for chocolate milk (Oliveira et al. 2016). In summary, in all the mentioned
studies the sugar reduction intervals were similar or shorter than 6 months.
Hutchings, Low, and Keast (2019) argued that sweetness intensity of products has to be maintained, if
sweetness is the most salient sensation that needs to be modified, in order to guarantee consumer
acceptance.
248.2 Replacement of sugars
The majority of studies on sucrose reduction belongs to the strategy of replacement of sugar by other
ingredients that show sweetening and/or textural characteristics together with a lower energy content
compared to sucrose. Table 2 shows an overview of common sweet-tasting compounds (Edwards et
al. 2016).
Table 2: Overview of common nutritive and non-nutritive sweet-tasting compounds and their relative
sweetness, glycemic index and caloric value (Edwards et al. 2016).
Data from a(Mortensen 2006), b (Chattopadhyay, Raychaudhuri, and Chakraborty 2014), and c (Coultate
2016)
25Generally, sugar replacers are classified in different groups based on their chemical/physical character-
istics, suitability for different product categories (liquid or solid) and sweetening power. In this report the
classification according to (Lê, Robin, and Roger 2016) is used.
Table 3: Different classes of sugar replacers and their characteristics (Lê, Robin, and Roger 2016).
Sweetness replacers Bulking replacers
High Intensity Sweeteners (HIS) Sugar alcohols
- High sweetening power - Low sweetening power
- Very low to low caloric density - Low caloric density
- Most suitable for liquid products - Similar physicochemical properties to su-
crose
- My cause laxative effects depending on daily
dose
Taste enhancers Alternative/rare sugars
- No sweetening power - Low to moderate sweetening power
- Very low caloric density - Low to neutral caloric density
- Most suitable for liquid and semi-solid prod- - Similar physicochemical properties to su-
ucts crose
- Declared as additives
Flavors with modifying properties Dietary fibers
- No sweetening power - No sweetening power
- Very low caloric density - Low caloric density
- Most suitable for liquid and semi-solid prod- - Most suitable for semi-liquid and solid prod-
ucts ucts
- Unfavourable taste and texture profile in
some cases
Malto-Oligosaccharide
- Low to neutral sweetening power
- Neutral caloric density
According to Lê, Robin, and Roger (2016) sugar replacers are classified into two main groups, namely
sweetness replacers and bulking replacers (Table 3). Compounds belonging to the group of sweetness
replacers are used for a compensation of the perceived decrease in sweetness intensity, while bulking
replacers mainly compensate for the lack of bulk and texture.
The majority of sweetness replacers is characterized by a much sweeter taste intensity than mono- or
disaccharides. Whereas natural sweetness replacers show a sweetness potency range of 0.1 to 450,
artificial sweeteners show a sweetness potency up to 20’000 times higher than sucrose (McCain,
Kaliappan, and Drake 2018). Taste enhancers also belong to the group of sweetness replacers. These
substances do not elicit a sweet taste themselves, but in combination with specific compounds, they are
able to enhance perceived sweetness. The group of “flavors with modifying properties” encompasses
26substances that are able to modify the flavor profile of a food product and, as a side effect modify the
sweetness perception.
Sugar alcohols obtained by hydrogenation of sugars are classified as bulking replacers. This bulking
replacer group also contains alternative sugars that represent isomers of the common sugars, dietary
fibers of plant origins that cannot be completely digested by humans, as well as malto-oligosaccharides,
which are derived from glucose monomers. Besides their desired bulking properties, the majority of
bulking replacers also show sweet characteristics. However, with few exceptions, the sweetness inten-
sity evoked by bulking agents is only moderate. Therefore, they usally have to be used in combination
with other sweet tasting substances.
Sugar replacers can either modulate the quality and/or also the temporal perception of sweetness pro-
file. A major drawback of several sugar replacers is their pronounced ‘off’ flavor, which often limits their
use in food products (Du Bois and Prakash 2012).
Although low-calorie sweeteners used also in Europe have been approved as safe and have been sub-
jected to extensive scientific testing, confusion about their impact on health remains in the consumer’s
mind (Buttriss 2017). Thus, not surprisingly consumers tend to prefer a “naturally sweetened” product
over an “artificially sweetened” equivalent product (McCain, Kaliappan, and Drake 2018). Nevertheless,
in blind testing chocolate flavored dairy desserts sweetened with artificial sweeteners got higher scores
compared to dairy products containing natural sweeteners (Morais et al, 2014).
Another disadvantage of sugar replacers is that they are artificial and have to be declared on the ingre-
dient list, which is against the observed trend that consumers desire “all natural” products (McCain,
Kaliappan, and Drake 2018). Additionally, there are still some legislation gaps and differences between
countries. For example cyclamate and neohesperidine dihydrochalcone are allowed in the EU and not
in the US, while D-tagatose is not approved as a sweetener in the EU and cannot be used in these
countries in in food production (Carocho, Morales, and Ferreira 2017).
27You can also read


