Living for the city Urbanisation and the rise of the middle class - Alasdair Ross @AlasdairEIU - Nordregio
←
→
Page content transcription
If your browser does not render page correctly, please read the page content below
Living for the city
Urbanisation and the rise of
the middle class

Alasdair Ross
@AlasdairEIU
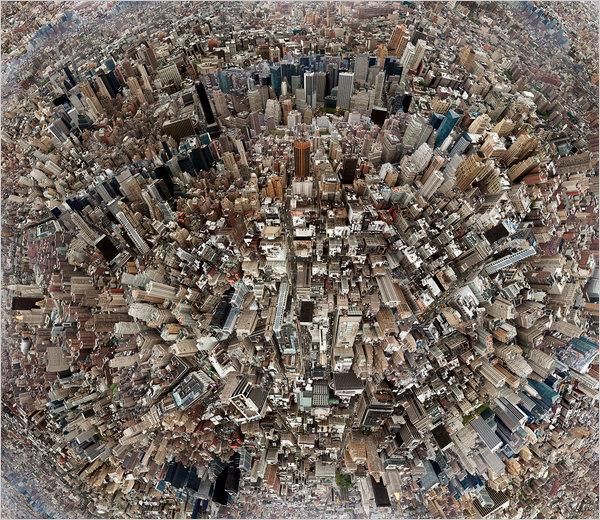
Urbanisation: The great transformation

 “  We are currently in the
  middle of the largest migration
  in human history, as over two
  billion people, a third of
  humanity, move from rural to
  urban areas
                   ”
  Doug Saunders - Arrival City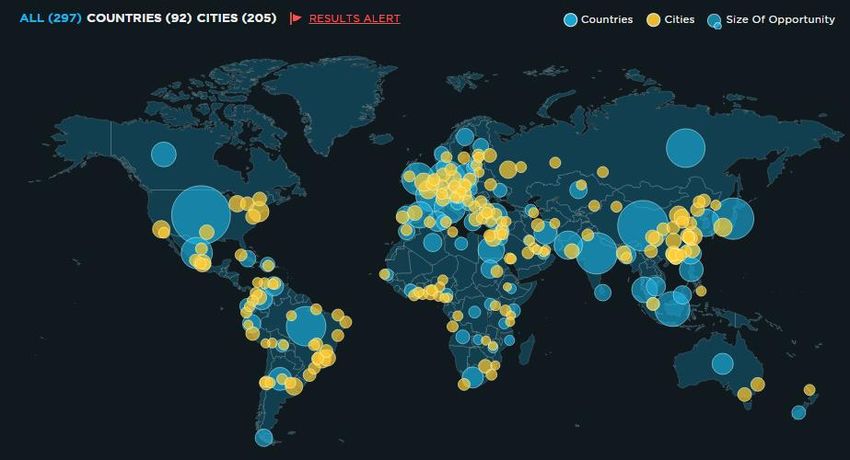
Urbanisation: The key trends
In 2007-50 world’s cities will absorb 3.1bn
90
more people
80
70
600 urban centres generate about 60 percent
of global GDP
60
50 Urban development moving southwards and
40 eastward
30 Urban populations are richer, women are
20 more empowered
10
Population of world’s countryside will stop
0
growing in 2019
1950
1960
1970
1980
1990
2000
2010
2020
In 2000-30 urban population of Asia & Africa
Africa E Asia Europe
will double
Lat Am US World
By 2100 75% of world’s population will be
urban
Urban populations. %. Source: UN.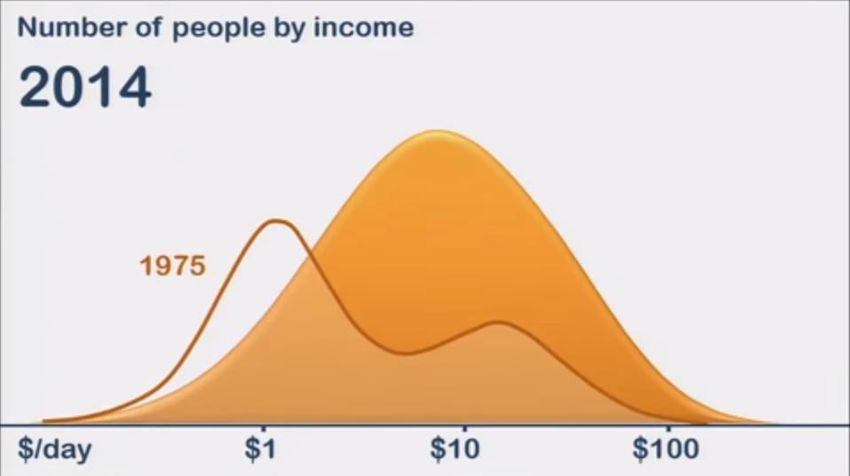
The world is middle class

   Source: Free material from www.gapminder.org

Fat around the middle The global middle class hit 2.1 billion people in 2015. Almost exactly half of the global middle class lives in Asia. China has by far the largest middle class (301m), but it is heavily weighted towards the lower middle class. The US middle class is around half its population. It is perhaps smaller than observers expect, but this is in part because the upper class is large (as is the lower class). Africa’s middle class (144 million) is almost as large as the United States middle class (161 million). Around half of Africa’s middle class lives in North Africa.
Spreading wealth

2005
2030
Source: EIU Canback
Not everywhere is growing
While megacities prosper, some mid-tier cities are
shrinking
Migration: Emigration, national and international
Industrial evolution
Demographics: Declining births, rising life expectancy
Immigration can help, as can ‘right-sizing’ – with
bulldozers
Mainly an advanced-country problem—for now
Pattern set in US, Europe, Japan
Over past three years a third of Germany's cities
have lost population. Over the next five, half will
The future for many developing market cities
China’s population will fall from 2050A matter of perspective – The world in 2025
1 2
Per Capita GDP GDP growth Children Households >$20k
1 Oslo Shanghai Kinshasa Tokyo
2 Doha Beijing Karachi Shanghai
3 Bergen New York Dhaka Beijing
4 Macau Tianjin Mumbai Sao Paulo
5 Trondheim Chongqing Kolkata Chongqing
6 Bridgeport Shenzhen Lagos New York
7 Hwasong Guangzhou Delhi London
8 Asan Nanjing Mexico City Mumbai
9 San Jose Hangzhou New York Delhi
10 Yosu Chungdu Manila Mexico City
1
Under
Source: 15
McKinsey Global Institute
2
PPPChina: Wealth and development—the virtuous cycle
2009
Donguan
Year in which average 2011 2012 2013
disposable income per capita Hangzhou Beijing Baotou
exceeds RMB30,000 Guangzhou Jinan Hothot
Ningbo Nanjing Qingdao
Suzhou Wuxi Taizhou
Shenzhen Xiamen Tianjin
Shanghai Yantai
2014 2015 2016
Changsha Fuzhou Anyang
Dongying Langfan Changchun
Maanshan Harbin Chengdu
Wuhan Hefei Dalian
Xi’an Jining Guilin
Yangzhou Linyi Huainan
Zhongshan Nanchang Jiaozuo
Zibo Shenyang Kunming
Shijiazhuang Luoyang
2017 Tai’an Nanning
Anshan Tangshan Pingdingshan
Datong Weifang Wuhu
Hengyang Xiangtan Zhangjiakou
Liuzhou Xiangfan
Panzhihua Xuzhou 2019
Qinhuangdao Zhengzhou Daqing
Xiangfan Zhuzhou Huaibei
Zhaozhuang Qiqihar
Zhuhai 2018 Jilin
Zunyi Changde Chaoyang
Guiyan Taiyuan
Haikou Xingtai
Source: Access China, Economist Intelligence Unit.
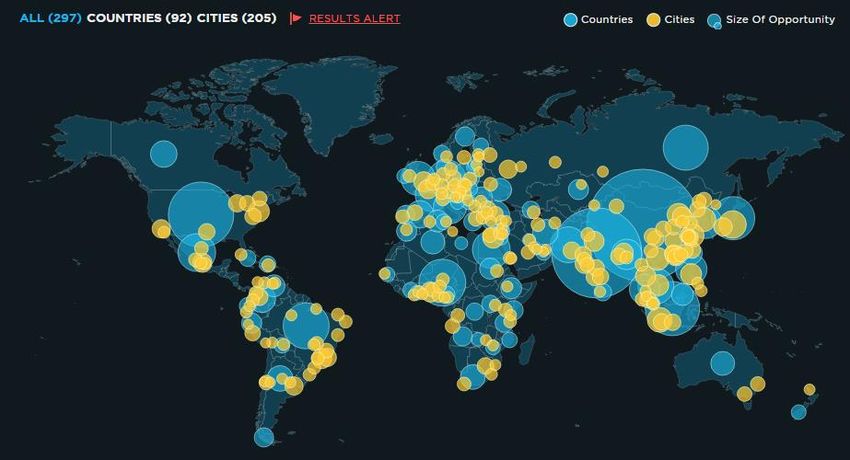
Huainan LuoyangAfrica’s opportunity
Major African cities
Turkey
Istanbul: 13.5m
Ankara: 4.7m
Izmir: 3.8m
UAE
Dubai: 1.95m
Abu Dhabi: .65m
5 countries to watch
Additional urban population by 2020
1 Nigeria 16m
2 Egypt 8m
3 Tanzania 7.7m
4 Algeria 6.4m
5 Ethiopia 6m
Turkey 11.7m
Source: EIUCountry life - The impact on the rural economy
Key question: Living standards lower outside cities, so key target for
poverty reduction
Backward linkages
Growing cities need feeding
Driving up agricultural productivity
Reduced rural labour supply forces improvements in productivity, driving wage increase
It’s not just farming
Urban demand encourages commuting and non-farm activity, services, small industry
Remittances
Return on initial investment by rural families to fund their urban pioneer
Driving up rural land values
Re-sale and collateral value of farmland, particularly close to cities
Driving down prices
Cities, with economies of scale and competitive markets, contribute to restraining
inflation at the national levelWhen things go wrong – Fragile cities Risk factors: The pace of urbanization Faster growing cities generate more instability and struggle for coherence Income and social inequality Wide differentials foment resentment and make administration tougher Youth unemployment A young population promises a demographic bonanza, but can sour if job creation lags Homicidal and criminal violence Usually tightly focused on high-risk areas, crime can act as a drag on activity city-wide Poor access to key services, Tends to ‘lock out’ human capital Exposure to climate threats - are more serious than others. Resilience and ‘bouncebackability’
You can also read