LOCAL LABOUR MARKET PLAN 2021-2022 - WINDSOR-ESSEX - Workforce WindsorEssex
←
→
Page content transcription
If your browser does not render page correctly, please read the page content below
2021-2022

                                                            LOCAL
                                                           LABOUR
                                                           MARKET
                                                             PLAN
                                                           W I N DSOR - E S S E X

This Employment Ontario project is funded in part by the
Government of Canada and the Government of Ontario.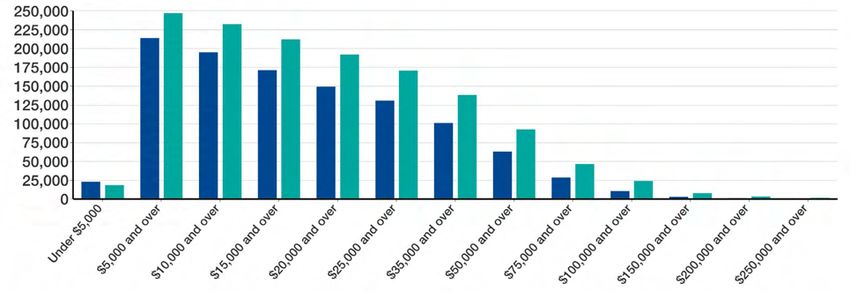
ACKNOWLEDGMENTS
AUTHOR: Samantha C. Dalo (She/Her)

Project Lead

Samantha is the local project lead for the 2021-2022 Local Labour Market Plan. With over 10
years of experience working in technology, coupled with her analytical skills, process im-
provement skills, and certification in the Tri-Council Policy Statement for Ethical Conduct for
Research, she provides data analysis expertise as a Labour Market and Policy Analyst. She
is also a Youth Civic Engagement Specialist whose research focuses on industry and civic
related curriculum/program development. Her pedagogy centres around anti-oppression and
anti-racism praxis, while applying an intersectional approach to all of her work. Samantha
holds a Bachelor of Honours in Criminology from the University of Windsor and a Magistrate of
Political Science from the University of Waterloo.

               REPORT DESIGNED BY: Sarah Fram, Communications Coordinator,
                         Workforce WindsorEssex February 2022

    This Employment Ontario project is funded in part by the Government of Canada and the
                                  Government of Ontario.

                              HOW DID WE DO?
       We invite your feedback on all publications produced by Workforce WindsorEssex:
                              www.workforcewindsoressex.com

                     880 North Service Road #201, Windsor, ON, N8X 3J5
                                   Phone: (226) 674-3220

                               info@workforcewindsoressex.com

    This document may be freely quoted and reproduced without permission from Workforce
     WindsorEssex provided that the content remains the same and that the organization is
                       acknowledged as the author of this document.

   Workforce WindsorEssex is committed to ongoing research to enhance local labour market
planning in the Windsor-Essex region. Workforce WindsorEssex assumes no responsibility for its
                    use or for the consequences of any errors or omissions.

  The views expressed in this document do not necessarily reflect those of the Government of
                            Ontario or the Government of Canada.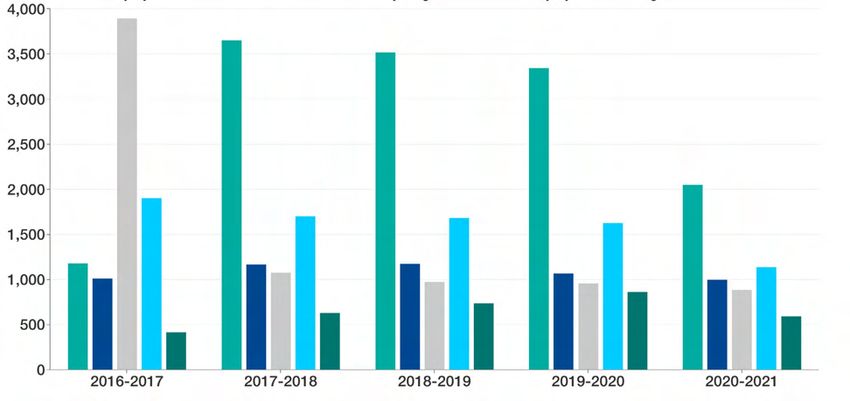
EXECUTIVE SUMMARY

THE LOCAL LABOUR MARKET PLAN (LLMP) provides an update on the local labour
market, including information on demographics, the labour force, Employment Ontario services, and
industry in Windsor-Essex. This information is supported by data and feedback from local stakeholders,
and the plan outlines challenges and opportunities related to local labour market conditions.

Although new census data is not yet available,           the pandemic and restrictions to traveling.
the 2021 Labour Force Survey released by                 Apprenticeship registrations have continued to
Statistics Canada provided significant information       steadily decrease, even more so from 2020-
regarding the local labour market. This data             2021 due to COVID-19 physical distancing
revealed that Windsor CMA has seen steady                restrictions, despite the ever-present demand for
population growth year after year, especially            skilled tradespeople and very specialized skilled
among the prime working age demographic.                 workers across multiple industries. Industries like
However, employee retention remains to be                Healthcare and Social Assistance, Information
a challenge with the younger working age                 and Communication Technology, as well as
demographic, and the region continues to suffer          Transportation and Warehousing continue to see
from high unemployment rates. This issue also            occupational growth, especially Information and
relates to the ongoing concern regarding lack of         Communication Technology.
qualified and skilled workers, as well as barriers
                                                         Workforce WindsorEssex has undertaken many
to accessible industry-related education. These
                                                         projects between 2021-2022 and developed
matters have been relevant across a decade
                                                         numerous tools and services to assist in local
worth of LLMPs and remain a challenge amidst
                                                         workforce planning and advancement. The
the pandemic.
                                                         community has demonstrated great eagerness
The labour force will continue to be negatively          and commitment to strengthening the workforce
impacted by the pandemic, but health and                 in Windsor-Essex and has come together to
safety restrictions have led to new methods of           collaborate on Workforce WindsorEssex’s
delivering industry-related education through            efforts as well as on opportunities outside our
virtual learning or a hybrid of in-person and            organization. Together, we will continue to create
online learning. These changes have provided             and sustain initiatives that support the availability,
some solutions to the recruitment barriers               stability, and growth of the Windsor-Essex
employers have faced filling in-demand                   workforce.
occupations. Employment Ontario service
providers continue to support jobseekers,
such as newcomers, racialized people, and
internationally trained professionals. Although,
these numbers have declined as a result of

                                                     4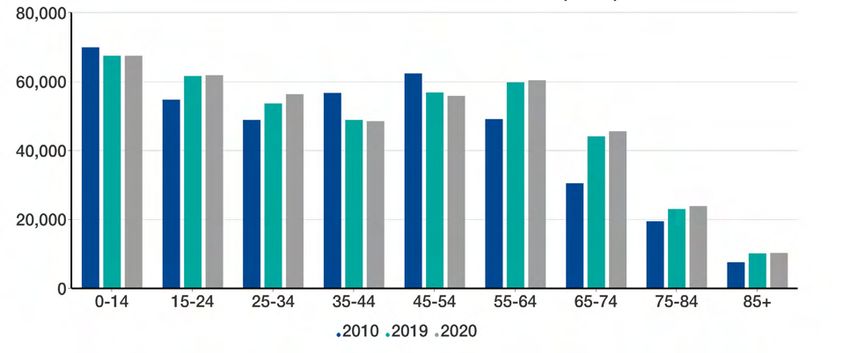
TABLE OF CONTENTS
ACKNOWLEDGMENTS...................................................................................... 3
EXECUTIVE SUMMARY...................................................................................... 4
INTRODUCTION................................................................................................. 7
METHODOLOGY................................................................................................. 8
OUR COMMUNITY............................................................................................. 9
         Population.......................................................................................................................... 10

         Retirement......................................................................................................................... 12

         Migration............................................................................................................................ 13

         Immigration........................................................................................................................ 15

         Languages......................................................................................................................... 16

         Education........................................................................................................................... 18

         Income............................................................................................................................... 20

OUR LABOUR FORCE....................................................................................... 22
         Labour Force Characteristics............................................................................................ 23

         In-Demand and Hard-To-Fill Positions............................................................................... 24

         Online Job Postings........................................................................................................... 27

         The Labour Force by Occupation and Industry................................................................. 28

         Promising Sectors and Occupations................................................................................. 29

EMPLOYMENT ONTARIO DATA.......................................................................31
         Demographic Information of Clients Served – Employment Services............................... 32

         Literacy and Basic Skills.................................................................................................... 38

         Apprenticeship................................................................................................................... 39

                                                                      5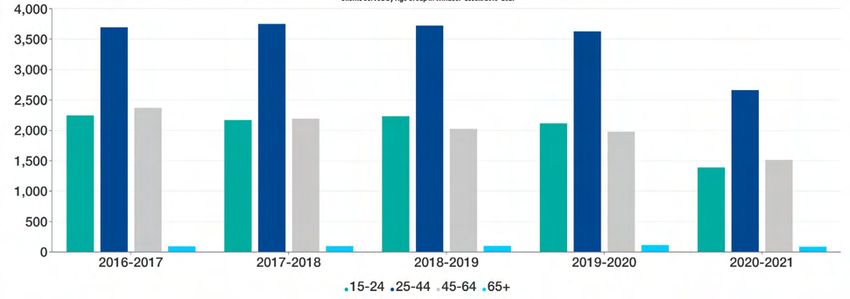
OUR LOCAL INDUSTRIES................................................................................ 40
         Business Counts................................................................................................................ 41

INDUSTRY UPDATES.......................................................................................42
         Agriculture......................................................................................................................... 43

         Construction...................................................................................................................... 46

         Educational Services......................................................................................................... 49

         Healthcare and Social Assistance..................................................................................... 52

         Manufacturing.................................................................................................................... 55

         Tourism and Hospitality..................................................................................................... 58

         Transportation and Warehousing...................................................................................... 61

         Information and Communication Technology.................................................................... 64

         Entreprenuerism................................................................................................................ 68

RECOMMENDATIONS..................................................................................... 70
         Recommendations to Support Education for Career Pathways........................................ 71

         Recommendations for Financial Support.......................................................................... 72

         Recommendations for Child Care Support........................................................................ 74

CONCLUSION.................................................................................................. 75
APPENDIX OF STAKEHOLDERS...................................................................... 77
BIBLIOGRAPHY................................................................................................ 78

                                                                      6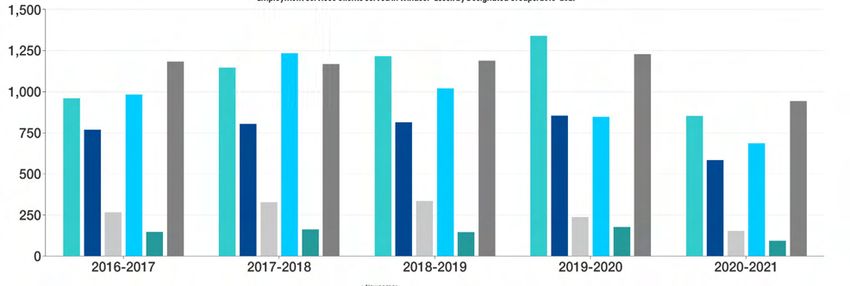
INTRODUCTION

WORKFORCE WINDSORESSEX                         is a workforce and community development board
whose mission is to lead regional employment and community planning for the development of
a strong and sustainable workforce. Fuelled in part by the ongoing pandemic, the local labour
market has witnessed a large supply of workers and a small growth in available jobs over the
last decade; this has contributed to the increase in unemployment in the region. This document
acknowledges the effort of industries represented in Windsor-Essex and the commitment to
building strong sectors and creating employment opportunities in our growing community.
Over the last decade, Workforce WindsorEssex has produced six LLMPs that have provided
insight on sector trends and industry-related education, as well as local labour market solutions
through strategic action plans. The 2021-2022 LLMP highlights similarities across the last
six reports, such as whether the same jobs have continued to be in-demand, if there is still a
gender disparity in traditionally male-dominated industries, and if sectors are still facing the
same employee retention challenges over the last 10 years. The newest report also offers
current data-driven information while adopting a comparative analysis lens to address the on-
going labour market issues Windsor-Essex continues to face. The 2021-2022 LLMP intends
to provide strategic action plans through interactive links to industry-related education, as well
as by connecting industry-related information, videos, and blogs to Workforce WindsorEssex
labour market tools that were created in partnership or with support from our stakeholders.
Lastly, the report will continue to address the pandemic’s influence on the local labour market
and will continue to include COVID-19 recovery efforts that relate to industry or financial support
throughout the report.
To successfully provide this information, Workforce WindsorEssex conducted community
consultations with industry representatives across different sectors to identify the challenges
employers are facing with the operation, sustainability, recruitment, retention, work-based
learning, and growth of their business. Additionally, surveys were used in collaboration with
community consultation, and were administered to gather evidence on the highest-ranked
occupations. With this available qualitative and quantitative data, this report intends to act
as a guideline for employers and employees regarding job prospects, skill development, and
knowledge of Windsor-Essex’s growing sectors.

                                                  7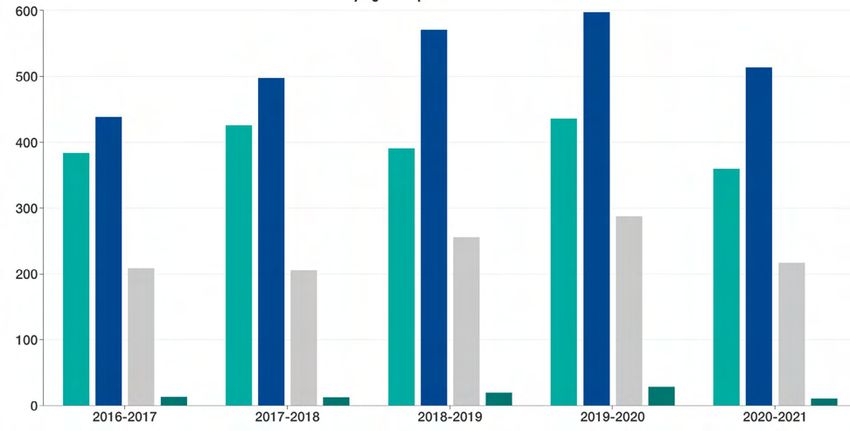
METHODOLOGY

THE LOCAL LABOUR MARKET PLAN was written by examining data from a variety of
sources, including data from online job postings collected by Workforce WindsorEssex, Statistics Canada,
Employment Ontario, Emsi Analyst, and surveys and consultations conducted by Workforce WindsorEssex.
Stakeholders consultations referenced in this report took place in the summer and fall of 2021 with 25
employers and community organizations, including educational institutions, municipal government, and
employment and settlement service providers. A total of 280 local employers responded to the Windsor-
Essex Economic Development Survey with a 70% completion rate. By examining this data, we were able to
paint a picture of the current labour market in Windsor-Essex, detailing trends, challenges, and opportunities
related to the labour market in our region. Additionally, Workforce WindsorEssex conducted consultations
with various stakeholders to confirm our findings, including consultations with members of our Workforce
Advisory Committee. The membership of this group represent industry, employment services, government,
and community organizations, ensuring the LLMP considers the perspective of the many stakeholders in our
community.

                                   In the report, there may be reference made to the geographies of “Windsor
                                   CMA”, “Leamington CA”, and “Essex CD”. Each of these is defined as follows:

                                                                 LEGEND:

                                                                  Windsor CMA (Census Metropolitan Area):
              SOR                                                 Includes the municipalities of Windsor,
     WIND
                            H                                     Tecumseh, Lakeshore, Amherstburg, and
                         SE
                       UM            LAKESHORE                    LaSalle.
LASALLE             C
                  TE

                                                                  Leamington CA (Census Agglomeration):
                                                                  Includes the municipalities of Leamington
              G
          BUR                                                     and Kingsville.
       ST
  HE
     R                          KINGSVILLE                           Essex CD (Census Division): Includes
                        ESSEX                   LEAMINGTON
AM                                                                   the municipalities of Windsor, Tecumseh,
                                                                     Lakeshore, Amherstburg, LaSalle, Essex,
                                                                     Leamington, Kingsville, and Pelee,
                                                                     essentially making up the entirety of
                                        PELEE

                                                                     “Windsor-Essex”.

                                                             8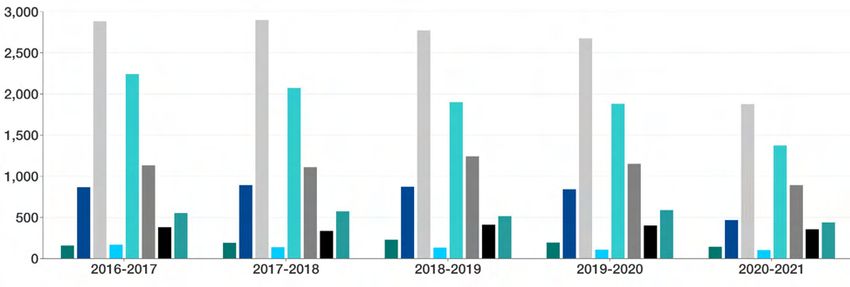
OUR COMMUNITY

      9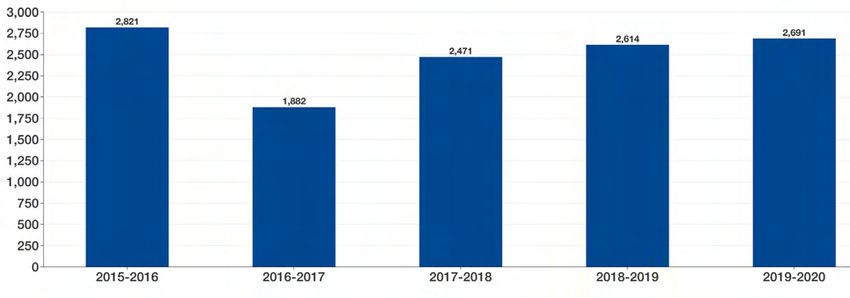
POPULATION
From 2010 to 2020, the population of Windsor-Essex has changed in size as well as age distribution.

                    WINDSOR-ESSEX POPULATION BY AGE GROUP: 2010, 2019, AND 2020

    Figure 1: Windsor-Essex Population by Age Group: 2010, 2019, and 2020.
    Source: Statistics Canada. Table 17-10-0139-01 Population estimates, July 1, by census division, 2016 boundaries

Despite negative impacts of the pandemic, such as reducing immigration to Canada and
settlement in Windsor-Essex, this mid-sized city has seen steady population growth year after
year. From 2019 to 2020, our population grew by 1.05%, 426,474 to 430,954. There are at least
a few reasons why Windsor-Essex has seen this population growth – it is a border town, it is the
tip of Canada and it experiences most things first, and the housing market—while challenging
for lifelong Windsorites—is more affordable compared to housing in larger metropolitan areas.
Between 2019 and 2020, age demographics between 15-24 years (0.34%) and 25-34 (4.99%)
have seen a population increase, indicating that a younger generation is ready to lead the region
into a new labour force and economic success.

                                                                                 10
The graph below provides the population growth among females and males1 in the Windsor-
Essex region.
WINDSOR-ESSEX POPULATION BY GENDER (2010 VS. 2020)
Figure 2: Windsor-Essex Population by Gender (2010 vs. 2020)
Source: Statistics Canada. Table 17-10-0139-01 Population estimates, July 1, by census division, 2016 boundaries
POPULATION CHANGE BY AGE GROUP (2010-2020)
AGE: 0-14 15-24 25-34 35-44 45-54 55-64 65-74 75-84 85+ TOTAL
2010 70,049 54,832 48,922 56,849 62,467 49,236 30,550 19,588 7,714 400,207
2019 67,621 61,688 53,729 48,986 56,941 59,888 44,252 23,126 10,243 426,474
2020 67,619 61,899 48,645 48,645, 55,945 60,478 45,718 23,945 10,297 430,954
% change -0.003 +0.342 +4.986 -0.696 -1.749 +0.985 +3.313 +3.541 +0.527 +1.050
Table 1: Population Change by Age Group (2010, 2019, 2020) Percent.
Source: Statistics Canada. Table 17-10-0139-01 Population estimates, July 1, by census division, 2016 boundaries
1
Scientifically, data around sex has been simplified to be female and male. This report acknowledges that this data does not include intersex and other variations
of human sex chromosomes that are more complex than female and male.
13
11RETIREMENT
The retirement age demographic in Windsor-Essex has been steadily increasing over the last
decade. In 2020, the population of those aged 65-74, who are entering their retirement years,
increased by 3.3%. The population of those aged 75-84 and 85+, who are most likely retired or
partially retired increased by 3.54% and 0.53%, respectively.
Throughout the pandemic, retirement fell 20% compared to the pre-pandemic period (Agopsowicz,
2021). Consultations with local school boards indicated that when the education services sector
had to adapt to COVID-19 health measures and closed schools or limited in-person learning, many
teachers came out of retirement to support the demand for educators. One in four Canadians
also reported that the pandemic impacted their plans for retirement as they felt less prepared to
financially support themselves (Heaven, 2021). After a year into the pandemic, retirements began
to increase, but not to pre-COVID-19 levels (Agopsowicz, 2021). Those who chose to not retire
may benefit from labour force shortages, as they will represent an under-utilized demographic
of the workforce, which also includes self-identifying women, immigrants, and racialized people.
Industries will have to develop new inclusive strategies to effectively utilize these underrepresented
demographics in the labour force.
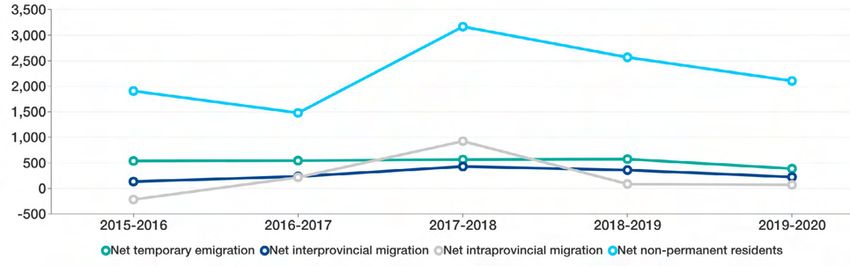
12MIGRATION
Between 2015 and 2020, Windsor-Essex saw a net migration of 13,682 people.2 Natural growth
through baby booms declined, and the majority of population growth came from immigration, non-
permanent residents,3 and international students remaining in the region through the graduate
work permit program.4 Net non-permanent residents increased significantly in 2017-2018 from
2016-2017. There was a modest decline of net non-permanent residents in 2018-2019 and once
again in 2019-2020, but this might be an impact of global COVID-19 travel restrictions for infection
control, impacting the number of international students that often come to the region. COVID-19
travel restrictions on out-migration prompted workers who had to stay in the region, rather than
move to a region that employs their area of expertise, to reconsider their career paths. Workers
re-evaluated their careers by developing new skills, upscaling current skills, and transitioning into
middle-to-senior roles or applicable industries.
NET MIGRATION BY MIGRATION CATEGORIES, 2015-2020
Figure 3: Net Migration by Migration Categories, 2015-2020.
Source: Statistics Canada. Table 17-10-0140-01 Components of population change by census division, 2016 boundaries
NET MIGRATION – WINDSOR-ESSEX: 2015-2020
NET MIGRATION: 2015-2016 2016-2017 2017-2018 2018-2019 2019-2020
Net temporary emigration 534 541 561 570 383
Net interprovincial migration 130 229 425 355 220
Net intraprovincial migration -222 213 921 82 65
Net non-permanent residents 1,904 1,476 3,165 2,564 2,101
Table 2: Net Migration – Windsor-Essex: 2015-2020.
2
Statistics Canada. Table 17-10-0140-01 Components of population change by census division, 2016 boundaries
3
Ibid.
4
University of Windsor, Envision Speaker Series featuring Mike Moffatt, https://www.youtube.com/watch?v=3hOx7pmHILA&t=2s&ab_channel=uwindsor
13MIGRATION BY AGE COHORT – WINDSOR-ESSEX: 2019-2020
AGE GROUP IN-MIGRANTS OUT-MIGRANTS NET-MIGRANTS
0-14 years 597 207 590
15-24 years 379 133 2,142
25-34 years 1,023 264 -569
35-44 years 345 189 -84
45-54 years 164 151 82
55-64 years 105 83 95
65+ years 77 62 98
Table 3: Migration by Age Cohort – Windsor-Essex: 2019-2020.
The migration by age shows that those aged 15-24 has the highest net migration. This migration of
the younger prime working age demographic can be retained through workforce development and
continued education to lower our historically high unemployment rate. The information presents
an opportunity for growing industries to partner with newcomer agencies in Windsor-Essex that
provide language assessment including:
• Newcomer Welcome Centre
• Windsor Women Working With Immigrant Women
• Multicultural Council of Windsor & Essex County
• UHC – Hub of Opportunities
• New Canadians’ Centre of Excellence Inc.
• YMCA of Southwestern Ontario
• College Boreal
• South Essex Community Council
• Le Centre communautaire francophone de Windsor-Essex-Kent
• Greater Essex County District School Board Language Assessment and Resource Centre
• Windsor-Essex Catholic District School Board Welcome and Assessment Centre
14IMMIGRATION
Immigration contributed to the rapid population growth in Windsor-Essex between 2015-2020.
During the pandemic, immigration fell sharply as travel was restricted by the Federal government
to mitigate the spread of the virus. The graph below shows the immigration numbers between
2015-2020:
IMMIGRATION TO WINDSOR-ESSEX: 2015-2020
Figure 4: Immigration to Windsor-Essex: 2015-2020
Source: Statistics Canada, 2016 Census of Population, Statistics Canada Catalogue no. 98-316-X2016001.
There are many challenges that immigrants face when adapting in Canadian workplace culture,
such as language barriers, employment barriers, and access barriers to community agencies and
resources. Immigrants have many priorities when coming to Canada, such as learning English
or French, reuniting their family, gaining employment, and securing housing. These priorities,
however, are met with long wait times for social assistance programs as they navigate Canadian
culture.5,6 Many immigrants face new barriers when arriving in Canada when seeking to participate
in education or employment. There needs to be a more holistic and effective process for
supporting newcomers to meaningfully participate in the local workforce. Suggestions on how this
can be done are provided in the Employment Ontario Data section of this report.
5
Labour Market Impact Assessment, Employment and Social Development Canada https://www.canada.ca/en/employment-social-development/services/for-
eign-workers/labour-market-impact-assessment-processing-times.html
6
Central Housing Registry, Windsor Essex County https://www.chrwec.com/faq.php?topic=waiting-list
15LANGUAGES
There are 70 languages spoken in Windsor-Essex and the region is the fourth-most ethnically
diverse city in Canada.7 Almost a quarter of Windsor residents are immigrants, and “Iraq is
the biggest source country of immigrants in Windsor, followed by the United States and Italy”
(Government of Canada, 2021). This information provides support to Arabic being the second non-
official language in Windsor-Essex.8 The chart below from the 2016 Census indicates the top five
non-official languages the population have a knowledge of in Windsor-Essex:
NUMBER OF PEOPLE WITH KNOWLEDGE OF LANGUAGE
LANGUAGE NUMBER OF PEOPLE WITH KNOWLEDGE OF LANGUAGE
Arabic 20,540
Italian 12,535
German 9,640
Spanish 7,230
Mandarin 5,035
Table 4: Number of People with Knowledge of Language
The 2016 Census top five non-official languages used at work in Windsor-Essex by people with
knowledge of the language:
TOP 5 NON-OFFICIAL LANGUAGES USED AT
WORK IN WINDSOR-ESSEX, 2016
Figure 5: Top five non-official languages used at work in Windsor-Essex, 2016.
Source: Statistics Canada, 2016 Census of Population, Statistics Canada Catalogue no. 98-316-X2016001.
7
Government of Canada, Immigration, Refugees and Citizenship Canada, 2021.
8
Statistics Canada, 2016 Census of Population, Statistics Canada Catalogue no. 98-316-X2016001.
16In the early stages of the pandemic, those who spoke English as a second language or were in
the process of learning English were unable to access the necessary healthcare information to
protect themselves against COVID-19. This issue was among many that non-first language English
speakers faced when accessing health services and seeking medical treatment. The Windsor Essex
Local Immigration Partnership, along with Ontario Health West, addressed this barrier and developed
We Speak. We Speak is a language access initiative and is used throughout the region by local
health care providers to schedule or utilize on-demand professional interpretation services through
in-person or video calls. The initiative also offers interpretation in American Sign Language.9
9
Workforce WindsorEssex, “We Speak”, https://www.workforcewindsoressex.com/wespeak/
3
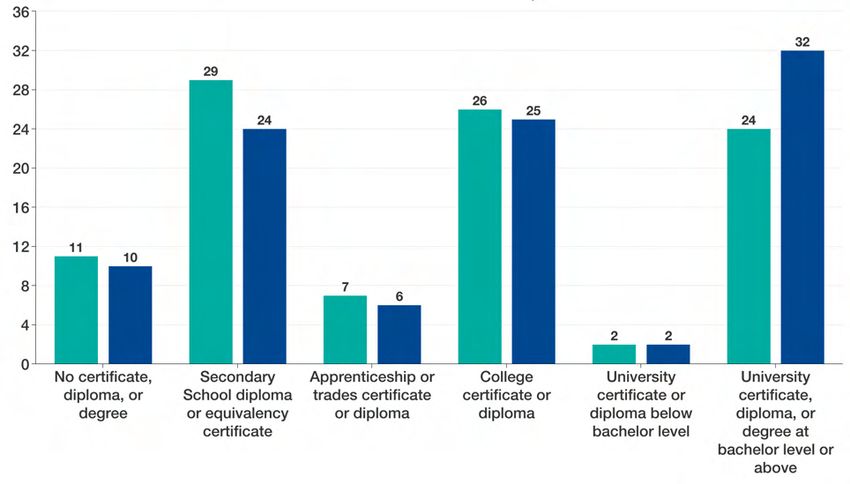
17EDUCATION
The chart below displays the 2016 Census data for highest educational attainment of the
population aged 25 to 64 in Windsor-Essex. The last census data available shows that the
Windsor-Essex population has lower post-secondary attainment (university certificate, diploma, or
degree at bachelor level or above) compared to the overall Ontario population. A total of 40% of
local residents have a secondary school diploma or less. Educational attainment is closely related
to the stability of the labour force and the progress of workforce development.
HIGHEST EDUCATIONAL ATTAINMENT OF THE POPULATION
AGED 25 TO 64 IN 2016, WINDSOR-ESSEX VS. ONTARIO
Windsor Ontario
Figure 6: Highest Educational Attainment of the Population Aged 25 to 64 in 2016, Windsor-Essex vs. Ontario.
Source: Statistics Canada, 2016 Census of Population, Statistics Canada Catalogue no. 98-316-X2016001.
Growing industries have indicated that opportunities for change (as in attracting and retaining)
starts with our youth. Young people can be encouraged to enter in-demand jobs in growing
industries if secondary and post-secondary schools continue to stress the employment
opportunities in the skilled trades. To do this, education needs to be framed as an experience.
Consultations with representatives from the school boards have indicated that Co-op and Ontario
Youth Apprenticeship Program (OYAP) have become very popular programs among parents and
students over the last few years. The greatest challenges they currently face is the pandemic
interrupting education and programming, as well as the societal biases and impressions of working
in the skilled trades. It will be interesting to see how the programs operate in the new school year
and if they can sustain the demand of students who want to enter into the skilled trades as the
region reopens and begins to recover from the pandemic.
18Previous LLMPs, as well as consultations with the school boards, have proven that educators
and businesses continuously work together to address career planning for youth and jobseekers.
This can be done by creating or adjusting curriculum and other learning methods to support
students to effectively transition them into the workforce. Even with these efforts, one of the most
difficult challenges that workplaces and education are facing right now are necessary public health
measures – like the vaccine mandate.
19INCOME
TOTAL INCOME BY TAX FILERS FOR WINDSOR CMA 2010 VS. 2019
2010 2019
Figure 7: Total Income by Tax Filers for Windsor CMA 2010 vs. 2019
Source: Statistics Canada. Table 11-10-0008-01 Tax filers and dependants with income by total income, sex and age.
As of 2019, there is a significant amount of the population that makes less than $50,000 a year.
The median total income for 2010 was $29,020 versus the total median income in 2019 at
$36,840.10 Research and stakeholder engagement shows that compensation is a causal factor for
hard-to-fill occupations. Wage compensation, regardless of vocation or occupation, is vital to the
financial and mental health stability of an individual and of families. Housing, food, water, clothing,
education, transportation, and internet are necessities for living. The pandemic has impacted
access to these necessities significantly. Windsor CMA has the highest rate of children living in
low-income households in the province at 24% (Ontario Association of Children’s Aid Societies,
2021).
The table below is adapted from the Windsor-Essex County Health Unit (WECHU) website. The
calculation for the 2020 living wage is summarized below. The 2020 living wage for Windsor and
Essex County reflects the most updated information available:11
2020 LIVING WAGE VALUE ($)
Annual Family Expenses $71,195
Premiums and Taxes $7,184
Government Transfers $21,900
Annual Household Income Needed
$56,479
(Annual Family Expenses + Premiums – Government Transfers)
Annual Salary Per Earner $28,239
Hourly Wage Per Earner – Job Does Not Include Health Benefits $15.52
Hourly Age Per Earner – Job Includes Health Benefits $14.00
Table 5: 2020 Living Wage
10
Statistics Canada, Tax filers, 2021.
11
Windsor Essex County Health Unit, “Calculating A Living Wage for Windsor and Essex County”, https://www.wechu.org/living-wage/calculating-living-wage-windsor-and-es-
sex-county
20Living wage is calculated to consider a healthy family of four, with two adults age 35 working
full-time. As shown above, the 2020 annual family expenses are roughly $71,000. The annual
household income needed to live is roughly $56,000. To sustain a family of four, the hourly wage
per earner needs to be $15.52 if the job does not include health benefits or $14 if the job does
include health benefits. The current minimum wage is $14.35 an hour and will be increased to
$15.00 in 2022. However, a significant amount of part-time employment, held by a majority of
identifying females and youth, do not offer health benefits. This means that the current and soon-
to-be minimum wage salary do not meet the livable wage standards of Windsor-Essex. At this
time, many of the in-demand jobs highlighted throughout this report have a median wage that is
less than a livable wage in Windsor-Essex.
These are examples of in-demand jobs with a median hourly wage that is less than the livable
wage in the region:12
IN-DEMAND OCCUPATIONS, 2021 MEDIAN HOURLY WAGES
Retail Salespersons $15.07
Food Counter Attendants, Kitchen Helpers and Related Support Occupations $14.00
Cashiers $14.00
Food and Beverage Servers $14.57
Maîtres D'hôtel and Hosts/Hostesses $15.43
Table 6: In-demand Occupations, 2021.
Throughout the pandemic, there has been a narrative that people do not want to work, but
what research is showing is that people are simply not being paid enough to work, relative to
government income supports. At the moment, government support like Employment Insurance (EI)
benefits and the Canada Worker Lockdown Benefit (CWLB) provide people with the livable income
they need to sustain themselves during the pandemic.
12
Emsi Analyst, 2021.
3
21OUR LABOUR
FORCE
22LABOUR FORCE CHARACTERISTICS
The following section provides insight on the region’s labour force characteristics by leveraging
reliable resources for examining the availability and stability of our workforce. The information below
provides labour force statistics for Windsor CMA between 2020-2025:
JANUARY 2021 LABOUR FORCE SURVEY: WINDSOR CMA
LABOUR FORCE INDICATOR 15 YEARS FEMALE MALE 15-24 YEARS 25-54 55-64
Population Aged 15 & Over 304,400 158,900 145,400 48,500 224,500 49,400
In the Labour Force 170,400 82,000 85,900 27,000 176,500 25,100
Employed 152,800 72,800 78,700 21,900 162,500 22,600
Full-Time 120,800 51,500 69,400 11,500 138,900 19,800
Part-Time 30.600 21,300 9,300 10,400 23,600 2,800
Unemployed 17,600 9,200 7,200 5,100 14,100 2,500
Not in the Labour Force 136,500 59,500 77,000 21,500 47,900 24,300
Unemployment Rate (%) 9.8 11.2 8.4 18.9 16.0 10.0
Participation Rate (%) 55.2 51.6 59.1 55.7 156.6 50.8
Employment Rate (%) 50.2 45.8 54.1 45.2 144.2 45.7
Table 7: Labour Force Survey – Windsor-Essex, January 202113
NOVEMBER 2021 LABOUR FORCE SURVEY: WINDSOR CMA
LABOUR FORCE INDICATOR 15 YEARS FEMALE MALE 15-24 YEARS 25-54 55-64
Population Aged 15 & Over 306,100 306,100 148,800 45,200 236,500 47,800
In the Labour Force 191,300 191,300 98,300 31,900 202,000 30,600
Employed 176,800 176,800 90,700 29,000 186,600 28,900
Full-Time 141,000 141,000 77,700 12,800 164,700 24,200
Part-Time 35,800 35,800 13,000 16,200 21,900 4,700
Unemployed 14,500 14,500 7,700 3,000 15,300 1,600
Not in the Labour Force 114,800 114,800 50,400 13,200 34,600 17,200
Unemployment Rate (%) 7.6 7.6 7.8 9.4 15.0 5.2
Participation Rate (%) 62.5 62.5 66.1 70.6 171.4 64.0
Employment Rate (%) 57.8 57.8 61.0 64.2 158.5 60.5
Table 8: Labour Force Survey – Windsor-Essex, January 202114
13
Statistics Canada. Table 14-10-0378-01 Labour force characteristics, three-month moving average, unadjusted for seasonality
14
Ibid.
23IN-DEMAND AND HARD-TO-FILL POSITIONS
To identify the top in-demand positions, hard-to-fill positions, hard skills, and soft skills in the region,
Workforce WindsorEssex partnered with St. Clair College and Invest WindsorEssex to conduct the
Windsor-Essex Economic Development Survey (EcDev).15 A total of 280 local businesses participated
in the survey with the majority of respondents being from Retail and Manufacturing sectors. The
survey was conducted throughout April 2021. The total of survey responses increased by 200 over last
year’s employer survey.
Community consultations and roundtables were also conducted in 2021 to identify workforce
challenges, such as providing livable wages, offering skill development and continued education, and
finding ways to support the younger demographic entering the workplace. By communicating with
stakeholders, it was made clear that the region’s labour market is in a high state of transition. The
high state of transition refers to adjusting the region’s labour market to respond to the rapid population
change, addressing income and livable wages so that people can afford to enter the increasingly
inaccessible real estate market, and providing local industry related education to promote high
employment rates.
This section will outline labour force terms like in-demand, hard-to-fill, hard skills, and soft skills.
There is a difference between in-demand and hard-to-fill occupations, and a position can either
be in-demand, hard-to-fill, or both. A position that is in-demand is one that employers are currently
hiring many workers for. A position that is hard-to-fill is one that employers are having difficulty filling,
whether that is due to a lack of qualified candidates or other reasons. Hard skills refer to job-related
knowledge and abilities that employees need to perform their job effectively, and are often gained
through some form of post-secondary education. Soft skills are personal, emotional, and social skills
that employees implement into their job performance to participate in healthy workplace culture. For
example, in the 2021 EcDev survey, employers responded that machinists were one of the most in-
demand positions between January and December 2020. They also reported that machinists were one
of the most hard-to-fill occupations in 2020. Local employers have communicated that finding skilled
workers for these occupations is very challenging as they require a very specialized skill set. As the
labour market continues to change and adapt to economic and social needs, employers are looking
for skilled workers that come with the necessary hard skill qualifications, but who also have well-
developed soft skills.
15
Workforce WindsorEssex, “EcDev Week 2021 Employer Survey”, Workforce WindsorEssex, 2021 (https://www.workforcewindsoressex.com/wp-content/uploads/2021/01/
EcDev_Week_2021_Employer_Survey_Dashboard.pdf)
24This section provides the top in-demand jobs, hard-to-fill positions, hard skills, and soft skills reported
by 280 local employers in the EcDev survey:
TOP IN-DEMAND POSITIONS
The top in-demand positions reported in April 2021 were the following:
1. MACHINE OPERATOR
2. LABOURER To assist with filling
3. SALES in-demand and hard-
4. MANAGER
to-fill positions, local
employers hired 73
5. ADMINISTRATIVE ASSISTANT
newcomers and 174
6. COOK
workers through
the Foreign Worker
TOP HARD-TO-FILL POSITIONS Program.
The top hard-to-fill positions reported in April 2021 were the following:
1. DESIGNER
2. FINANCE PERSONNEL
3. TOOL AND DIE MAKER
4. ACADEMIC MANAGER
5. MARKETING MANAGER
6. WELDER
7. MACHINIST
TOP HARD SKILLS
The Workforce WindsorEssex Employer Survey conducted in April 2021 included survey responses
to the top hard skills:16
1. COMPUTER LITERACY
2. BLUEPRINT READING
3. MECHANICAL APTITUDE/ASSEMBLY
4. CUSTOMER SERVICE
5. WRITTEN COMMUNICATION
TOP SOFT SKILLS
The Workforce WindsorEssex Employer Survey conducted in April 2021 included survey responses
the top soft skills:17
1. WORK ETHIC
2. COMMUNICATION
3. GOOD ATTITUDE
4. TEAMWORK
5. EMPATHY
16
WWorkforce WindsorEssex, “EcDev Week 2021 Employer Survey Dashboard”, Workforce WindsorEssex, https://www.workforcewindsoressex.com/employer-survey-results/
17
Ibid.
25Between the top in-demand positions and the hard-to-fill
position, similar or the same jobs appear on both lists.
Those being Machinist/Machine Operator, Welder/Tool and
Die Maker/Labourer, and Manager/Academic Manager/
Marketing Manager. Local employers have reported that
hard-to-fill positions are often the result of unavailable
qualified workers. Of 233 responses, the following number
of employers rated the availability of qualified workers
for their business needs as: poor (45), fair (67), good
(40), excellent (3), or n/a (18). When asked whether their
company provides continuing education or reimburses
employees for continuing education, 225 employers
responded with the following: 42.3% offered education that
relates to the position, 44.6% did not provide or reimburse
continued education, and 13.1% supported all continuing
education opportunities.
Decades of workforce development research has proven
that continuing education positively contributes to a
stabilized and qualified labour force. When asked about
the stability of the workforce according to their business
needs, 232 employers responded the with the following:
poor (30), fair (63), good (58), excellent (2), and n/a (21).
With nearly half of employers reporting that they offer no
continued education and 93 of 233 employers indicating a
fair to poor stabilized workforce, it is fair to say that there
is a gap between employer workforce needs and employer
willingness to provide workforce investments. When asked
about the ability to retain new employees, 232 employers
rated it: poor (18), fair (51), good (66), excellent (18), and
n/a (22). These numbers are reflected in the percentage
of employers who offer continued education (42.3%) and
with those who did not offer continued education (44.6%).
To promote a stable and attractive workforce, industry
leaders should collaborate with education to develop short,
flexible programs to support the development of new and
entry-level workers so that they may become more qualified
workers and can pivot into middle and senior roles in their
industry or transition to similar industries during economic
downturns (LeBlanc, 2021).
26ONLINE JOB POSTINGS
Examining online job postings captured by Workforce WindsorEssex’s Monthly Job Demand
Report further demonstrates the demand for an available and skilled workforce in the region.
ONLINE JOB POSTINGS BY MUNICIPALITY IN NOVEMBER 2021
70%
SOR
WIND
H
SE
2% UM LAKESHORE 2%
LASALLE C
TE 6%
G
2% UR
B
R ST KINGSVILLE LEAMINGTON
HE ESSEX
AM
5% 8%
3%
PELEE
TOP 10 POSTED FOR OCCUPATIONS, NOVEMBER 2021:
1. Retail Salespersons
2. Material Handlers
3. Transport Truck Drivers
4. Other Customer and Information Services Representatives
5. Food Counter Attendants, Kitchen Helpers and Related Support Occupations
6. Retail and Wholesale Trade Managers
7. Administrative Assistants
8. Store Shelf Stockers, Clerks and Order Fillers
9. Electrical and Electronics Engineers
10. Home Support Workers, Housekeepers and Related Occupations
Table 9: Top 10 Posted for Occupations, November 2021.
These top jobs further support the in-demand and hard-to-fill jobs shared in the EcDev survey
by a majority of employers in the Retail and Manufacturing sectors. This list captures the in-
demand jobs with occupations like Retail Salespersons and Administrative Assistants that are not
necessarily hard-to-fill, but are in-demand.
27THE LABOUR FORCE BY OCCUPATION
AND INDUSTRY
There is a range of occupations within different industries in Windsor-Essex. Here is a breakdown of
the regional labour force by its top 10 industries ranked by employment and as a percentage of the
total labour force in the Windsor CMA as of October 2021 and compared to October 2020.18
INDUSTRY OCTOBER 2021 OCTOBER 2020
Manufacturing 32,100 (19%) 40,300 (26%)
Wholesale and Retail Trade 26,000 (15%) 14,600 (9%)
Health Care and Social Assistance 24,300 (14%) 18,700 (12%)
Educational Services 12,600 (7%) 10,300 (7%)
Accommodation and Food Services 12,600 (7%) 10,300 (7%)
Finance, Insurance, Real Estate, Rental and Leasing 10,600 (6%) 7,700 (5%)
Professional, Scientific and Technical Services 10,100 (6%) 8,000 (5%)
Construction 10,000 (6%) 15,900 (10%)
Transportation and Warehousing 8,800 (5%) 7,300 (5%)
Public Administration 6,300 (4%) 6,300 (4%)
Table 10: Labour force by Industry, October 2021 vs. October 2020.
18
Statistics Canada, Labour Force Survey, 2021.
28PROMISING SECTORS AND OCCUPATIONS
This section of the LLMP predicts growth in certain occupations from 2021-2026. These results were
found using Emsi Analyst. In this section, and throughout the report, occupations will be paired with
the corresponding National Occupation Classification (NOC) code. The NOC is Canada’s national
system of organizing and describing occupations. Every occupation is identified by a four-digit NOC
code. NOC codes receive a structural revision every 10 years. This revision includes a review of
the Classification’s structure and existing occupational categories. NOC codes were most recently
updated September 2021. The development of this report began in early 2021 and will use the 2016
version of NOC codes.19 The 2021 version of NOC codes will be used for the 2022-2023 LLMP
report.
PREDICTED TOP 10 GROWTH OCCUPATIONS IN WINDSOR-ESSEX: 2021-2026
2021 2021-
2021 2026
NOC OCCUPATION 2026 2026 %
JOBS JOBS
CHANGE: CHANGE:
Registered Nurses and Registered Psychiatric
3012 3,814 4,407 593 16%
Nurses
7231 Machinists and Machining and Tooling Inspectors 2,081 2,505 424 20%
Nurse Aides, Orderlies and Patient Service
3413 3,529 3,931 402 11%
Associates
9416 Metalworking and Forging Machine Operators 2,072 2,331 259 12%
7511 Transport Truck Drivers 3,385 3,621 235 7%
Other Customer and Information Services
6552 1,991 2,216 224 11%
Representatives
Food Counter Attendants, Kitchen Helpers and
6711 5,016 5,219 203 4%
Related Support Occupations
9418 Other Metal Products Machine Operators 2,251 2,444 193 9%
9522 Motor Vehicle Assemblers, Inspectors and Testers 4,095 4,275 180 4%
6611 Cashiers 4,087 4,265 178 4%
Table 11: Predicted Top 10 Growth Occupation in Windsor-Essex: 2021-2026.20
19
Statistics Canada, Notice of release of the National Occupational Classification (NOC) 2021 Version 1.0
20
Emsi Analyst, 2021.
29In this section, and throughout the report, industries will be paired with the corresponding North
American Industry Classification System (NAICS) code. NAICS are a classification of business
establishments used in North America. Each establishment is classified to an industry (with a 6-digit
code) according to the primary business activity taking place.
PREDICTED TOP 10 GROWTH INDUSTRIES IN WINDSOR-ESSEX: 2021-2026
2021 - 2021 -
2021 2026
NAICS INDUSTRY DESCRIPTION 2026 2026 %
JOBS JOBS
CHANGE CHANGE
62 Health Care and Social Assistance 21,327 23,078 1,751 8%
54 Professional, Scientific and Technical Services 5,881 6,377 496 8%
52 Finance and Insurance 5,082 5,551 469 9%
41 Wholesale Trade 6,791 7,252 460 7%
48-49 Transportation and Warehousing 7,307 7,757 451 6%
31-33 Manufacturing 36,034 36,439 405 1%
Administrative and Support, Waste Management
56 8,970 9,330 360 4%
and Remediation Services
44-45 Retail Trade 17,429 17,682 253 1%
61 Educational Services 11,552 11,760 208 2%
23 Construction 8,421 8,515 94 1%
Table 12: Predicted Top 10 Growth Industries in Windsor-Essex: 2021-2026.21
As our local
population ages, and
with the pressure
of the ongoing
pandemic, the demand
for staff in the Health
Care industry is likely
to continue for years
to come.
21
Emsi Analyst, 2021.
30EMPLOYMENT
ONTARIO
DATA
31Workforce WindsorEssex was provided with client data for those accessing Employment Ontario
services during the reporting period of 2020-2021. The scope of Employment Ontario services
includes Employment Services (ES), Second Career, Literacy and Basic Skills, and Apprenticeships.
All programs are maintained under the Ministry of Labour, Training and Skills Development and
have been developed to connect clients with opportunities to engage in the local workforce. Analysis
of this data set provides some of the year-over-year trends and outcomes of individuals accessing
Employment Ontario services. The data reported and presented reflects closed cases for the given
fiscal year, which runs from April 1 to March 31. A closed case refers to a client’s service plan
closure.
DEMOGRAPHIC INFORMATION OF CLIENTS
SERVED – EMPLOYMENT SERVICES
The number of clients served in Windsor-Essex during the reporting period was 5,668. This was
a significant decrease of 2,194 clients from 2019-2020, and represents a consistent decrease
continuing from 2016-2017. The substantial decrease of clients served between 2019-2020 and
2020-2021 may also be a result of COVID-19 impacts on services and closure of agencies during
lockdowns and other public health and safety measures.
NUMBER OF EMPLOYMENT SERVICES CLIENTS SERVED IN WINDSOR-ESSEX: 2016-2021
Figure 8: Number of Employment Services Clients Served in Windsor-Essex: 2016-2021
Source: Ministry of Labour, Training and Skills Development, Local Board Report, 2021.
The following graph shows the breakdown of clients, year-over-year and by age range. The largest
groups served continues to be those aged 25-44. While there is a continued decrease, year-after-
year, of clients served, there was an increase of clients served within certain age groups. A total of
47% of clients served are those in their prime working years, an increase of 3% from 2017. All age
populations experienced a decrease in clients served from 2019-2020 to 2020-2021. Clients aged
15-24 being served decreased by 34%, aged 25-44 by 27%, ages 45-64 by 23%, and 65 and older
32by 26%. This suggests that between 2020-2021, those aged 25-44 accessed employment services
more than any other age group. Employment Services’ clients represent many different groups, such
as those who are entering the workforce after completing post-secondary education, those who have
been laid off, those who are looking for new career pathways, or those who are looking for specific
programming offered through Employment Services Service Providers (ESSP).
CLIENTS SERVED BY AGE GROUP IN WINDSOR-ESSEX: 2016-2021
Figure 9: Clients Served by Age Group in Windsor-Essex: 2016-2021
Source: Ministry of Labour, Training and Skills Development, Local Board Report, 2021.
CLIENTS SERVED BY GENDER IN WINDSOR-ESSEX IN 2020-2021
Figure 10: Clients Served by Gender in Windsor-Essex: 2020-2021
Source: Ministry of Labour, Training and Skills Development, Local Board Report, 2021.
Between 2020-2021, 53% of clients served identified as female and 47% of clients served identified
as male.22 Identifying females accessing employment services decreased by 1% from 2019-2020,
and identifying males increased by 1%. Historically, women are less likely to access Employment
Services. During the pandemic, women were disproportionately displaced out of employment for
multiple reasons. Women are still considered the primary caregiver in many households and so
many were expected to leave or reduce hours of their employment to support children who were
attending school online, to take care of family members, or had been laid off from their employment
as businesses reacted to physical distancing protocols and other public health measures.
22
Scientifically, data around sex has been simplified to be female and male. This report acknowledges that this data does not include intersex and other variations of human sex
chromosomes that are more complex than female and male.
33In February 2020, 63% of males and 58% of females participated in the labour force. By April 2020,
60% of males and 52% of females participated in the labour force.23 The gap between males and
females participating in the labour force increased by 3% (a total gap of 8%) between February and
April as a result of lockdowns during the State of Emergency in Ontario. As of October 2021, nearly
20 months into the pandemic, the participation rate in the labour force by males is 65% and 57% by
females (a total gap of 8%).24
The disparity between men and women in the labour force is not a new concept. Previous LLMPs
have identified this challenge year-after-year. Access to child care has always significantly impacted
the participation rate of women in the workplace. In April 2021, the provincial government approved
the City of Windsor’s Child Care and Early Years plan for providing emergency child care for
school-aged children of frontline workers (County of Essex, 2021). The child care subsidy would
be available while schools were expected to remain closed. Research continues to suggest that
without accessible child care through government subsidies on a regular basis, there can be no full
economic recovery (Canadian Labour Congress, 2020; The Star, 2020).
EMPLOYMENT SERVICES CLIENTS SERVED IN WINDSOR-ESSEX BY DESIGNATED GROUPS:
2016-2021
Newcomer Person with Disability Francophone Racialized
Indigenous Group Internationally Trained Professionals
Figure 11: Employment Services Clients Served in Windsor-Essex by Designated Groups: 2016-2021
Source: Ministry of Labour, Training and Skills Development, Local Board Report, 2021.
The largest served client population in a designated group in 2020-2021 was internationally trained
professionals. All designated groups25 decreased with regard to accessing employment services from
2019-2020 to 2020-2021. This decrease is reflective of the reduced immigration to Canada during
the pandemic, as well as reduced agency or resource accessibility as a result of COVID-19 public
health and safety measures, such as facility lockdowns. In 2020-2021, the employment services
accessed by newcomer designated group reduced by 35%, the person with disability designated
group reduced by 32%, the francophone designated group reduced by 36%, the racialized
designated group reduced by 19%, and the international trained professional reduced by 23%. It
can be seen in the graph above that internationally trained professionals, as well as racialized and
newcomer designated groups access employment services most, year-after-year.
23
Statistics Canada, Labour Force survey, 2021.
24
Ibid.
24
Note that in pervious years the racialized designated group was called “visible minority group” and the Indigenous designated group was previously under another title
indicating indigeneity to Canada.
34With internationally trained professionals being the largest designated group seeking employment
services between 2020-2021, it is vital that employment services partner with education and
essential language learning services so that these groups can receive Canadian certification in same
or similar occupations they held in their home country. Local employers can engage with the Windsor
Essex Local Immigration Partnership (WE LIP) to find ways to connect with newcomers, racialized
people, and internationally trained professionals. By engaging with WE LIP, local employers can fill
in-demand jobs and other qualified skilled worker gaps by connecting with the mentioned designated
groups. There are many benefits that can come as a result of employer and WE LIP connections,
those being that more newcomers, racialized people, and internationally trained professionals find
employment and are able to financially support their families and engage in positive socio-economic
mobility, and that the unemployment rate lowers in our region.
EMPLOYMENT SERVICES CLIENTS IN WINDSOR-ESSEX BY LEVEL OF EDUCATION: 2016-2021
Less than Grade 9 Less than Grade 12 Completion of Secondary Certificate of Apprenticeship/Journey Person
Completion of College (Certificate/Diploma) Completion of University (Applied/Associate/Bachelor Degree) Post Graduate
Other (Some Apprenticeship/College/University)
Figure 12: Employment Services Clients in Windsor-Essex by Level of Education: 2016-2021
Source: Ministry of Labour, Training and Skills Development, Local Board Report, 2021.
The graph shows employment services clients in Windsor-Essex by level of education. The
pandemic severely disrupted education. It can be seen in the graph that nearly every category of
clients served by level of education decreased between 2020-2021. The largest group of clients
served by level of education were those that completed secondary school and have a high school
diploma. A total of 42% of clients completed post-secondary education, including an apprenticeship
certificate, college diploma, or university degree. The 9% drop over last year’s number may be
a result of students putting a hold on completing post-secondary education while navigating
other pandemic-related issues. Many associate the completion of post-secondary education with
sustainable employment. The decrease in post-secondary attainment may also contribute to the
high unemployment rates the region has had throughout the pandemic. Windsor-Essex reached
its highest rate of unemployment for 2021 in June when unemployment was 11.7%. In July, the
unemployment rate in Windsor-Essex was 11.5% and in August it was 11.2%.26 Educational
institutions opened their on-site doors to students who were fully vaccinated in September 2021. It is
predicted that the reopening of on-site education to students will result in an increase of completed
post-secondary education for 2021-2022.
26
Statistics Canada, Labour Force survey, 2021.
35EMPLOYMENT SERVICES CLIENTS IN WINDSOR-ESSEX BY LENGTH OF TIME OUT OF
EMPLOYMENT/TRAINING: 2016-2021
Less than 3 months 3-6 months 6-12 months More than 12 months Unknown
Figure 13: Employment Services Clients in Windsor-Essex by Length of Time Out of Employment/Training: 2016-2021
Source: Ministry of Labour, Training and Skills Development, Local Board Report, 2021.
A total of 36% of new clients working with ESSPs had been out of work for less than three months. In
2016, those out of employment between three to more than 12 months made up a majority of clients
served by length of time out of employment/training. At the time, ESSPs indicated that the longer the
clients were disengaged from the workforce, the more barriers they faced assisting clients to regain
employment (Workforce WindsorEssex, 2017).
Since 2016-2017, the number of clients out of work for more than three months has continued
to decrease. The share of clients out of work for less than three months in 2016 was 46%, which
is a 10% decrease over five years compared to the 36% between 2020-2021. ESSPs have
communicated that to ensure clients do not become disengaged from the labour force while out of
work, they leverage Workforce WindsorEssex’s tools and connect with other agencies that offer skill
development to support individuals with opportunities for employment.
36You can also read