Low competitive status elicits aggression in healthy young men: behavioural and neural evidence
←
→
Page content transcription
If your browser does not render page correctly, please read the page content below
Social Cognitive and Affective Neuroscience, 2021, 1–15
doi: 10.1093/scan/nsab061
Advance Access Publication Date: 7 May 2021
Original Manuscript
Low competitive status elicits aggression in healthy
Downloaded from https://academic.oup.com/scan/advance-article/doi/10.1093/scan/nsab061/6271067 by guest on 19 May 2021
young men: behavioural and neural evidence
Macià Buades-Rotger,1,2,3 Martin Göttlich,1 Ronja Weiblen,1,4
Pauline Petereit,1 Thomas Scheidt,1 Brian G. Keevil,5 and
Ulrike M. Krämer1,2,6
1
Department of Neurology, University of Lübeck, Lübeck, Schleswig-Holstein 23562, Germany, 2 Department of
Psychology, University of Lübeck, Lübeck, Schleswig-Holstein 23562, Germany, 3 Donders Institute for Brain,
Cognition and Behaviour, Radboud University, Nijmegen, Gelderland 6525 HR, The Netherlands, 4 Department
of Psychiatry and Psychotherapy, University of Lübeck, Lübeck, Schleswig-Holstein 23562, Germany,
5
Department of Clinical Biochemistry, University Hospital of South Manchester, Manchester, M23 9LT, UK, and
6
Center of Brain, Behavior and Metabolism (CBBM), University of Lübeck, Lübeck, Schleswig-Holstein 23562,
Germany
Correspondence should be addressed to Macià Buades-Rotger, Donders Institute for Brain, Cognition and Behaviour, Radboud University, Montessorilaan
3, Nijmegen, Gelderland 6525 HR, The Netherlands. E-mail: m.buadesrotger@donders.ru.nl.
Abstract
Winners are commonly assumed to compete more aggressively than losers. Here, we find overwhelming evidence for the
opposite. We first demonstrate that low-ranking teams commit more fouls than they receive in top-tier soccer, ice hockey
and basketball men’s leagues. We replicate this effect in the laboratory, showing that male participants deliver louder sound
blasts to a rival when placed in a low-status position. Using neuroimaging, we characterize brain activity patterns that encode
competitive status as well as those that facilitate status-dependent aggression in healthy young men. These analyses reveal
three key findings. First, anterior hippocampus and striatum contain multivariate representations of competitive status.
Second, interindividual differences in status-dependent aggression are linked with a sharper status differentiation in the
striatum and with greater reactivity to status-enhancing victories in the dorsal anterior cingulate cortex. Third, activity in
ventromedial, ventrolateral and dorsolateral prefrontal cortex is associated with trial-wise increases in status-dependent
aggressive behaviour. Taken together, our results run counter to narratives glorifying aggression in competitive situations.
Rather, we show that those in the lower ranks of skill-based hierarchies are more likely to behave aggressively and identify
the potential neural basis of this phenomenon.
Key words: aggression; status; competition; fMRI; neuroimaging
Introduction 2017; Cheng, 2020; Weick, 2020). Indeed, adjectives such as
‘aggressive’ or ‘dominant’ are frequently casted in a positive
Winners are often taken to be aggressive, not only in sportive
environments (Chow et al., 2009; Trebicky et al., 2013) but in light in competitive contexts (Næss, 2001; Pappas et al., 2004),
society at large (Waasdorp et al., 2013; Laustsen and Petersen, and leaders perceived to possess these characteristics are pre-
Received: 26 August 2020; Revised: 23 April 2021; Accepted: 5 May 2021
© The Author(s) 2021. Published by Oxford University Press.
This is an Open Access article distributed under the terms of the Creative Commons Attribution-NonCommercial License (http://creativecommons.org/
licenses/by-nc/4.0/), which permits non-commercial re-use, distribution, and reproduction in any medium, provided the original work is properly cited.
For commercial re-use, please contact journals.permissions@oup.com
1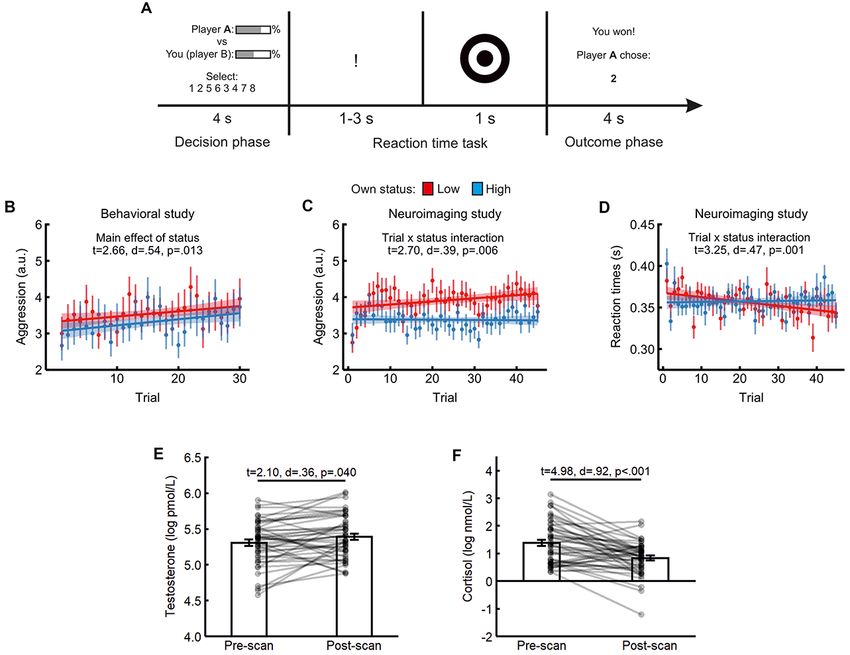
2 | Social Cognitive and Affective Neuroscience, 2021, Vol. 00, No. 00

ferred in conflict situations (Kakkar and Sivanathan, 2017). From        in those linked with retaliation such as the VS (Chester and
this perspective, aggression might serve to both achieve and             DeWall, 2016; Buades-Rotger et al., 2016a), and/or in areas sug-
assert a higher social rank (Lee and Yeager, 2020). In agree-            gested to regulate aggression such as the vmPFC (Buades-Rotger
ment with this idea, individualstend to deliver louder sound             et al., 2019; Bertsch et al., 2020).
blasts to a rival they outperformed than to one who outper-                   A potentially crucial neuromodulator of status-seeking
formed them (Muller et al., 2012). Contradicting these findings,         behaviour is the steroid hormone testosterone. Although
the lower sense of control and the frustration occasioned by fre-        generally associated with aggression (Geniole et al., 2020), recent
quent defeats can fuel aggression in subordinate competitors             evidence indicates that testosterone can flexibly promote proso-
(Przybylski et al., 2014; Oxford et al., 2017; Dowsett and Jackson,      cial behaviour in order to improve one’s social status (Eisenegger
2019). Supporting this notion, a number of studies have shown            et al., 2011; Terburg and van Honk, 2013; Geniole and Carré,

                                                                                                                                               Downloaded from https://academic.oup.com/scan/advance-article/doi/10.1093/scan/nsab061/6271067 by guest on 19 May 2021
that individuals are more aggressive towards persons with high           2018). For instance, a study showed that endogenous testos-
status (Davis and Reyna, 2015; Hu et al., 2016; Saalfeld et al.,         terone was positively associated with generosity in low-status
2018; Kakkar et al., 2019), as low status might impede goal attain-      (i.e. junior) rugby players, whereas the relationship was neg-
ment (Berkowitz, 2012), induce stress (Sapolsky, 2004, 2005) and         ative in high-status (i.e. senior) players (Inoue et al., 2017).
threaten self-image (Horton and Sedikides, 2009). Furthermore,           Similarly, men with relatively higher testosterone concentra-
while accomplished contestants can rely on their ability, less           tions punished unfair offers more severely but rewarded fair
proficient ones might compete more aggressively to outweigh              offers more generously (Dreher et al., 2016). Given that high-
the skill differential (Kirker et al., 2000; Coulomb-Cabagno and         testosterone individuals are generally more sensitive to status
Rascle, 2006). Hence, those in the lower ranks of skill-based            cues (Josephs et al., 2006; Wagels et al., 2018; Losecaat-Vermeer
hierarchies might be more prone to use aggression than those             et al., 2020; Wu et al., 2020; Han et al., 2021) and that competi-
who win consistently. If that were the case, social narratives           tive situations inherently invoke the use of aggressive strategies
emphasizing aggressiveness as a requisite for competitive suc-           (Waddell and Peng, 2014; Dowsett and Jackson, 2019), testos-
cess would be misguided. Here, we tested whether competitive             terone might increase competitive aggression by modulating
status is related to physical aggression and investigated the            neural reactivity to status signals. Specifically, both preparatory
neural underpinnings of this association.                                and victory-contingent testosterone surges can induce com-
    Status-based hierarchies order social life and are hence             petitive aggression by activating core neural structures of the
imprinted in human neurobiology (Qu et al., 2017). The ros-              threat- and reward-processing systems (i.e. amygdala and VS,
tral aspect of the medial prefrontal cortex (mPFC) has been              respectively) (Geniole and Carré, 2018). Importantly, the effect
postulated as a crucial region for inferring a rival’s dominance         of testosterone on the neural circuitry of competitive aggression
during competitive interactions (Ligneul et al., 2016), which            is likely to be more pronounced in men (Zilioli and Bird, 2017),
might be partially attributable to this region’s role in encoding        who show stronger endocrine reactivity to competition (Geniole
stable behavioural traits (Hassabis et al., 2013). The amygdala          et al., 2017) as well as a tighter association between testosterone
and anterior cingulate cortex (ACC), on the other hand, have             and aggression (Geniole et al., 2020). The relationship between
been suggested to track moment-to-moment changes in status-              status-seeking behaviour and testosterone might however be
based hierarchies (Kumaran et al., 2012, 2016). The ventral stria-       moderated by cortisol, a stress-related hormone that is thought
tum (VS) and ventromedial prefrontal cortex (vmPFC) are highly           to partly suppress testosterone’s effects (Casto and Edwards,
responsive to competitive outcomes and might thus also con-              2016; Dekkers et al., 2019). In the present study, we drew on pre-
tribute to acquire status representations during skill-based con-        existing sports data, a behavioural study and a neuroimaging
tests (Ligneul et al., 2016). Further, these regions show enhanced       study to test (i) whether competitive status is linked with aggres-
reactivity to high- as compared to low-status individuals during         sion in healthy young men, (ii) whether this is contingent on
both competitive (Zink et al., 2008) and non-competitive tasks           the neural processing of status signals and (iii) whether testos-
(Zerubavel et al., 2015). In addition, there is evidence suggesting      terone amplifies aggressive and/or neural responses to status
that the hippocampus encodes relational knowledge of social              cues, either by itself or in interaction with cortisol.
hierarchies (Kumaran et al., 2012; Schafer and Schiller, 2018;
Park et al., 2020), along with regions involved in social cogni-
tion such as the precuneus and the temporoparietal junction              Correlational study
(TPJ) (Muscatell et al., 2012; Tavares et al., 2015; Zerubavel et al.,
                                                                         In a first correlational study, we probed whether competitive
2015). Thus, the current neuroscientific evidence permits to for-
                                                                         status was associated with aggressive play across seasons in soc-
mulate a tentative description of how competitive hierarchies
                                                                         cer, basketball and ice hockey. This proof-of-principle approach
are processed in the human brain. First, regions associated with
                                                                         allowed us to test the link between competitive status and
salience detection (amygdala, ACC) capture dominance signals
                                                                         aggression in real-world settings.
and status changes during social interactions. Second, regions
involved in affective valuation (VS, vmPFC) assess an individ-
ual’s current status and facilitate hierarchy learning on the
                                                                         Correlational study: data acquisition
basis of victories and defeats. Finally, the mentalizing network
(precuneus, TPJ, dorsal and rostral mPFC) and the hippocam-              We defined competitive status as a team’s position at the end
pus enable the encoding and implementation of status hier-               of the regular season, with higher values indicating a lower
archies during competitive decision-making. The key question             standing in the rankings. Aggression was operationalized as
that we addressed here is which role these neurocognitive pro-           the number of fouls (soccer), personal fouls (basketball) or
cesses play in status-dependent aggression. We reasoned that             penalty time (ice hockey) incurred relative to received, a mea-
the neural substrate of status-processing and aggression should          sure that accounts for the reciprocal, ‘tit-for-tat’ character of
show some degree of overlap, be it in subcortical structures             sports aggression. For basketball and ice hockey, we deter-
assumed to generate aggressive impulses such as the amygdala             mined the position of teams from different divisions on the
(Da Cunha-bang et al., 2017; Buades-Rotger and Krämer, 2018),           basis of their win percentage. We manually extracted data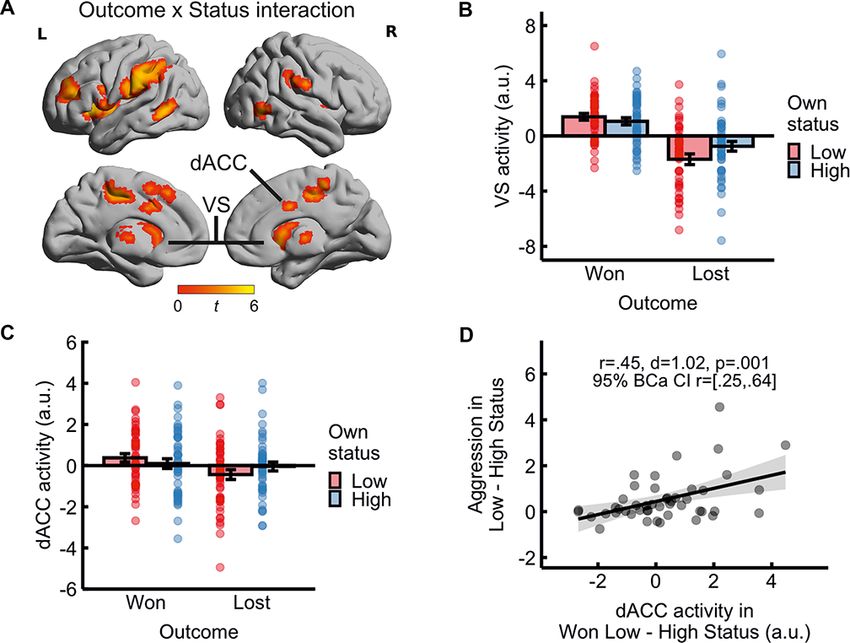
M. Buades-Rotger et al. | 3

from http://www.footstats.co.uk (soccer), http://www.nba.com                             and team as a grouping factor. Following best-practice recom-
(basketball) and http://www.hockey-reference.com (ice hockey)                            mendations (Barr et al., 2013), we attempted to maximize the
since the last year in which complete, correct, data were avail-                         random-effects structure of the model defining by-team random
able onwards (2000–2008 for European football leagues, 2005                              slopes for all fixed effects and random intercepts for all predic-
for basketball and hockey). We collapsed these variables sep-                            tors where possible. The most complex model to converge was
arately for the main five European football leagues (England,                            one with random slopes for season and random intercepts for
Spain, Germany, Italy and France), the North-American National                           league, position and team.
Basketball Association league (NBA) and the North-American                                   All analyses were performed in R version 3.6.1 running on
National Hockey League (NHL) for a total of 2254 observations                            R Studio 1.1.423. We used the psych package (Revelle, 2017)
(i.e. teams in a given season). By using data aggregated over                            for Spearman correlations and ggplot2 for plotting (Wickham,

                                                                                                                                                                               Downloaded from https://academic.oup.com/scan/advance-article/doi/10.1093/scan/nsab061/6271067 by guest on 19 May 2021
seasons we minimize the effect of proximal situational influ-                            2016). For linear mixed-effects modelling, we used the lmerTest
ences (home-field advantage, referee biases, etc.) that might                            package (Kuznetsova et al., 2017). Data and analysis scripts
induce fluctuations in the number of fouls incurred in sin-                              for this study are available via the Open Science Foundation
gle games. The correlation between received and committed                                (https://osf.io/2jvx4/).
fouls or penalties was r1412 = 0.74 for football, r418 = 0.70 for
basketball and r418 = 0.93 for ice hockey. This indicates that
(i) aggressive play follows reciprocal, ‘give-and-take’ dynam-                           Correlational study: results
ics so that teams who commit more fouls also tend to receive                             As shown in Figure 1, low ranking was consistently asso-
more but (ii) that the ratio of fouls/penalties committed to                             ciated with the foul ratio in each individual league as well
received captures some unique variance in teams’ aggressive-                             as across leagues (mean weighted ρ = 0.30; Cohen’s d = 0.63,
ness that is not accounted for by the raw amount of fouls                                P < 0.001). When pooling over all competitions (Figure 1H), low-
or penalty time incurred. This is thus a valid measure to                                ranking teams (Z-transformed position > 1) showed on average
assess the degree to which a team engages in sanctioned                                  a 9.5% greater foul ratio (104.68% vs 95.18%) than high-ranking
aggression.                                                                              ones (Z-transformed position 0.124; Table 1).

Because of the ranked nature of the data, we computed Spear-
man correlation coefficients between position and foul ratio. We
                                                                                         Behavioral study
also tested whether this relationship held across seasons and
leagues and when accounting for the nested data structure. To                            Our analysis of sports data provides consistent—albeit purely
do so, we ran linear mixed-effects model analyses with posi-                             correlational—evidence for a link between low competitive
tion, season and league as Z-transformed fixed-effect predictors                         status and aggression at the level of teams. It is however

Fig. 1. Correlation between competitive status and aggression in elite sports teams. Status was defined as the team’s final position at the end of a season. Aggression
was defined as the ratio of fouls (soccer), personal fouls (basketball) or penalty time (ice hockey) incurred relative to received (%). We collapsed data across seasons. We
include best-fit lines and 95% prediction intervals. (A) English Premier League 2000–19, (B) Spanish Primera División 2005–19, (C) German Bundesliga 2006–19, (D) Italian
Serie A 2005–19, (E) French Ligue 1 2008–19, (F) North-American National Basketball Association League 2005–19, (G) North-American National Basketball Association
League 2005–19, (H) all data points collapsed, with position expressed as Z-scores.
4 | Social Cognitive and Affective Neuroscience, 2021, Vol. 00, No. 00
Table 1. Results of linear-mixed effects model predicting foul/ each opponent. After eight practice trials, the task started
penalty ratio in sports teams (n = 2254) (see Figure 2A for an outline of the task). Trials began with a
decision phase wherein subjects saw the percentage of trials
Dependent variable: fouls/
won by their current opponent and by themselves as separate
penalty time self: rival
filled bars, i.e. their competitive status. During the decision
Predictor β SE T P phase, participants set the volume of a sound blast in a 1–8
scale to be later delivered at their opponent should they win
Position 0.219 0.025 8.809M. Buades-Rotger et al. | 5
Downloaded from https://academic.oup.com/scan/advance-article/doi/10.1093/scan/nsab061/6271067 by guest on 19 May 2021
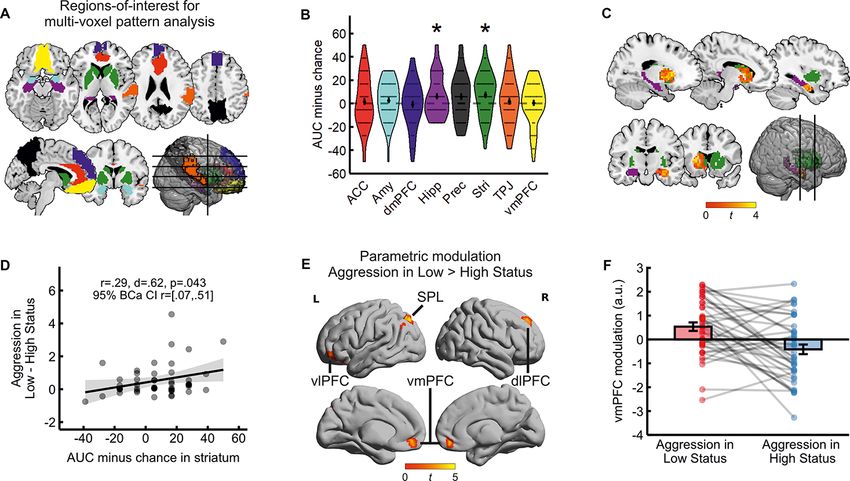
Fig. 2. (A) Outline of the task. Subjects saw the % of victories achieved by the opponent and themselves as a filled bar while choosing the volume of a sound blast to
be later directed at their opponent (decision phase). Then, they had to be faster than the rival in pressing a button when a jittered bullseye appeared (reaction time
task). In the outcome phase they were informed of whether they won or lost and of the rival’s selection. If they lost, they received the sound blast at the end of the
trial via headphones. They were consistently worse against one opponent (low-status condition) and better than the other (high-status condition), though both rivals
chose equally strong sound blasts on average. (B) mean punishment selections by trial and participant status in the behavioral study, including best-fit lines and 95%
prediction intervals. (C) mean aggression by trial and participant status in the neuroimaging study, including best-fit lines and 95% prediction intervals. (D) mean
response latency in the reaction time task by trial and participant status in the neuroimaging experiment. (E) testosterone levels in saliva pre- and post-scanning. (F)
cortisol levels in saliva pre- and post-scanning.
Neuroimaging study Neuroimaging study: participants
In a subsequent neuroimaging study, we used a slightly mod- We determined the sample size on the basis of a previous
ified version of the same task to scrutinize neural responses study (n = 39) in which we observed middle-sized correlations
to status information during a competitive interaction. Further, (r ≈ 0.4) between endogenous testosterone, aggression and brain
we tested whether status-related brain activity was linked with activity using a similar task (Buades-Rotger et al., 2016b). We
actual aggressive behaviour in the task as well as with sali- thus aimed for a sample size of 50, which yields ∼80% power
vary testosterone and cortisol measured before and after scan- to detect effects of r = 0.4 or larger with a two-sided threshold
ning. Unlike the behavioural study, we programmed opponents’ of P < 0.05. After exclusion of six subjects due to non-deception
punishments to stay relatively constant over time. We did so (n = 4) and failure to understand the task (n = 2), the final sam-
in order to disentangle provocation and status effects and to ple comprised 47 men aged 24 ± 3.8 (height: 182 ± 6.6 cm; weight:
render trials more comparable throughout the task for subse- 79.90 ± 11 kg; 37 right-handed, 7 left-handed, 3 ambidextrous)
quent averaging of brain activity. We hence set the opponents who were reportedly free of current psychiatric, neurological
to select punishments in the middle range (3–6) throughout the and endocrine diseases except for one participant with treated
task instead of increasing progressively. We also lengthened the hypothyroidism. We included left-handed participants because
task for a total of 90 trials, divided in three runs of 30 trials we did not have specific hypotheses regarding lateralization of
each (15 per opponent) to increase statistical power. In this case, the effects and because subjects used both hands to perform
the opponents were always confederates of the experimenters the task. This study had also been approved by the Ethics Com-
who pretended to play against the participant from computers mittee of the University of Lübeck. Subjects provided informed
outside the scanner. To increase the plausibility of this set- consent for participation and anonymized dissemination of the
ting, participants played the eight practice trials together with data. We used the same post-experimental questionnaire as in
the confederates in the same computer room where the pilot the behavioural study, and we debriefed them regarding the
measurements had taken place. goals and methods of the study. Measurements began between6 | Social Cognitive and Affective Neuroscience, 2021, Vol. 00, No. 00
12 and 15 PM in order to minimize circadian fluctuations in hor- random by-participant slopes for status and trial. We performed
monal levels, with the exception of two measurements (17 and these analyses using the lmerTest package (Kuznetsova et al.,
18 PM) that could not be scheduled otherwise. 2017) in R (version 3.6.1) running on R Studio (version 1.1.423).
For testosterone and cortisol, we compared the pre- and
post-scan log-transformed values using paired t-tests in order
Neuroimaging study: acquisition of testosterone and to inspect for state changes in hormonal concentrations. Two
cortisol data pre-scan testosterone samples had to be discarded because
Subjects provided saliva samples in plastic vials (SafeSeal the amount of saliva did not suffice for reliable quantification.
micro-tube 2 ml from Sarstedt) with the passive drooling We then tested whether mean aggression against the high-
technique before and after scanning. We froze the samples at minus the low-status opponent was associated with baseline
Downloaded from https://academic.oup.com/scan/advance-article/doi/10.1093/scan/nsab061/6271067 by guest on 19 May 2021
−20◦ C and shipped them in dry ice to author BGK’s laboratory testosterone, cortisol, the testosterone-to-cortisol ratio and/or
in Manchester (UK) for analysis once study was completed. Free pre-post changes in either hormone using Pearson correlation
testosterone and cortisol concentrations were estimated with coefficients. For paired t-tests, we report Cohen’s drm , which
liquid chromatography tandem mass spectrometry (LC-MS/MS) accounts for the correlation between repeated measurements
as described elsewhere (Perogamvros et al., 2009; Keevil et al., (Lakens, 2013). For correlation and regression coefficients, we
2013). Coefficients of variation (CVs) with this technique have converted the corresponding r and t-values to Cohen’s d using
been reported to be 5.3% for testosterone and 8.7% for corti- the psych package’s functions t2d and r2d respectively (Revelle,
sol, whereas mean inter-assay CVs were 9% for testosterone and 2017). We used ggplot2 to plot results (Wickham, 2016).
7.8% for cortisol (Perogamvros et al., 2009; Keevil et al., 2013). The
lower limits of quantification were 5 pmol/L for testosterone and Neuroimaging study: analysis of fMRI data
0.8 nmol/L for cortisol. We performed the pre-processing and analysis of neuroimag-
ing data using Statistical Parametric Mapping 12 (SPM12; https://
Neuroimaging study: acquisition of fMRI data www.fil.ion.ucl.ac.uk/spm/) running on Matlab 2019b. We used
a standard pre-processing pipeline that involved, in this order,
We acquired all scans with a 64-channel head-coil mounted slice-timing correction to the four middle slices (i.e. those
on a 3T Siemens Magnetom Skyra scanner at the Center for acquired at 485 ms) with a fourth degree spline interpola-
Brain, Behavior and Metabolism at the University of Lübeck. For tion, realignment to the first functional volume, coregistra-
functional volumes, we applied a single-shot gradient-recalled tion of mean functional and anatomical images, segmentation
echo-planar imaging sequence sensitive to blood oxygen level of the anatomical images based on default tissue probabil-
dependent contrast (TR = 1060 ms; TE = 30 ms; flip angle = 60◦ ; ity maps, normalization to the Montreal Neurological Insti-
60 transversal slices; slice thickness 3 mm; in-plane voxel tute (MNI) template and smoothing with an 8 mm full-width
size = 3 × 3 mm2 ; field-of-view [FOV] = 210 × 210 mm2 , simulta- at half-maximum Gaussian kernel. Additionally, we performed
neous multi-slice factor = 4; full-brain coverage). We acquired distortion correction using the FieldMap toolbox, except in
570 volumes per run for a total of three runs (≈30 min). Before seven participants for which this procedure failed or worsened
and after the task we acquired two magnetic field measure- image quality. We excluded one imaging run in three sub-
ments (2D double-echo gradient-echo sequence; TE1 = 5,17 ms; jects due to excessive head movements (>3 mm or 3◦ in any
TE2 = 7.63 ms; TR = 554 ms; flip angle = 60◦ ; 50 transversal direction).
slices; slice thickness 3 mm; in-plane voxel size = 3 × 3 mm2 ; First-level models comprised two regressors for the deci-
FOV = 240 × 240 mm2 ) for subsequent offline distortion cor- sion phase (high- or low-status opponent; 4 s) and four for
rection as well as two 6.5 min eyes-closed resting-state runs the outcome phase (won or lost vs high- or low-status; 4 s).
not analysed for the present manuscript. We further acquired We also included the absolute distance in status between sub-
an anatomical scan at the start of each measurement apply- ject and opponent in percentage as a covariate in the decision
ing a 3D T1-weighted Magnetization Prepared-RApid Gradient phase to control for momentary fluctuations in status. As regres-
Echo sequence (TR = 2300 ms; TE = 2.94 ms; TI = 900 ms; flip sors of no interest, we modelled the warning sign, target and
angle = 9◦ ; voxel size = 1 × 1 × 1 mm3 ; FOV = 320 × 320 mm2 ). motor responses in the reaction time task as well as the sound
at the end of the outcome phase as delta functions with null
duration. We further included the six movement parameters
Neuroimaging study: analysis of behavioural and
estimated from realignment (x, y, z, pitch, roll and yaw). We
hormonal data
convolved all regressors (except for motion parameters) with
For the analysis of behavioural data, we first ran a paired t-test the canonical hemodynamic response function, implemented
comparing mean aggression against in the low- vs high-status a high-pass filter with a 128 s cut-off and applied the standard
condition as we had done in the behavioural study. Additionally, SPM autoregressive model AR(1) to control for autocorrelation. In
we ran linear mixed-effects models on participants’ aggressive order to inspect for trial-wise changes in activity associated with
behaviour, decision latencies and reaction times. We specifically aggression, we additionally defined identical first-level models
tested for effects of opponent status (high or low), trial num- that included trial-wise mean-centred punishment selections as
ber (1 to 45) and outcome of the previous trial (won or lost). parametric modulator.
These three variables were defined as fixed effects, whereas sub- We first performed multi-voxel pattern analyses (MVPA)
ject was defined as random effect. We included by-participant to uncover local activation patterns that most differentiated
slopes for all fixed effects and random intercepts for all predic- between the two opponents in the decision phase. We used
tors where possible, adhering to standard guidelines for linear the Decoding Toolbox (Hebart et al., 2015) running on Matlab
mixed-effects modelling (Barr et al., 2013). Models with ran- 2019b to implement a linear support vector machine algorithm
dom slopes for outcome failed to converge, just as those with that classifies multivariate activation patterns for each condi-
random intercepts for status and outcome. Therefore, all mod- tion and run using a leave-one-out cross-validation procedure
els included random intercepts for subject and trial as well as on the corresponding beta images. We ran such an analysisM. Buades-Rotger et al. | 7
within each of eight regions of interest (ROIs) putatively involved Finally, we probed whether interindividual differences
in the relational processing of social status (Zerubavel et al., in status-based aggression were associated with the neu-
2015; Qu et al., 2017; Schafer and Schiller, 2018). We defined ral processing of status signals. We used MarsBaR (http://
these ROIs as bilateral anatomical masks extracted from the marsbar.sourceforge.net/) to extract subject-wise parameter
Automatic Anatomical Labelling atlas (Maldjian et al., 2003): the estimates from ROIs showing above-chance classification in the
amygdala (merge of left and right ‘Amygdala’ masks), anterior MVPA analyses (whole ROI) and from clusters showing sig-
cingulate cortex (‘Cingulum_Ant’ mask), dorsomedial prefrontal nificant activity in the outcome by status interaction (6 mm
cortex (‘Frontal_Sup_Medial’ mask), hippocampus (merge of sphere around peak coordinate). We computed the correla-
left and right ‘Hippocampus’ masks), precuneus (‘Precuneus’ tion coefficients between activity in each ROI/cluster and mean
mask), striatum (merge of ‘Caudate’, ‘Putamen’ and ‘Pallidum’ aggression against the high- minus the low-status opponent.
Downloaded from https://academic.oup.com/scan/advance-article/doi/10.1093/scan/nsab061/6271067 by guest on 19 May 2021
masks), temporal-parietal junction (merge of ‘Temporal_Sup’ We also computed the 95% bootstrapped CIs for the correla-
and ‘SupraMarginal’ masks) and ventromedial prefrontal cortex tion coefficients of significant associations (P < 0.05) in order to
(merge of left and right ‘Rectus’ and ‘Frontal_Med_Orb’ masks). assess their robustness and to protect against the influence of
We resampled the masks to match the voxel size of the func- outlying observations. We performed all bootstrapping analy-
tional data (3 mm). For each of these regions, we extracted the ses using the bootstrap package (version 2019.5) in R (version
participant-wise area under the curve (AUC) minus chance as 3.6.1) running on R Studio (version 1.1.423). We used ggplot2
a classification performance measure. Here, AUC expresses the to depict all neuroimaging results (Wickham, 2016). Behavioral
total surface below the receiver-operating characteristic curve, and ROI data along with analysis scripts for this study are freely
which is obtained by plotting the cumulative true positive rates available via the Open Science Foundation (https://osf.io/2jvx4/).
against the cumulative false positive rates. Hence, higher AUC Raw and pre-processed neuroimaging data are available upon
values indicate a greater capacity to classify between cate- request.
gories. While standard accuracy measures treat all classifica-
tions equally, AUC also takes into account the ‘confidence’ (i.e.
Neuroimaging study: behavioural results
the distance to the decision boundary) that the classifier has
regarding the membership of specific items (Hebart et al., 2015). Participants were 47 healthy young men (age = 24 ± 3.8
In order to assess statistically which ROIs distinguished between [mean ± standard deviation]) who believed to be playing against
conditions, we computed the bootstrapped 95% bias-corrected two other participants. These were actually confederates and
accelerated confidence intervals (BCa CIs) of the average AUC the task was again preprogramed. Here, the status manipulation
for each ROI. ROIs whose CI did not include zero were con- was also successful, as subjects were aware of winning less often
sidered to classify between the high- and low-status rival at against the stronger than against the weaker rival (t46 = 10.05,
an above-chance level. In order to more precisely localize the d = 2.36, P < 0.001). Subjects overestimated the percent of tri-
observed effects, we performed a post-hoc searchlight analysis als won against both the better (41.1% ± 1.6% [mean ± standard
(9-voxel radius sphere) within each ROI showing above-chance error] vs 33%, t46 = 4.74, d = 0.69, P < 0.001) and worse opponents
classification. These analyses were thresholded at P < 0.05, k > 50 (71.9% ± 1.7% vs 66%, t46 = 3.40, d = 0.49, P = 0.001). Again, they
uncorrected. did not perceive the stronger opponent to be more aggressive
We subsequently sought for associations between neural (t46 = 1.26, d = 0.27, P = 0.213). As in the pilot study, subjects
reactivity to status signals and aggression on a within-subject selected higher average punishments against when they were in
basis. We did so by comparing the parametric modulator for a low- than in a high-status position (t46 = 3.57, d = 0.57, P < 0.001;
punishment selections in the low- vs the high-status condition Figure 2C). We thus calculated status-dependent aggression as
using a paired t-test. This analysis tests for brain areas show- the difference in average punishment selections in each con-
ing transient increases in activity as a function of participants’ dition (low minus high status) to be used in later correlation
trial-wise aggression levels against one opponent relative to the analyses with neural and hormonal data.
other. Five participants had to be excluded from this analysis We additionally tested whether subjects’ behaviour changed
due to lack of variability in behaviour (i.e. they chose the same over time using linear mixed-effects models (see Methods). Par-
punishment in all trials). Given that we had no a priori hypothe- ticipants selected louder sound blasts over time when they were
ses for these analyses, we applied a threshold of P < 0.001 at the in a low-status position, whereas their punishment selections
voxel level with a P < 0.05 family-wise error (FWE) correction at remained unchanged in a high-status one (status × trial interac-
the cluster level. tion: β=0.125, t4062 = 2.70, P = 0.006; Figure 2C; Table 2A). Specif-
In the outcome phase, we tested whether wins and losses ically, they evinced an increase of around 0.7 points (≈8.75% of
were differentially processed depending on status using a flex- the scale) in the last (4.09 ± 0.08 [mean ± standard error]) com-
ible factorial analysis. First, we tested the main effects of won pared to the first five trials (3.39 ± 0.21) when low in status.
vs lost in order to reproduce the VS and vmPFC activity com- In contrast, their average aggression levels remained virtually
monly observed during competitive victories. Because subjects unchanged as high-status players (first five trials: 3.47 ± 0.14;
lost more often against one of the two opponents, status and last five trials: 3.49 ± 0.07). Thus, participants selected stronger
outcome were not orthogonal. We therefore did not inspect the punishments in a low rank even when provocation remained
main effect of status. Rather, we directly tested the interaction constant.
between the two factors, namely, the contrast [won high + lost Response latency in the decision phase did not vary as a func-
low] > [lost high + won low] and its opposite using paired t- tion of status, time or their interaction (all P > 0.154; Table 2B).
tests (Supplementary Table S1 in Supplementary Material), and That is, subjects took similarly long to choose the punishment
post-hoc plotted the resulting parameter estimates. For these against either opponent across trials (high status: 1.32 ± 0.16 s;
contrasts, we also set a voxel-level P < 0.001 threshold with a low status: 1.29 ± 0.12 s). Nevertheless, there was a significant
cluster-wise pFWE < 0.05 correction, as the effect of competitive main effect of outcome (β=0.032 ± 0.01, t1073 = 2.34, P = 0.019)
outcomes on the targeted valuation areas is usually detectable such that participants chose about 50 ms faster after losing
in whole-brain analyses (Votinov et al., 2015; Ligneul et al., 2016). (1.27 ± 0.01 ms) than after winning (1.32 ± 0.01 s).8 | Social Cognitive and Affective Neuroscience, 2021, Vol. 00, No. 00
Table 2. Results of linear-mixed effects models in the neuroimaging study (n = 47)
Predictor β SE t P
a) Dependent variable: punishment selections
Status 0.488 0.146 3.347 0.002
Trial 0.141 0.059 2.383 0.020
Outcome 0.005 0.035 0.132 0.895
Status × Trial 0.125 0.046 2.708 0.007
Status × Outcome 0.014 0.048 0.288 0.773
Trial × Outcome 0.049 0.035 1.394 0.164
Downloaded from https://academic.oup.com/scan/advance-article/doi/10.1093/scan/nsab061/6271067 by guest on 19 May 2021
Status × Trial × Outcome 0.041 0.048 0.85 0.395
b) Dependent variable: response latency in decision phase
Status 0.026 0.018 1.426 0.154
Trial 0.020 0.020 0.977 0.331
Outcome 0.032 0.013 2.346 0.019
Status × Trial 0.023 0.018 1.261 0.207
Status × Outcome 0.022 0.019 1.163 0.245
Trial × Outcome 0.008 0.014 0.606 0.545
Status × Trial × Outcome 0.003 0.019 0.168 0.867
c) Dependent variable: response latency in reaction time task
Status 0.001 0.003 0.591 0.554
Trial 0.007 0.002 2.989 0.004
Outcome 0.002 0.002 1.097 0.273
Status × Trial 0.008 0.002 3.258 0.001
Status × Outcome 0.002 0.003 0.656 0.512
Trial × Outcome 0.002 0.002 0.821 0.412
Status × Trial × Outcome 0.002 0.003 0.737 0.461
β: regression coefficient, SE = standard error, t: t-value, P: P-value. Bold values indicate effects significant at P < 0.05.
In the reaction time task, participants became progres- the low-status opponent. Post-hoc searchlight analyses showed
sively quicker as low-status players (status-by-trial interac- that both ventral and dorsal aspects of the left striatum con-
tion: β = 0.008, t4111 = 3.25, P = 0.001; Figure 2D; Table 2C). On tributed to the effect, whereas in the case of the hippocam-
average, subjects were ∼22 ms faster in the last five (3.50 ± pus classification was most strongly driven by its right ante-
0.03 s) relative to the first five trials (3.72 ± 0.06 s) against when rior portion (Figure 3C). We then tested whether a stronger
they had a low status, whereas they were comparably quick multivariate differentiation between opponents was linked with
throughout the task in the high-status condition (first five trials: status-dependent aggression across subjects. To do so, we took
3.64 ± 0.12 s and last five trials: 3.65 ± 0.06 s). This confirms the classification performance values for the hippocampus and
motivational relevance of competitive status for participants’ striatum and correlated them with mean aggression against the
performance. high- minus low-status opponent. Although we observed no
effects for the hippocampus (r45 = −0.03, P = 0.823), there was
Neuroimaging study: testosterone and cortisol results an association between striatum activity patterns and aggres-
Concerning hormonal concentrations, average testosterone sion against the high- minus low-status rival (r45 = 0.29, d = 0.62,
levels increased 1.57% after scanning (t44 = 2.10, d = 0.36, P = 0.043; Figure 3D). In other words, subjects showing a more
P = 0.040; Figure 2D), whereas mean cortisol decreased by 39.74% pronounced differentiation between opponents in the striatum
(t46 = 4.96, d = 0.92, P < 0.001; Figure 2E). Baseline concentra- showed greater status-contingent aggressive behaviour.
tions of testosterone (r43 = 0.08, P = 0.595) or cortisol (r45 = −0.01,
P = 0.973) were neither associated with aggression nor with the Neuroimaging study: trial-by-trial fluctuations in
baseline testosterone-to-cortisol ratio (r43 = 0.10, P = 0.497) or punishment selections
the pre-post-change in either hormone (testosterone: r43 = 0.07, We subsequently inquired whether neural reactivity to sta-
P = 0.627; cortisol: r45 = 0.06, P = 0.686). Therefore, we did not use tus cues influenced punishment selections on a within-subject
endogenous hormone levels for further analyses. basis. We hence performed a parametric modulation analy-
sis comparing trial-wise decisions against in each condition
Neuroimaging study: status-dependent activity
(see Methods). As shown in Figure 3E, greater aggression against
patterns during punishment selection in a low- compared to a high-status position was associated with
With regard to neuroimaging data, we first tested whether ROIs increased activity in vmPFC (t = 4.57, k = 59, x = 9, y = 50, z = −10;
previously linked to the processing of status signals also encode Figure 3B), dorsolateral prefrontal cortex (dlPFC; t = 4.11, k = 57,
competitive status during decisions to aggress (Figure 3A). To x = 21, y = 44, z = 41), ventrolateral prefrontal cortex (vlPFC;
that end, we performed MVPA in the decision phase (see t = 4.79, k = 57, x = −33, y = 32, z = −16) and superior parietal lobe
Methods). This revealed that the striatum and hippocampus (SPL; t = 4.80, k = 88, x = −24, y = −76, z = 47). That is, activity in
distinguished between opponents (Figure 3B). That is, multi- these regions co-varied with participants’ aggressive behaviour
variate activity patterns in these regions could classify at an in a low- relative to a high-status rank. No regions survived in
above-chance level whether subjects were facing the high- or the opposite contrast (high > low).M. Buades-Rotger et al. | 9
Downloaded from https://academic.oup.com/scan/advance-article/doi/10.1093/scan/nsab061/6271067 by guest on 19 May 2021
Fig. 3. Neural processing of competitive status during punishment selection (decision phase). (A) ROIs used in MVPA to identify multivariate status representations
during punishment selection. (B) classification performance expressed as AUC minus chance per each ROI. Each dot shows the AUC value per subject, with higher values
indicating better classification between the better- and worse-performing rivals. Asterisks denote ROIs with significant above-chance accuracy according to bootstrap
resampling. ACC: anterior cingulate cortex; Amy: amygdala; dmPFC: dorsomedial prefrontal cortex; Hipp: hippocampus; Prec: precuneus; Stri: striatum; TPJ: temporal-
parietal junction; vmPFC: ventromedial prefrontal cortex. (C) results of the post-hoc searchlight MVPA analysis within hippocampus and striatum masks (voxel-level
P < 0.05 uncorrected, cluster size k > 50). Higher values indicate a greater contribution to the classification. (D) correlation between classification performance in the
striatum and mean aggression against the high- minus low-status opponent. We include best-fit lines and 95% prediction intervals. r = Pearson correlation coefficient;
d = Cohen’s d; 95% BCa CI: 95% BCa CIs. (E) parametric modulation in the decision phase (voxel-level P < 0.001, cluster-level P < 0.05 FWE corrected, n = 42). Higher values
indicate more trial-wise activity as a function of aggression in a low- relative to a high-status position. dlPFC: dorsolateral prefrontal cortex; SPL: superior parietal lobe;
vlPFC: ventrolateral prefrontal cortex. (F) parameter estimates resulting from the parametric modulation in the vmPFC. A.u.: arbitrary units.
Neuroimaging study: neural processing of competitive We next probed whether the neural processing of victo-
outcomes as a function of status ries and defeats was linked with status-dependent aggres-
sive behaviour. We therefore extracted parameter estimates
In the outcome phase, we observed widespread activation in
from clusters resulting from the [won high + lost low)] > [lost
the contrast won > lost with peaks in the bilateral VS (Supple-
high + won low] contrast (dACC, AI, dlPFC, left and right TPJ,
mentary Table S1 in Supplementary Material). This is in line
precuneus and VS) and correlated them with the status effect
with previous results employing competitive tasks (Votinov et al.,
on aggression. Specifically, we extracted the high- minus
2015; Buades-Rotger et al., 2016a). More importantly, we tested
low-status difference separately for victories and defeats.
the interaction between status and outcome in order to inspect
Because we performed 14 correlations (two values for each of
whether victories and defeats were differently processed in the
seven ROIs), we applied a Bonferroni correction to control for
low- compared to the high-status condition. The interaction
multiple comparisons (0.05/14 = 0.003). Differential reactivity to
contrast [won low + lost high)] > [lost high + won low] revealed
victories in the dACC was significantly associated with aggres-
activation in left anterior insula (AI), dorsal anterior cingu-
sion against the high- minus the low-status opponent (r45 = 0.45,
late cortex (dACC), left dorsolateral prefrontal cortex (dlPFC),
d = 1.02, P = 0.001; Figure 4D). There was no correlation for losses
left and right TPJ, precuneus and VS (Figure 4A-C; Supplemen-
(r45 = 0.12, P = 0.394). Activity in the rest of ROIs (AI, dlPFC, left
tary Table S1 in Supplementary Material for complete results).
and right TPJ and VS) was not associated with status-dependent
These regions hence reacted more strongly to infrequent, status-
aggression at a corrected level (all P > 0.050; Supplementary Table
incongruent outcomes. However, as becomes apparent from
S2 in Supplementary material).
the parameter estimates in the VS and dACC (Figure 4B-C), the
interaction was driven by a stronger effect of the outcome when
playing against the high- relative to the low-status opponent. Discussion
If the effect were merely driven by the infrequency or unpre-
Low competitive status is associated with aggression
dictability of events, activity should be also increased in lost rel-
ative to won trials against the low-status opponent, which was Aggressiveness is often taken as a requisite for competitive suc-
not the case. The opposite contrast, which entailed expectable, cess (Chow et al., 2009; Trebicky et al., 2013; Waasdorp et al.,
status-congruent outcomes, yielded activation in primary visual 2013; Laustsen and Petersen, 2017; Cheng, 2020; Weick, 2020).
and inferior temporal cortex as well as a cluster in the brainstem However, better contenders can rely on their skill, whereas
(Supplementary Table S1 in the Supplementary Material). less successful ones may use aggression to hamper rivals’10 | Social Cognitive and Affective Neuroscience, 2021, Vol. 00, No. 00
Downloaded from https://academic.oup.com/scan/advance-article/doi/10.1093/scan/nsab061/6271067 by guest on 19 May 2021
Fig. 4. Neural processing of competitive victories and defeats (outcome phase). (A) regions showing a significant interaction between status and outcome (voxel-
level P < 0.001, cluster-level P < 0.05 FWE corrected). (B) parameter estimates for the interaction effect in the VS. (C) parameter estimates for the interaction effect in the
dACC. (D) correlation between dACC reactivity to victories and aggression in the low- minus high-status condition, including best-fit lines and 95% prediction intervals.
r = Pearson correlation coefficient; d = Cohen’s d; 95% BCa CI.
progress (Kirker et al., 2000; Coulomb-Cabagno and Rascle, higher-status opponents (Saalfeld et al., 2018). Competitive sta-
2006). Moreover, the frustration and loss of control entailed in tus thus appears to be a relevant trigger for aggressive behaviour
being repeatedly defeated should facilitate rather than suppress in both direct and virtual interactions.
aggression in low-status contestants (Przybylski et al., 2014; Our main finding that participants chose higher punish-
Yu et al., 2014; Oxford et al., 2017). In a correlational analysis ments when placed in a low rank is however not entirely
and two laboratory experiments, we found that low competi- expectable. After all, participants might have instead displayed
tive status, measured as competitors’ relative rank in a hier- the opposite pattern, i.e. punishing a weaker rival to assert their
archy, was linked with more frequent and intense aggressive dominance while being less aggressive against a stronger oppo-
behaviour. Our results replicate and extend previous investiga- nent as a conciliatory strategy. Indeed, some studies have shown
tions showing that fouls or penalties are associated with worse that participants accept more unfair offers in experimentally
overall team performance in American football (Hauge, 2012), induced low status (Blue et al., 2016; Hu et al., 2016). Never-
ice hockey (Coates et al., 2012), soccer (Jewell, 2012) and basket- theless, in these investigations behaving submissively yielded
ball (Berri and Rodenberg, 2012). Unlike these studies, however, a direct economic benefit. What could explain the results of
our measure of aggression (fouls or penalties committed rela- the present study, in which there was no money at stake?
tive to received) captures the reciprocal nature of aggressive play One possibility is that subjects were more willing to incur
and thus provides clearer evidence on the status–aggression the risk of behaving aggressively when their status was low,
relationship. as the prospect of losing increases risk-seeking (Tversky and
The findings from our two experimental studies further show Kahneman, 1981; Ruggeri et al., 2020). Conversely, being in
that the link between low status and aggression holds in com- a high-status position induces risk aversion so that subjects
petitions between individuals (i.e. not only between teams) and might avoid punishing lower-status individuals due to e.g. rep-
when aggressive behaviour does not directly offer a clear com- utational concerns (Dreber et al., 2008). Put otherwise, sub-
petitive advantage. In addition, in our neuroimaging experiment jects had less to lose in a low-status position, which facili-
subjects became quicker and selected louder sound blasts over tates risk-taking. In addition, inducing a low-status mindset
time against in a low-status position, even when the opponents’ threatens self-worth and increases hostility (Davis and Reyna,
hostile intent remained constant over time. This finding further 2015), which might have further exacerbated status-dependent
demonstrates that aggression increases as competitive hierar- aggression in the present study. Future studies should dis-
chies emerge and is not a mere correlate of low performance. ambiguate these putative mechanisms underlying status-based
Our results also imply that the relationship between competi- aggression.
tive status and aggression is not limited to situations involving
face-to-face competition but also applies to virtual, indirect con- Changes in testosterone and cortisol concentrations
tests. In line with this assumption, an online bargaining study We also observed a post-task increase in testosterone concentra-
showed that individuals attribute more hostile intentions to tions. This surge occurred instead of the decline that could beM. Buades-Rotger et al. | 11
expected due to the hormone’s circadian rhythm (Keevil et al., and Dong, 2010), encodes status relationships and can thereby
2013; Buades-Rotger et al., 2016b). In men, testosterone tends inform social decision-making.
to rise after winning (Geniole et al., 2017) and when achieving The left ventral and dorsal striatum also displayed multivari-
a higher status in skill-based hierarchies (Cheng et al., 2018). ate signals distinguishing the high- and low-status rivals. Fur-
Although subjects in the present study only won half of the thermore, participants with a stronger differentiation between
trials on average, they did clearly defeat one opponent and opponents in the striatum showed more status-dependent
overestimated the percentage of trials won against both rivals. aggression. Paralleling our findings, striatum neurons in the rhe-
Indeed, elevations in testosterone levels have been linked to sus macaque brain respond differentially to social cues from
more positive self-appraisals of competitive performance (Casto dominant and submissive monkeys, which concur with a pref-
et al., 2017). However, our data do not allow us to determine erence to watch faces from higher status individuals (Klein and
Downloaded from https://academic.oup.com/scan/advance-article/doi/10.1093/scan/nsab061/6271067 by guest on 19 May 2021
whether the changes we observed here were purely driven by Platt, 2013). The present results thus indicate that the striatum
competition itself, the resulting outcomes or other factors. Cor- is not only sensitive to status signals (Zink et al., 2008; Zerubavel
tisol concentrations, on the other hand, showed a steep decline et al., 2015) and competitive outcomes (Qu et al., 2017) but
after the task. This effect, which we have previously observed also differentiates between individuals differing in status during
(Buades-Rotger et al., 2016b), is likely due to anticipatory arousal, decisions to aggress. Our findings are in line with the hypoth-
circadian decline and/or relaxation in the scanner; the lat- esized role of the striatum in retaliatory aggression (Chester,
ter might have been heightened by the post-task resting-state 2017; Bertsch et al., 2020) and concur with meta-analytic find-
measurement. Nonetheless, contrary to prior studies (Carré ings demonstrating increased striatal activity when individuals
and Olmstead, 2015), neither endogenous testosterone nor cor- deliver harsher punishments to unfair co-players (Gabay et al.,
tisol was linked with status-dependent aggressive behaviour. 2014). Therefore, our data bridge animal and human research
Our results are also in partial disagreement with the finding in showing that the hippocampus and striatum are involved
that competition-related surges in testosterone facilitate further in the relational processing of social dominance signals. The
antagonistic behaviour (Mehta and Josephs, 2006; Carré et al., present findings additionally suggest that these mechanisms are
2013), although in the present study aggression was measured at play during competitive interactions and might contribute to
during competition rather than after it. Many experimental the adoption of aggressive strategies.
studies on the topic subject participants to rigged competitions
in which they are clear winners or losers (Geniole et al., 2017).
Trial-wise covariation between brain activity and
In contrast, the task employed here entailed a sequence of wins
and losses, which might have had mutually cancelling effects
status-dependent aggression
on testosterone dynamics and subsequent aggressive impulses. The vmPFC evinced a status-dependent covariation with par-
Furthermore, testosterone increases are stronger when mea- ticipants’ momentary changes in aggressive behaviour. Put
sured more than 10 min before competition (Geniole et al., 2017). another way, this region integrated status information in deci-
Our design might have hence missed out on the preparatory sions to aggress on a trial-by-trial level. A number of volumetric
testosterone rush posited to foster competitive aggression in and functional studies indicate that the vmPFC is crucial for
men (Zilioli and Bird, 2017; Geniole and Carré, 2018). Recent the control of aggressive impulses (Beyer et al., 2015; Gilam
meta-analytic evidence suggests that the association between et al., 2015; Chester et al., 2017), presumably by downregulat-
testosterone and aggression in humans is small (Geniole et al., ing amygdala activity (Coccaro et al., 2011; Motzkin et al., 2015).
2020). Testosterone-by-cortisol interactions yield even lower There are however contradictory findings showing that vmPFC
effect sizes across studies, with highly variable estimates and damage is linked with increased cooperative behaviour (Wills
some evidence for publication bias (Dekkers et al., 2019). Large, et al., 2018) or that vmPFC activation positively predicts aggres-
pre-registered investigations (Brannon et al., 2019) are neces- sive decisions (Buades-Rotger et al., 2017; Repple et al., 2017).
sary to reach conclusive evidence on the role of testosterone in Here, the status-contingent, aggression-related elevations in
status-based aggression. vmPFC activity went along with those of other regions putatively
involved in emotion regulation and social decision-making such
as the dorsolateral or ventrolateral prefrontal cortex (Morawetz
Neural representations of competitive status during
et al., 2015; Hackel et al., 2020). In contrast, there were no
punishment selection
positive associations between brain structures assumed to gen-
At the neural level, we identified a number of brain regions erate aggressive urges (e.g. amygdala and periaqueductal grey)
implicated in the processing of competitive hierarchies and (Coccaro et al., 2011; Yu et al., 2014) and punishment selections
characterized their relevance for status-dependent aggressive in the task. Therefore, we speculate that the observed prefrontal
behaviour. MVPA revealed that the right anterior hippocampus and parietal activity might correspond to deliberate, intentional
distinguished between the better and worse rivals during pun- aggressive decisions. This assumption is supported by the find-
ishment selection. A growing number of studies indicate that ing that lost trials led to subsequently faster decisions but
the role of the human anterior hippocampus is not limited to did not influence punishment selections, which were strongly
mapping events in time or items in space. Rather, this structure driven by competitive status. The relatively long and invari-
has been suggested to encode abstract relationships between ant response times during punishment selection (i.e. around
entities along several dimensions extracted from statistical reg- 1300 ms throughout the task) are also in consonance with this
ularities in the environment, i.e. relational knowledge (Garvert interpretation. Indeed, there is evidence that willingness to
et al., 2017; Park et al., 2020). Similar mechanisms have been doc- influence the rival’s performance accounts for some variation
umented in the social domain so that the anterior hippocampus in average punishment selections in this task (Chester and
tracks changes in an individual’s power and affiliation rela- Lasko, 2019). Nonetheless, as we did not measure participants’
tive to oneself (Tavares et al., 2015; Kumaran et al., 2016). Our motives, we cannot determine to which extent the intent behind
results therefore provide converging evidence that this region, louder sound blasts was mostly hostile or instrumental in
analogous to the ventral hippocampus in rodents (Fanselow nature.You can also read