Machine learning and automatic selection of attributes for the identification of Chagas disease from clinical and sociodemographic data
←
→
Page content transcription
If your browser does not render page correctly, please read the page content below
Research, Society and Development, v. 10, n. 4, e19310413879, 2021
             (CC BY 4.0) | ISSN 2525-3409 | DOI: http://dx.doi.org/10.33448/rsd-v10i4.13879

Machine learning and automatic selection of attributes for the identification of
Chagas disease from clinical and sociodemographic data
Aprendizado de máquina e seleção automática de atributos para identificação da doença de Chagas
a partir de dados clínicos e sociodemográficos
Aprendizaje y selección automáticos de atributos para la identificación de la enfermedad de Chagas
a partir de datos clínicos y sociodemográficos

                                                  R Received: 03/13/2021 | Reviewed: 03/22/2021 | Accept: 03/28/2021 | Published: 04/06/2021

                                                                                                             Weber de Santana Teles
                                                                                              ORCID: https://orcid.org/0000-0003-1770-8278
                                                                                                             Universidade Tiradentes, Brasil
                                                                                                             E-mail: arteecura@hotmail.com
                                                                                                        Aydano Pamponet Machado
                                                                                             ORCID: https://orcid.org/0000-0003-1188-131X
                                                                                                   Universidade Federal de Alagoas, Brazil
                                                                                                        E-mail: aydano.machado@ic.ufal.br
                                                                                               Paulo Celso Curvelo Cantos Júnior
                                                                                             ORCID: https://orcid.org/0000-0001-5834-6782
                                                                             Instituto de Hematologia e Hemoterapia de Sergipe-IHHS, Brazil
                                                                                                        E-mail: paulo.Curvelo.jr@gmail.com
                                                                                                             Cláudia Moura de Melo
                                                                                             ORCID: https://orcid.org/0000-0001-9331-003X
                                                                                                             Universidade Tiradentes, Brazil
                                                                                                             E-mail:claudia_moura@unit.br
                                                                                                         Maria Hozana Santos Silva
                                                                                              ORCID: https://orcid.org/0000-0001-5742-5366
                                                                                                                      Faculdade Ages, Brazil
                                                                                                             E-mail: hosana_p@hotmail.com
                                                                                                           Rute Nascimento da Silva
                                                                                              ORCID: https://orcid.org/0000-0002-2719-1623
                                                                                                             Universidade Tiradentes, Brazil
                                                                                                            E-mail: silva_rute@hotmail.com
                                                                                              Veronica de Lourdes Sierpe Jeraldo
                                                                                              ORCID: https://orcid.org/0000-0001-9813-7969
                                                                                                             Universidade Tiradentes, Brazil
                                                                                                      E-mail:veronica_sierpe@hotmail.com

       Abstract
       Objective: evaluate the potential use of machine learning and the automatic selection of attributes in discrimination of
       individuals with and without Chagas disease based on clinical and sociodemographic data. Method: After the
       evaluation of many learning algorithms, they have been chosen and the comparison between neural network
       Multilayer Perceptron (MLP) and the Linear Regression (LR) was done, seeking which one presents the best
       performance for prediction of the Chagas disease diagnosis, being used the criteria of sensitivity, specificity, accuracy
       and area under the ROC curve (AUC). Generated models were also compared, using the methods of automatic
       selection of attributes: Forward Selection, Backward Elimination and genetic algorithm. Results: The best results were
       achieved using the genetic algorithm and the MLP presented accuracy of 95.95%, 78.30% sensitivity, and specificity
       of 75.00% and AUC of 0.861. Conclusion: It was proved to be a very interesting performance, given the nature of the
       data used for sorting and use in public health, glimpsing its relevance in the medical field, enabling an approximation
       of prevalence that justifies the actions of active search of individuals Chagas disease patients for treatment and
       prevention.
       Keywords: Machine learning; Neural network; Chagas disease.

       Resumo
       Objetivo: avaliar o potencial de uso do aprendizado de máquina e da seleção automática de atributos na discriminação
       de indivíduos com e sem doença de Chagas a partir de dados clínicos e sociodemográficos. Método: Após a avaliação
       de diversos algoritmos de aprendizagem, eles foram escolhidos e foi feita a comparação entre a rede neural Multilayer
       Perceptron (MLP) e a Regressão Linear (LR), buscando qual apresentasse o melhor desempenho para predição do
                                                               1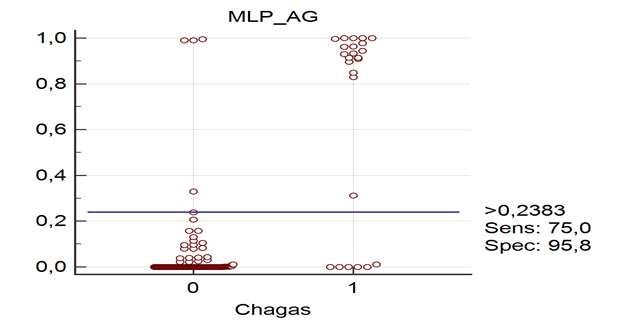
Research, Society and Development, v. 10, n. 4, e19310413879, 2021
                (CC BY 4.0) | ISSN 2525-3409 | DOI: http://dx.doi.org/10.33448/rsd-v10i4.13879

         diagnóstico da doença de Chagas, sendo utilizados os critérios de sensibilidade, especificidade, acurácia e área sob a
         curva ROC (AUC). Os modelos gerados também foram comparados, utilizando os métodos de seleção automática de
         atributos: Forward Selection, Backward Elimination e algoritmo genético. Resultados: Os melhores resultados foram
         obtidos com o algoritmo genético e o MLP apresentou acurácia de 95,95%, sensibilidade de 78,30%, especificidade
         de 75,00% e AUC de 0,861. Conclusão: Mostrou-se um desempenho bastante interessante, dada a natureza dos dados
         utilizados para triagem e utilização em saúde coletiva, vislumbrando sua relevância na área médica, possibilitando
         uma aproximação de prevalências que justifiquem as ações de busca ativa de indivíduos Chagas pacientes com
         doenças para tratamento e prevenção.
         Palavras-chave: Aprendizado de máquina; Rede neural; Doença de Chagas.

         Resumen
         Objetivo: comparar el potencial del uso del aprendizaje automático y la selección automática de atributos en la
         discriminación de individuos chagásicos y no chagásicos en base a datos clínicos y sociodemográficos. Metodología:
         después de la evaluación de varios algoritmos de aprendizaje, se eligió y realizó la comparación entre el Perceptrón
         Neural Multicapa (MLP) y la Regresión Lineal (LR), buscando cuál presenta el mejor desempeño para predecir el
         diagnóstico de la enfermedad de Chagas, los criterios de sensibilidad, especificidad, precisión y área se utilizaron bajo
         la curva de características operativas del receptor (curva ROC). También se compararon los modelos generados
         mediante métodos automáticos de selección de atributos: Selección hacia adelante, Eliminación hacia atrás y
         Algoritmo genético. Resultados: los resultados con mayor grado de confiabilidad se obtuvieron mediante el uso del
         Algoritmo Genético con el MLP, el cual presentó precisión del 95,95%, sensibilidad del 78,30%, especificidad del
         75,00% y Precisión (AUC) de 0,861. Conclusión: Lo que resultó ser un desempeño relevante dada la naturaleza de los
         datos utilizados para la clasificación y uso en salud pública, vislumbrando su relevancia en el campo médico,
         permitiendo una aproximación de la prevalencia que justifica acciones de búsqueda activa de individuos chagásicos
         para su tratamiento y prevención.
         Palabras clave: Aprendizaje automático; Red neuronal; La enfermedad de Chagas.

1. Introduction
         Chagas disease (CD), also known as American Trypanosomiasis is a disease whose etiologic Agent is the Protozoan
Trypanosoma cruzi. It is currently considered one of the greatest public health problems in the Americas, is estimated that
there are about 8 million disabled people in CD and on average 10,000 deaths per year (WHO, 2020).
         Trypanosomiasis is presented in two distinct phases, an acute phase and then a chronic phase, and both phases may
remain asymptomatic in some individuals. The acute phase lasts 6-8 weeks, and when symptomatic it can be characterized by
fever, tachycardia, splenomegaly and edema. The chronic phase may be asymptomatic in most individuals, however, some of
these may show signs and symptoms 20, 30 or more years after infection and which are characterized by impaired cardiac and
digestive function (Gunter et al., 2017).
         On the other hand, computational innovation works on new techniques in order to drive improvements in various
human activities (Martínez-Torres, 2013). For example, in the area of medical informatics, new technologies provide health
professionals with computational information that facilitates the assistance of patients in care. Thus, it is possible to issue
specialized opinions, based on information, records, electronic records, medical images, being medically understandable
without the need for unnecessary, risky, uncomfortable or expensive procedures, and assisting other health professionals with
the gain of information, facilitating understanding and assisting diagnosis (Forshyth et al., 2019).
         Thus, the machine learning is an area of artificial intelligence (AI) that has as its object the automatic construction of
computational models for recognizing complex patterns between variables, describing or enabling decisions based on
registered experience (Mitchell, 1997). The use of this tool has multiple benefits, consisting in collecting data that will be
processed into information and, from it, for example, obtain knowledge of epidemics and its relationship with the environment,
as well as diagnostic aid (Traore et al., 2016).
         The use of AI tools has contributed to the diagnosis of CD in the 21st century, especially in the evaluation of the
damage caused to the cardiovascular system, such as the analysis of heart rate variability (Moncayo Á, Silveira AC et al.,

                                                                2
Research, Society and Development, v. 10, n. 4, e19310413879, 2021
(CC BY 4.0) | ISSN 2525-3409 | DOI: http://dx.doi.org/10.33448/rsd-v10i4.13879
2017) and topological maps and Kohonen in order to differentiate individuals with CD with heart disease, from indeterminate
(asymptomatic) individuals with CD and normal individuals (Neto et al., 2013).
In the field of machine learning, there are several classification algorithms, based on the different methods used to
induce knowledge, highlighting: neural networks, support vector machines, decision trees, bayesian networks, nearest k-
neighbors, linear regression, among others (Spatti et al., 2019).
The objective of this work was to evaluate the potential of using machine learning and automatic selection of
attributes in the discrimination of chagasic and non-chagasic individuals based on clinical and sociodemographic data.
2. Methodology
A field study of transverse type for the construction of the database and the computer models were conducted,
involving the population in the rural area of the town of Itabaianinha /IF (villages of Fundão and Piabas) located in the
Northeast region of Brazil. The town has a dry and sub humid climate, with an average annual temperature of 24.2° C, annual
average precipitation of 976.9 mm and a rainy season that occurs between March and August. The countryside is divided into
72 villages which includes 38.0% of the population. Its economy is based on citrus crops, creation of large and small animals
and production of ceramics. For the construction of the database, sociodemographic characteristics data were taken, symptoms,
clinical and swallowing in residents of the region as well.
The project was approved by the Ethics Committee Research with Human Beings at the Tiradentes University, in
Aracaju/SE with case number 190610R. The collected data were used exclusively for the purposes provided in the protocol.
Were included people over 18 years old who agreed with the “Term of Free and Clear Clarification” (TCLE) – who lived in
the study area and were available at the time of data collection. Were excluded all individuals with any clinical or physical
incapacity.
With the aid of Community Health Agents (CHA), all residents of the study area were invited to participate in the
research, but just 143 individuals over 18 years took part. Previously were carried out home visits communicating and guiding
the public about the date and the locations in which would be carried out the search procedures. All participants were initially
oriented by reading the TCLE and were clearly informed about the goals and procedures to be performed during the research.
For individuals who signed, were applied the same forms used by the CD control program (CDCP) that contains information
on gender, age, level of education, kind of housing, therapeutic treatment, handling or contact with triatominae, earlier
diagnosis of patient with CD and history related to cardiovascular and digestive systems (Silva et al., 2003).
After data collection, each one of the participants were submitted to specific clinical evaluation of swallowing, which
is performed in two steps: an indirect assessment and a direct one (Levy et al., 2003; Silva, 2004). The protocol used was based
on protocols described in the literature.
The evaluation consisted in 5 ml blood collected by venipuncture peripheral and a drop of blood on filter paper. The
diagnostic methods used for determination of the CD were ELISA and indirect immunofluorescence (IFI). Serological analysis
by ELISA were performed in the laboratory of the Serology blood bank coordinator in Aracaju/SE-HEMOSE and repeated in
LACEN. Diagnostic techniques for IFIS were performed in the laboratory of CD at Paulista State University Julio de Mesquita
Filho, in Araraquara, SP, Brazil.
The Algorithms have been tested and listed below, with their respective configuration settings in search of the best
configuration: linear regression, logistic regression (using normal standards of RapidMiner), decision tree C 4.5 (with
variations in the Criterion), support vector machines (SVM) (with variation in the kernel type), radial basis function networks
(RBF) (varying the number of clusters between 2 to 16) and neural network multilayer perceptron (MLP). The measures of
3Research, Society and Development, v. 10, n. 4, e19310413879, 2021
(CC BY 4.0) | ISSN 2525-3409 | DOI: http://dx.doi.org/10.33448/rsd-v10i4.13879
performance were linked or not to genetic algorithms, forward selection and backward elimination in a database on the rural
area from Itabaianinha town, recognized as CD transmission area. Considering the features and the complexity of the models
evaluated, as well as the performance achieved, linear regression and neural network multi-layer perceptron (MLP) were
selected for the experiments because they were the only ones in which the results were indicative, since other measures not
converged the results, the linear regression is considered a linear function for model representation and the MLP a universal
opener function that can deal with a problem that is not linearly separable (Cybenko, 1989; Hornik et al., 1989).
All models were constructed and evaluated using the k-fold cross-validation technique with a total of 10 subsets
(Kohavi, 1995). Automatic attribute selection algorithms were also used for each model built, namely: forward selection,
backward elimination and genetic algorithms (Guyon & Elisseeff, 2003). The number of neurons was variable, and an
automatic configuration was used in the present study, which creates the best configuration for the number of intermediate
layers.
The All models were built and evaluated using the k-fold cross-validation with a total of 10 subsets (Kohavi, 1995).
Were also used algorithms of automatic selection of attributes for each model: forward selection, backward elimination and
genetic algorithms (Guyon & Elisseeff, 2003). The number of neurons was variable, and being used in the present study an
automatic configuration, which devises the best setting for the amount of intermediate layers.
Type MLP neural network displays one or more intermediate layers of neuronics, besides being described, are also
used non-linear activation functions as a sigmoid function, i.e., each neuron performs a specific function, influencing or
combining the functions with other neurons connected (Faceli et al., 2015).
The predictive statistical method of multiple linear regression was used for prediction of output variables, when
combined linearly with the input variables are generally estimated minimum errors, which are solved or formulated by
quadratic or linear programming. In addition, searches indicate the influence of one variable on another one, which
characterizes it as a factor on the output (Yang et al., 2016). In addition, being a popular performance measure for dichotomous
and presents a potential classification of auxiliary tool for prediction of clinical diagnosis (Upadhyaya et al., 2013).
The predictive models were created and validated with Rapidminer software Studio 7.3, having their settings
optimized for the best performance with the MLP with a learning rate of 0.05 and 1000 training cycles and optimization with
genetic algorithms with a population of 20. The other parameters remained with their default value. The figures and the test of
statistical significance of the DeLong difference between the areas under the curve (AUC) were made using the MedCalc
17.9.7 tool. For the visualization of data, the array of confusion and ROC curves were used, besides points diagram.
3. Results
Took part in this research 143 individuals older than 18 years from both sexes that correspond to the families of
children studied in previous research and resulting in seronegative to CD (Talbot et al., 2014). The serological diagnosis for
CD detection through ELISA showed reactivity indices of order 16.7% (n = 24). It was observed that seropositive individuals
were aged 38 to 68 years. Among the subjects surveyed, 75.5% (n = 108) was female, with no statistical significance to gender
among individuals with positive serology (Table 1).
4Research, Society and Development, v. 10, n. 4, e19310413879, 2021
(CC BY 4.0) | ISSN 2525-3409 | DOI: http://dx.doi.org/10.33448/rsd-v10i4.13879
Table 1. Distribution by Distribution by sex and age from 143 individuals subjected to serological assessment to CD, from
rural area of Itabaianinha town /SE, 2016.
Age group n (%) Serology n (%)
Gender 15 – 33 34 – 51 52 – 69 70 – 89 Total
Positive Negative
Feminine 49 (45,4) 32 (29,6) 21 (19,4) 6 (5,6) 19 (17,6) 89 (82,4) 108
Masculine 17 (48,6) 11(31,4) 7 (20) 0 (0) 5 (14,3) 30 (85,7) 35
Total 66 (46,2) 43 (30,1) 28 (19,5) 6 (4,2) 24 (16,8) 119 (83,2) 143
Source: Authors.
With regard to the presence of the insect, both groups showed the highest rate of attendance of the specimen, 91.7%
were Chagas disease patients and 51.2% were not. About the symptomatology, 50% (12) of the CD individuals were not
showing symptoms and 94.1% (112) of individuals non-Chagas disease patients were asymptomatic. Concerning access to
health care, only 4.2% (1) of the individuals with CD and 10.1% (12) of non CD patients had no access. In relation to changes
in swallowing, 33.3% (8) of the CD individuals had such change, not observed in individuals that were not suffering from
Chagas, since none of these introduced amendments (table 2).
Table 2. Social and clinical conditions of individuals tested for Chagas diseases serology in Itabaianinha/SE.
Social and clinical conditions Absolutes Chagasic Non chagasic
n (%) n (%)
Present 22 (91,7) 61 (51,2)
Triatomine
Absent 2 (8,3) 58 (48,7)
Well water 23 (95,8) 89 (74,8)
Type of water
Piped water 1 (4,2) 30 (25,2)
Yes 1 (4,2) 12 (10,1)
Access to health
No 23 (95,8) 107 (89,9)
Yes 12 (50) 112 (94,1)
Asymptomatic
No 12 (50) 7 (5,9)
Yes 8 (33,3) 0 (0)
Swallowing alteration
No 16 (66,6) 119 (100)
Yes - -
Romanan Sign
No 24 (100) 119 (100)
Source: Authors.
To carry out the analyses of each algorithm of machine learning socio-demographic, variables were used, clinics and
the direct and indirect swallowing test. The MLP algorithm got the best performance prediction on discrimination between
individuals and non-Chagas disease patients, reaching a sensitivity of 78.33%, a specificity of 75.0%, and an accuracy of
95.95% ± 5.36%, (Table 3).
Table 3. Performance of machine learning algorithms to predict CD patients and non-Chagas disease patients.
MLP LINEAR REGRESSION
Sensibility (%) 78,3 56,7
Specificity (%) 75,0 45,8
Accuracy (%) 96,0 ± 5,4 93,00 ± 5,4
*MLP = multilayer perceptron. Source: Authors.
The MLP using genetic algorithm as a function presented the greater specificity, reaching 95.8%, while the Linear
Regression through the genetic algorithm, presented a specificity of 91.6%. Among all tests used, the MLP using genetic
algorithm had the best performance in distinguishing individuals with and without Chagas. (Table 4).
5Research, Society and Development, v. 10, n. 4, e19310413879, 2021
(CC BY 4.0) | ISSN 2525-3409 | DOI: http://dx.doi.org/10.33448/rsd-v10i4.13879
Table 4. Performance of machine learning algorithms to predict CD patients and non-Chagas ones, associating attributes
selection tactics.
MLP LINEAR REGRESSION
Forward selection
Sensibility (%) 55 53,3
Specificity (%) 50 50
Accuracy (%) 91,8+ 91,1+/-7,4
/-7,2
Backward elimination
Sensibility (%) 73,3 56,7
Specificity (%) 70,8 54,2
Accuracy (%) 95,2+ 92,43 +/- 5,6
/-5,3
Genetic Algorithm
Sensibility (%) 75 79,2
Specificity (%) 95,8 91,6
Accuracy (%) 96+/- 92,48 +/- 6,3
5,4
* MLP = multilayer perceptron. Source: Authors.
Due to the best performance measures associated with the genetic algorithm, other attributes were discarded.
Moreover, the comparison of performance measures, MLP and Linear regression through the area under the ROC curve
(Receiver Operating Characteristic) (AUC), with and without using the genetic algorithm, which showed no statistical
significance (p > 0.05) of the difference between the AUC and indicating the similarity between the MLP and Linear
regression when both were linked to genetic algorithm (Figure 1).
Figure 1. Performance measures compared by ROC curve, being examined with and without using the genetic algorithm.
Source: Authors.
In addition, the data for both curves linked to the genetic algorithms attribute were shown, showing an AUC value for
the MLP of 0.861, while the LUC AUC was 0.893 showing that there is no significant difference between both curves (p =
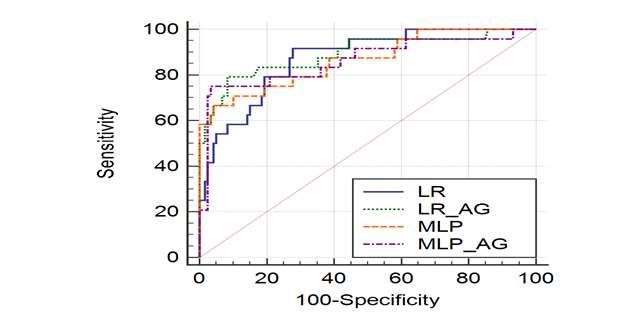
0.5830) (Table 5). However, although the models do not show a statistically significant difference in AUC, when analyzing the
boxplot diagram of the two models, MLP is able to better separate the classified instances (Figure 2) than the Linear
Regression (Figure 3).
6Research, Society and Development, v. 10, n. 4, e19310413879, 2021
(CC BY 4.0) | ISSN 2525-3409 | DOI: http://dx.doi.org/10.33448/rsd-v10i4.13879
Table 5. Area under the ROC curve and statistical difference between the curves.
Variable AUC Standard Errora 95% Cl b
LR_AG 0,893 0,0364 0,830 to 0,938
MLP_AG 0,861 0,0511 0,793 to 0,913
Area difference between Significance p.
curves
LR_AG X MLP_AG 0,0317 0,5830
a DeLong et al. (1988). b Binomial exact. Source: Authors.
Figure 2. Boxplot diagram of the MLP model with AG.
Source: Authors.
Figure 3. Boxplot diagram of the Linear Regression model with AG.
Source: Authors.
4. Discussion
The use of AI has allowed significant advances in several areas of knowledge, allowing the understanding of
epidemiological data through hypothesis tests, data collection, information processing, managing to establish patterns in the
dynamics of diseases, influencing, in a way, the detection of these (Esfandiari et al., 2014). Studies using computational
methods have been carried out as a complementary aid methodology for the more accurate diagnosis and classification of
7Research, Society and Development, v. 10, n. 4, e19310413879, 2021
(CC BY 4.0) | ISSN 2525-3409 | DOI: http://dx.doi.org/10.33448/rsd-v10i4.13879
patients affected by CD, with the aim of assessing damage to the cardiovascular system, such as the analysis of heart rate
variability (Moncayo Á, Silveira AC et al., 2017). However, according to our knowledge, no work has yet been carried out
similar to the one presented here, that is, building computational models based on machine learning and automatic selection of
attributes to identify CD from clinical and sociodemographic data.
Neto et al. (2013) developed topological maps of Kohonen to compare the ability of indicators extracted from the
electrocardiogram signals inserted in neural networks, with the aim of discriminating CD patients with heart disease,
indeterminate CD patients and normal individuals. Thus, the search for techniques that help in solving problems related to CD
or other diseases, quickly and efficiently, it is essential for the enhancement and monitoring strategies and health promotion
actions that will contribute more effectively in understanding of epidemiological variables involved in these diseases.
The results from the models used in this study were found by cross-validation, which, in a study of Ishibuchi &
Nojima (2013), was used for evaluation and accuracy of the tests. Thus, validation indicated the values of accuracy, sensitivity
and specificity of the MLP and the LR, showing the best results on the efficiency of the MLP (sensitivity: 75%; specificity:
95.8%; accuracy: 96%).
A research conducted by Kurt et al. (2008), about prediction of coronary artery disease, showed a comparison
between MLP, LR and other techniques, highlighting that the MLP has shown the best results for the purpose of the study
compared the others.
It was observed that the research carried out by Kurt et al. (2008) presented similar results to the present study, which
presented the 78.33% values for sensitivity, 75% for specificity and 95.95% +/-5.36 for accuracy, showing the best results of
the MLP. However, studies of Shoostari & Gholamalifard (2015), presented better performance of the LR when compared with
the MLP.
Moreover, the introduction of the genetic algorithm to perform the automatic selection of the attributes, improved the
result of the models in the performance measures used, increasing their levels of accuracy, specificity, sensitivity and the AUC,
as shown in the tables and figures. In the study of Tao et al. (2017), it is also relevant to the introduction of genetic algorithms,
outperforming the other techniques used in the study, when compared.
The ROC curve is used in biomedical applications, having as purpose to summarize the accuracy of one or more
classifiers discriminatory about the diagnosis, in addition to the functionality of comparing these models based on
simultaneous analysis of sensitivity and the specificity, building on the model performance instances sorted (Tang & Chi,
2005). Because of this, the ROC curve was used for the comparison between the MLP and the Linear regression models, being
also observed in the study of Shoostari & Gholamalifard (2015), which tried to predict the change of land cover and the
quantification of landscape change present in the landscape Neka River basin, in northern Iran. In this manner, ROC curve
assesses the correlation between variables and transitions in performance measures (Shoostari & Gholamalifard, 2015). In the
present study, the curve revealed, with the method of Delong, that there is no statistically significant difference between the
areas under the ROC curve (AUC) of models, despite the MLP model have presented a larger area in relation to the model with
LR. However, when looking at the bloxspot diagrams of the models, the MLP can better separate instances sorted, showing a
better performance and ease to the cutting point, due to lower the overlapping region between Chagas disease patients and non-
Chagas ones.
5. Conclusion
It has been used predictive methods more frequently in order to get transmission dynamics and patterns of disease
symptoms, and this was the objective that the present work presents a unique and unprecedented study that sought to assess a
8Research, Society and Development, v. 10, n. 4, e19310413879, 2021
(CC BY 4.0) | ISSN 2525-3409 | DOI: http://dx.doi.org/10.33448/rsd-v10i4.13879
variety of algorithms machine learning and automatic selection of attributes for CD. After such comparison were selected and
evaluated more detailed the MLP algorithms and Linear Regression with Forward Selection methods, Backward Elimination
and genetic algorithm to better achieve the aim of this study.
The performance of the models was evaluated using the technique of cross-validation and presented using classical
measures of accuracy, sensitivity, specificity and area under ROC generating curve, where the algorithm with MLP AG
showed better performance despite statistically to be close to the LR with AG, but having their behavioral differences
demonstrated by boxplots diagrams presented. The performance achieved by the models was considered interesting for the CD
prediction, given the nature of the data collected, not requiring sample of biological fluids and of easy access by health
professionals, not necessarily own doctor who performs the collection of this information. Based on that, it is clear the ease and
utility provided by the generated models, offering a new alternative in the possibility of screening new cases and unknown
cases as well, leading to a faster way to diagnosis and a faster start treatments, as well as influence on new preventive methods.
References
Cybenko, G. (1989). Approximation by superpositions of a sigmoidal function. Mathematics of Control, Signals, and Systems 2(4), 303–314.
Dao, S. D., Abhary, K. & Marian, K. (2017). An Innovative Framework for Designing Genetic Algorithm Structures. Expert Systems with Applications 90,
196-208.
DeLong, E. R., DeLong, D. M. & Clarke-Pearson, D. L. (1988). Comparing the areas under two or more correlated receiver operating characteristic curves: a
nonparametric approach. Biometrics 44, 837–845.
Esfandiari, N., Babavalian, M. R., Moghadam, A. E., Tabar, V. K. (2014). Knowledge discovery in medicine: Current issue and future trend. Expert Systems
with Applications 41, 4434-4463.
Faceli, K., Lorena, A. C., Gama, J. & Carvalho, A. C. P. L. F. (2015). Artificial intelligence: a machine learning approach. LTC, 1st edition. (Inteligência
artificial: uma abordagem de aprendizado de máquina. LTC.
Forsyth, C. J., Granados, P. S., Pacheco, G. J., Betancourt, J. A., & Meymandi, S. K. Current gaps and needs to increase access to health care for people with
Chagas disease in the USA, Curr Trop Med Rep. 2019; 6 (1): 13–22. (Lacunas e necessidades atuais para aumentar o acesso aos cuidados de saúde para
pessoas com doença de Chagas nos EUA. Curr Trop Med Rep. 2019; 6 (1): 13–22).
Hornik, K., Stinchcombe, M. & White, H. (1989). Multilayer Feedforward Networks are Universal Approximators. Neural Networks 2(5), 359-366.
Gunter SM, Murray KO, Gorchakov R, Beddard R, Rossmann SN, Montgomery SP, et al. Probably autochthonous transmission of Trypanosoma cruzi to
humans, south central Texas, USA. Emerg Infect Dis. 2017; 23 (3): 500–3. (Transmissão provavelmente autóctone de Trypanosoma cruzi para humanos,
centro sul do Texas, EUA. Emerg Infect Dis. 23 (3): 500–3).
Guyon, I. & Elisseeff, A. (2003). An introduction to variable and feature selection. Journal of machine learning research 3, 1157–1182.
Ishibuchi, H. & Nojima, Y. (2013). Repeated double cross-validation for choosing a single solution in evolutionary multi-objective fuzzy classifier design.
Knowledge-Based Systems 54, 22-31.
Kohavi, R. (1995). A study of cross-validation and bootstrap for accuracy estimation and model selection. In: Appears in the international joint Conference on
artificial intelligence 14, 1137–1145.
Kurt, I., Ture, M. & Kurum, A. T. (2008). Comparing performances of logistic regression, classification and regression tree, and neural networks for
predicting coronary artery disease. Expert Systems with Applications 34, 366-374.
Levy, D. S., Cristovão, P. W. & Gabbi, S. (2003). Dynamic swallowing study protocol by videofluoroscopy. (Protocolo do estudo dinâmico da deglutição por
videofluoroscopia). In: Jacobi JS, Levy DS, Silva LMC. Dysphagia: evaluation and treatment (Disfagia: avaliação e tratamento). 134-52.
Martínez-Torres, M. R. (2013). Application of evolutionary computation techniques for the identification of innovators in open innovation communities.
Expert Systems with Applications 40, 2503-2510.
Mazza. S. (2011). Consensus on Chagas-Mazza Disease. Argentine Journal of Cardiology 79 (6). (Consenso de Enfermedad de Chagas-Mazza. Revista
Argentina de Cardiología 79(6).
Moncayo Á, Silveira AC. Atual epidemiological trends of Chagas disease in Latin America and future challenges: Epidemiology, surveillance and health
policies. Doença de Chagas gives American trypanosomia: Elsevier; 2017. p. 59–88. (Tendências epidemiológicas atuais da doença de Chagas na América
Latina e desafios futuros: Epidemiologia, vigilância e políticas de saúde. Doença de Chagas da tripanossomíase americana: Elsevier; 2017. p. 59–88).
Mitchell, T. M. (1997). Machine Learning, ed. McGraw Hill.
9Research, Society and Development, v. 10, n. 4, e19310413879, 2021
(CC BY 4.0) | ISSN 2525-3409 | DOI: http://dx.doi.org/10.33448/rsd-v10i4.13879
Neto, J. S., Carvalho, J. L. A., Rocha, A. F., Junior, L. F. J. & Nascimento, F. A. O. (2013). Support system for the diagnosis of Chagas disease based on
scales and self-organizing neural networks. Brazilian Journal of Biomedical Engineering 29 (3), 242-253. (Sistema de apoio ao diagnóstico da Doença de
Chagas baseado em escalogramas e redes neurais auto-organizáveis. Revista Brasileira de Engenharia Biomédica 29(3), 242-253).
Shoostari, S. J. & Gholamalifard, M. (2015). Scenario-based land cover change modeling and its implications for landscape pattern analysis in the Neka
Watershed, Iran. Remote Sensing Applications: Society and Environment 1, 1-19.
Silva, R.G. (2004). Oropharyngeal dysphagia after stroke. (Disfagia orofaríngea pós-acidente vascular encefálico). In: Ferreira LP, Befi-Lopes DM, Limongi
SCO. Speech therapy treaty 2, 354-356. (Tratado de fonoaudiologia 2, 354-356).
Silva, R. A., Rodrigues, V. L. C. C., Junior, W. A. P. & Pauliquevis Junior, C. (2003). Chagas Disease Control Program (PCDCh): Compliance with
triatomine notifications without a fixed term in the Administrative Region of Araçatuba, State of São Paulo, Brazil. Baiana Magazine of Public Health 27 (2):
253-262. (Programa de Controle da Doença de Chagas (PCDCh): Atendimento as notificações triatomínicas sem prazo determinado na Região Administrativa
de Araçatuba, Estado de São Paulo, Brasil. Revista Baiana de Saúde Pública 27(2): 253-262).
Spatti, Danilo Hernane, Ivan Nunes da Silva and Rog´erio Andrade Flauzino. Artificial Neural Networks for Engineering and Applied Sciences. Theoretical
Foundations and Practical Aspects. Artliber, São Paulo, SP, 2nd. edition, 2016. (Redes Neurais Artificiais Para Engenharia e Ciências Aplicadas. Fundamentos
Teóricos e Aspectos Práticos. Artliber, São Paulo, SP, 2nd. edition, 2016).
Tang, T. & Chi, L. (2005). Predicting multilateral trade credit risks: comparisons of Logit and Fuzzy Logic models using ROC curve analysis. Expert Systems
with Applications 28, 547-556.
Teles, W. S., Silva, M. H. S., Santana, K. W. C., Madi, R. R., Jeraldo, V. L. S. & Melo, C. M. (2014). Infantile chagas disease in a rural area in northeastern
Brazil: risk of transmission and social reflections. Interfaces Scientific Magazine – Humans and Socials 3 (1), 9–18. (Doença de chagas infantil em área rural
do nordeste brasileiro: risco de transmissão e reflexões sociais. Revista Interfaces Científicas - Humanas e Sociais 3(1), 9–18).
Traore, B. B., Kamsu-Foguem, B., Tangara, F. (2016). Data mining techniques on satellite images for discovery of risk areas. Expert Systems With
Applications 72, 443-456.
Upadhyaya, S., Farahmand, K. & Baker-Demaray, T. (2013). Comparison of NN and LR classifiers in the context of screening native American elders with
diabetes. Expert Systems with Applications 40, 5830-5838.
World Health Organization – WHO. (2020). Chagas disease (American trypanosomiasis). http://www.who.int/chagas/epidemiology/en/.
Yang, L., Liu, S., Tsoka, S., Papageorgiou, L. G. (2016). Mathematical programming for piecewise linear regression analysis. Expert Systems with
Applications 44, 156-167.
10You can also read