Manawatū District Quarterly Economic Update - September 2020 17 December 2020
←
→
Page content transcription
If your browser does not render page correctly, please read the page content below
Manawatū District Quarterly Economic Update – September 2020
17 December 2020

Key messages
• Economic performance is stronger than expected and the outlook for the local
  economy is positive;
• High earnings growth, relatively strong GDP performance, and increased spending by
  households and businesses reflects the resilience of the local economy;
• Trade and investment conditions have added substantial support to economic
  performance;
• Labour force indicators are positive relative to expectation, but there has been
  impacts;

Key messages
• The housing market continues to drive wealth while causing concern as house
  prices and weekly rents continue to rise;
• Supportive monetary and financial policy is needed to support levels of investment
  in new residential properties (despite the hype). Central and local government
  policy also have an important role to play;
• Rebounding expenditure on vehicles by firms and households reflects confidence
  in the local economy;
• Trade conditions exceed expectation in 2020. Performance in 2021 will depend in‐
  part on the recovery of global economic activity, and;
• Housing our growing population and central government legislation will present
  challenges and opportunities in 2021.

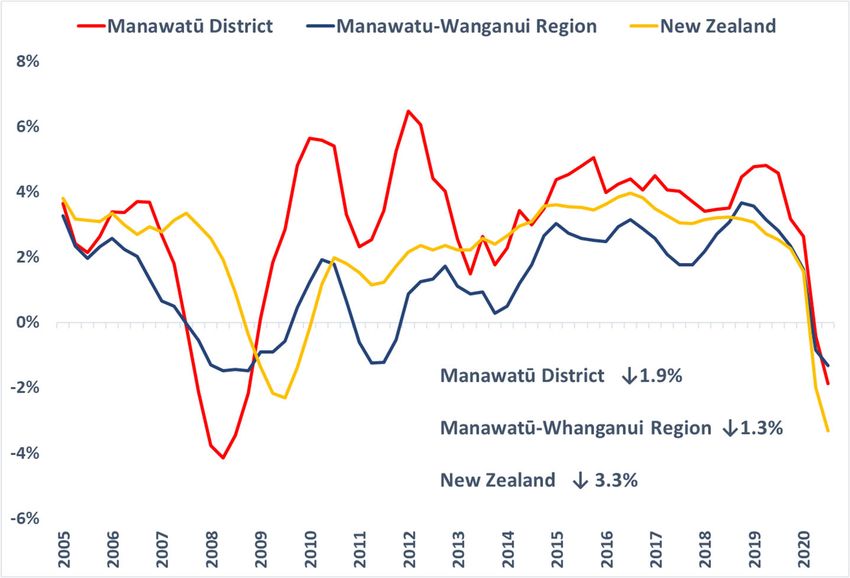
Annual GDP contracts as expected
Worst affected      Annual GDP
                    change
Queenstown‐            ↓ 7.7%
Lakes District
Westland District      ↓ 5.4%

Auckland               ↓ 4.9%
Rotorua District       ↓4.9%
Christchurch City      ↓ 4.2%
Hamilton City          ↓ 3.5%
Waitomo District       ↓ 3.5%
Grey District          ↓ 3.5%
Wellington City        ↓ 3.3%
Kaikoura District      ↓ 3.2%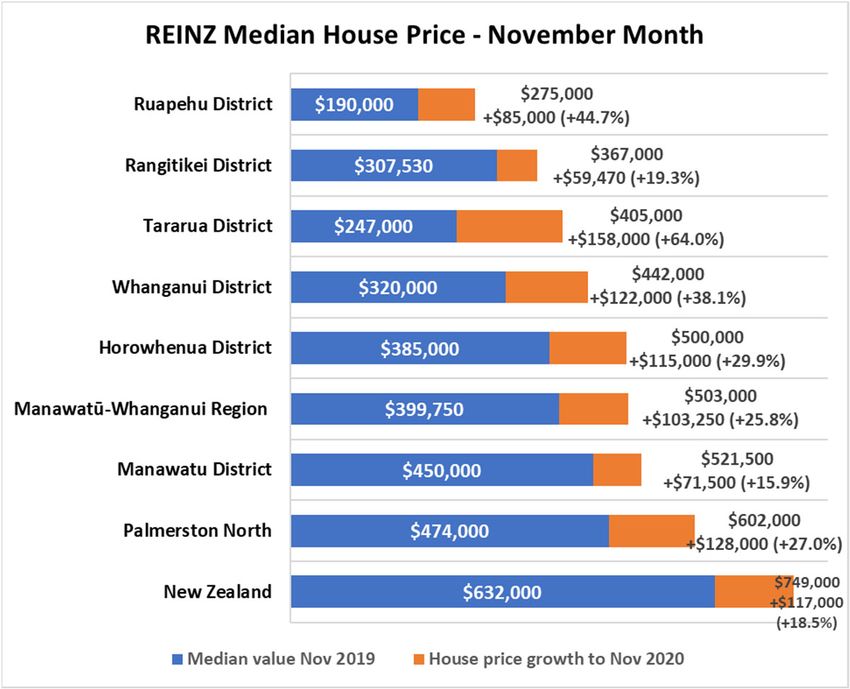
Quarterly GDP bounces back as expected
                                           2020 quarter vs
                                            same quarter
                      Quarterly GDP change the previous
                                %               year

Ruapehu District            +20.5%              +2.9%

Whanganui District          +10.2%             ‐+2.0%

Rangitikei District          +9.4%              ‐1.3%

Manawatū District           +10.1%              ‐2.3%
Palmerston North
City                         +9.1%              ‐1.2%

Tararua District            +10.8%              2.4%

Horowhenua District         +20.2%              1.7%
Manawatū‐
Whanganui Region            +11.3%              ‐0.1%

New Zealand                 +12.3%              ‐3.2%
Queenstown‐Lakes
District                    +35.6%              ‐9.3%

Auckland                     +9.0%              ‐7.1%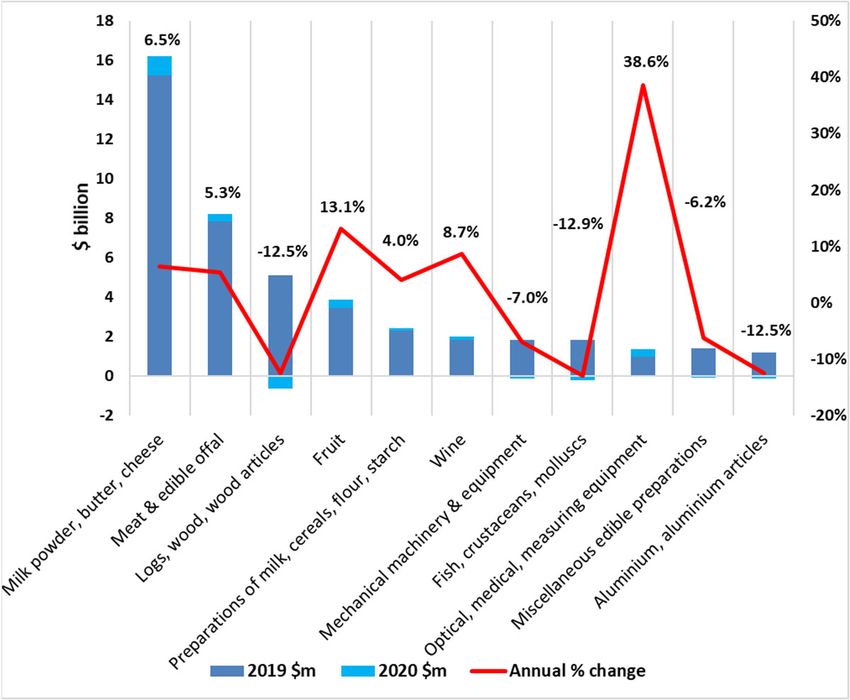
Earnings ↑ 9.4% in Q3 2020 vs Q3 2019
• Council           Change in annual
                    earnings %
 Horowhenua         ↑ 10.7%

 Manawatū           ↑ 9.4%

 Whanganui          ↑ 9.2%

 Tararua            ↑ 8.5%

 Rangitikei         ↑ 8.4%

 Manawatū‐          ↑ 8.0%
 Whanganui Region
 Palmerston North   ↑ 6.1%

 Ruapehu            ↑ 4.9%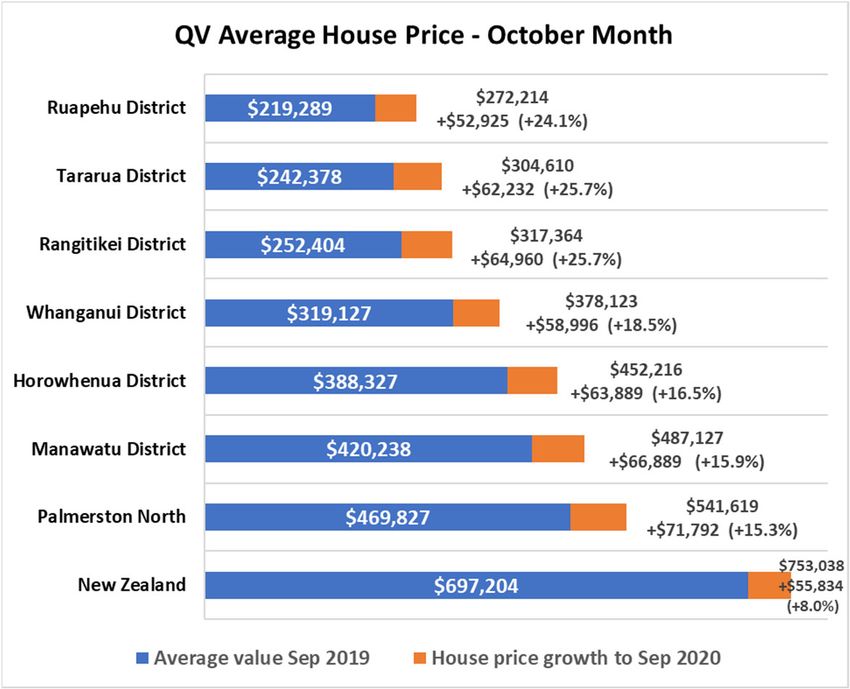
Trade continues to support economic performance
Annual export values continue to grow despite challenges
•   The value of exports to the year ended October
    ↑ 1.2% to a total of $60.1b;

•   The annual value of dairy and red meat exports
    increased by 6.5% and 5.3% respectively. The
    value of fruit exports ↑ 13.1%.

•   Indicating a change in fortunes, the value of
    forestry sector exports ↑ 9.8% over the quarter,
    and ↑ 22.1% for the October month.

•   The value of exports to China and the USA
    increased by 2.7% and 15.2% respectively over
    the year. Exports to Taiwan also posted strong
    growth ↑ 9.8% YOY.

•   The value of exports to Australia ↓ 6.4% over the
    year while exports to India ↓ 28.5%.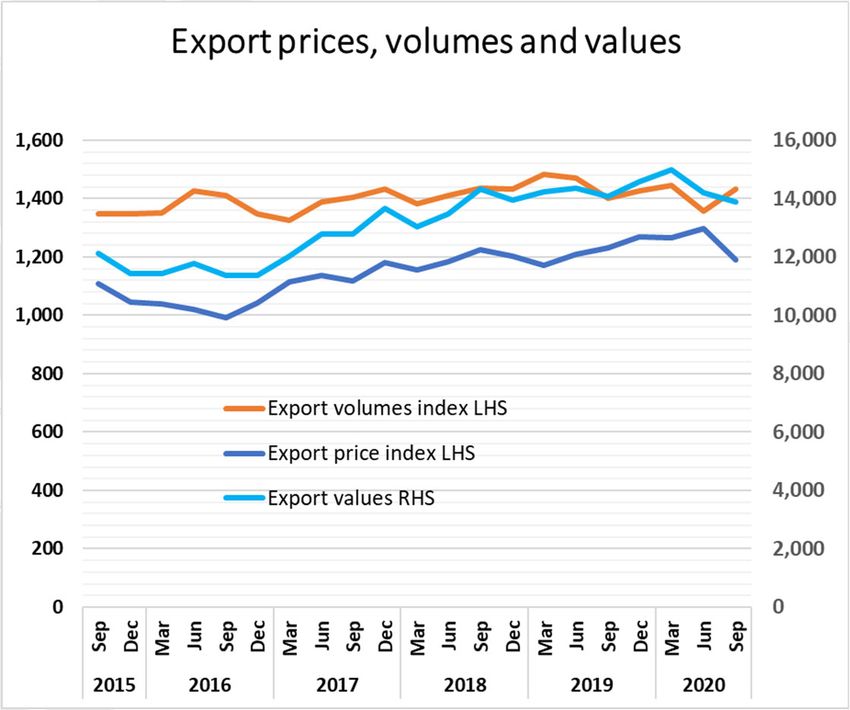
$4b + of investment support the regional economy
         Development                             $ million         Timing
         Manawatū Gorge                            650       start January 2020
         Linton and Ohakea regeneration plan       660           2019 - 2035
         Mercury Energy - Turitea                  450           2019 - 2021
         Massey University capital plan            230           2020 - 2030
         Powerco growth and security projects      245           2017 - 2024
         Hokowhitu campus redevelopment          90 - 135     started late 2019
         NZTA PN regional road & Napier Road      cost and timing to be confirmed
         NZTA Otaki to North of Levin              817           2024 - 2029
         BUPA retirement village                    40          started 2017
         KiwiRail regional freight hub            cost and timing to be confirmed
         MidCentral DHB acute services block       370         timing uncertain
         MidCentral surgical and mental health      57           early 2021
         Countdown distribution centre              66          2020 - 2021
         Countdown supermarket                      20           start 2021
         Palmerston North new schools               60          2021 - 2030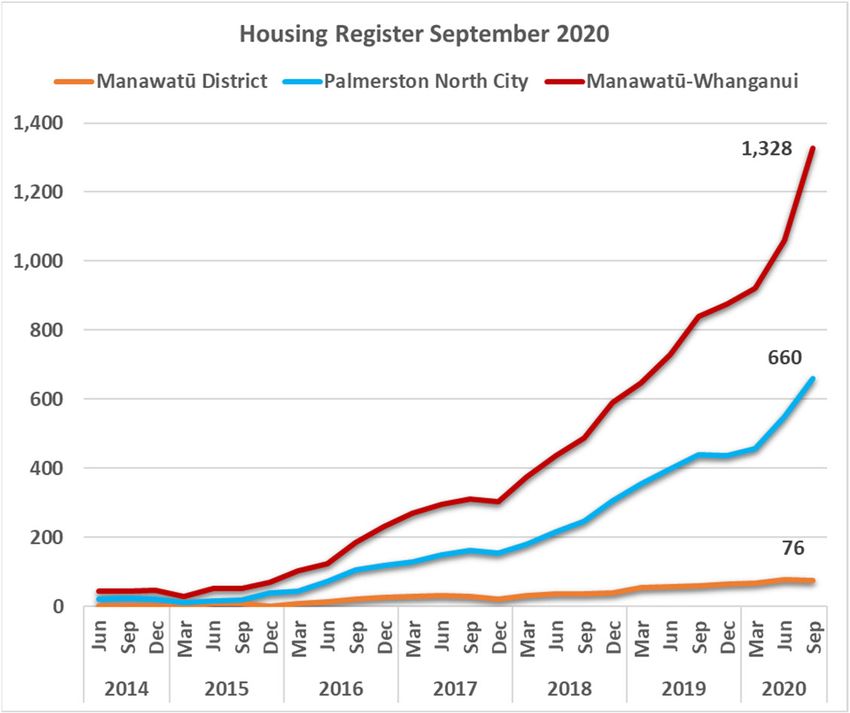
Labour force indicators reflect the moderate impact of COVID‐19
• The District unemployment rate remains beneath the
Manawatū‐Whanganui Region
and NZ unemployment rate (2.8% vs 5.1%)
Change in the Labour Force – Sep 2020 vs Mar 2020
• The number of people of working age increased by
1,000 between March and September while 300 less
Working age population = 202,900 (↑ 1,000)
people were either working or available for work
• The underutilisation rate declined from 15.0% in the Workforce = 138,900 LFPR = Not in
Workforce =
June quarter to 12.8% in the Sept quarter (↓300) 68.4%
64,000 (↑
(↓0.5%) 1,300)
• There was 1,100 less people employed in the region in
the September quarter vs the March quarter
Employment Unemployment
• In contrast, there were 6,000 more people employed rate = 65.2% rate = 4.7% (↑
0.7%)
(↓ 1.0%)
in the September 2020 quarter vs September 2019
• Labour force changes are an important indicator and
Underutilisation
will continue to be monitored in detail. rate = 12.8% (↑
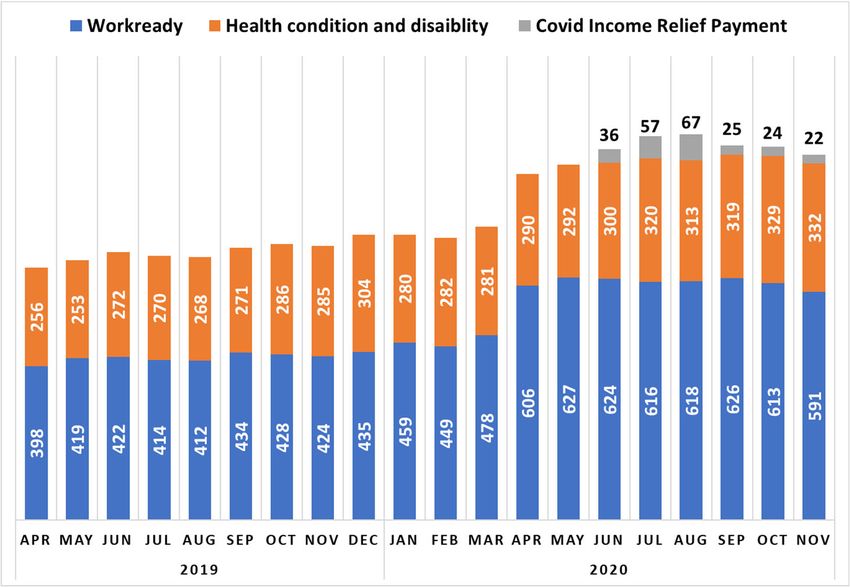
2.2%)Jobseekers decline while employment intentions remain strong • Total jobseekers and recipients of COVID Income Relief Payment ↓ 25 (from Sept) to 945 in November 2020; • Workready jobseekers ↓ 35, Jobseekers (health condi on) ↑ 13 and CIRP recipients ↓ 3; • To YE Nov, combined income payments increased by 236. This is ↑33.3% on Nov 2019 compared with ↑ 48.2% in NZ. • Job ads indicate strong local recruitment inten ons ↑31.5% on Feb 2020 vs NZ ↓ 6.9%.
No slowing down in house price growth
New dwellings and construction investment holds up relatively well
Rental prices continue to grow while social housing demand plateaus
Annual retail spending ↑ 3.3% vs a ↓ 3.2% in na onal spending
Things to watch
 • Trade conditions
    • The impact of global economic restrictions on demand for NZ beef and lamb
    • We will be watching this closely!
 • Housing market
    • Availability and affordability of housing
    • Not as simple as hiking interest rates or imposing LVRs
 • Legislative risk
    • Climate Change Response (Zero Carbon) Amendment Bill and RMA reform
    • NPS – Freshwater Management, Urban Development, Highly Productive Land
    • Holidays (Increasing sick leave) Amendment Bill and Minimum wage increases
Local industry strengths are driving economic performance • Food production, government employment, high levels of inward investment and limited exposure to international tourism have driven our strong economic performance; • Continued demand for our exports is crucial to local economic performance. Data will be watched closely; • Labour market data shows we have not escaped the impacts of COVID‐19, however, impacts have been substantially less than expected. Levels of jobs growth and strong employment intentions are positive; • Consumption indicators are strong and reflect the confidence of local businesses and households. This is particularly positive for the District and will support jobs and incomes in the services sector; • Cost pressures in the housing market and increasing rental prices continue to place pressure on vulnerable families. A comprehensive and well‐informed response is needed; and, • Central Government legislation is likely to impose additional costs and resource needs on local government and private businesses. The impacts and opportunities will also be watched closely!
You can also read