Market Update CAMBODIA - June 2021
←
→
Page content transcription
If your browser does not render page correctly, please read the page content below
CAMBODIA
                           ………………………….……………………….…………….

                           Market Update
                                                                    June 2021

                  Focus: Effect of the COVID-19 outbreak on food prices

                     United Nations World Food Programme in partnership with
Agriculture Marketing Office of the Ministry of Agriculture, Forestry and Fisheries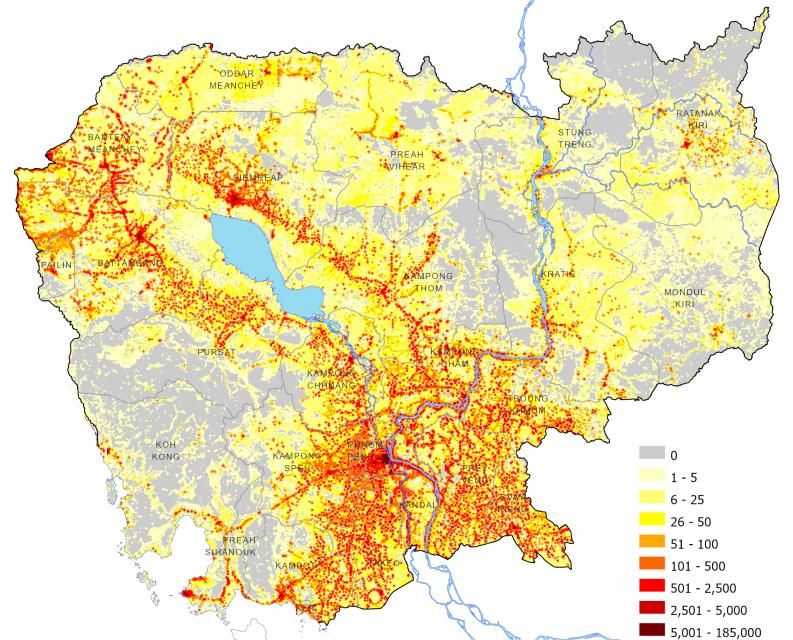
Market Update – June 2021

 Preface                                                                Content

The COVID-19 pandemic has been rapidly evolving since the               1.   Key findings                                                              3
beginning of 2020. On 11 March 2020, the World Health
                                                                        2.   Results
Organization (WHO) categorized it as a global pandemic. There have
been more than 181.5 million confirmed cases and more than 3.9               Market functionality                                                      4
million deaths worldwide (WHO, 1 July 2021). In Cambodia, since the          National: Price trends of mixed rice, duck egg, and morning glory         5
first reported case on 27 January 2020, there have been a total of
                                                                             National: Price trends of snakehead fish, pork, and vegetable oil         6
51,384 confirmed cases, of which 48,704 cases were linked to the
February 2021 community outbreak, and 628 deaths as of 30 June               National: Cost of a balanced food basket                                  7
2021 (MOH, 1 July 2021).                                                     Sub-national: Price differences and changes in urban and rural areas      8
The COVID-19 pandemic has had a major impact on the global                   Sub-national: Price variation for mixed rice and duck eggs                9
economy. Trade and travel have been severely restricted and many
                                                                             Sub-national: Price variation for snakehead fish and vegetable oil       10
countries, including Cambodia and others across Asia, have
instituted measures to contain the spread. In April 2021, Cambodia
implemented a series of lockdowns in Phnom Penh and other               3.   Context
locations in an attempt to contain the February 2021 community               Trade and local production                                               11
outbreak.                                                                    Policy response                                                          12
In order to understand if the COVID-19 pandemic has impacted food
availability and access at markets in Cambodia, the World Food          4.   Methods and market locations                                             13
Programme (WFP) monitors the retail and wholesale prices of key
food commodities (see Annex 1 and 2) in 45 urban and rural markets      5.   Annex 1
across the country (see Methods section for more details). An                Changes in retail prices                                                 14
average of 340 traders and market chiefs are called every two weeks
using a call center contracted by WFP. In addition to prices, market    6.   Annex 2
chiefs are also interviewed to assess market functionality, including        Changes in wholesale prices                                              15
supply and demand issues. Additional information is used to
interpret the results and understand the broader context.               7.   Annex 3
                                                                             Cost of a balanced food basket                                           16
This update is based on market data collected in the first and third
weeks of June 2021.                                                     8.   Annex 4
This system is based on long-term cooperation between WFP and                Rainfall anomaly, seasonal calendar, population distribution and
the Agricultural Marketing Office (AMO) of the Ministry of                     paddy cultivation areas                                                17
Agriculture, Forestry and Fisheries (MAFF).                                                                                                                  2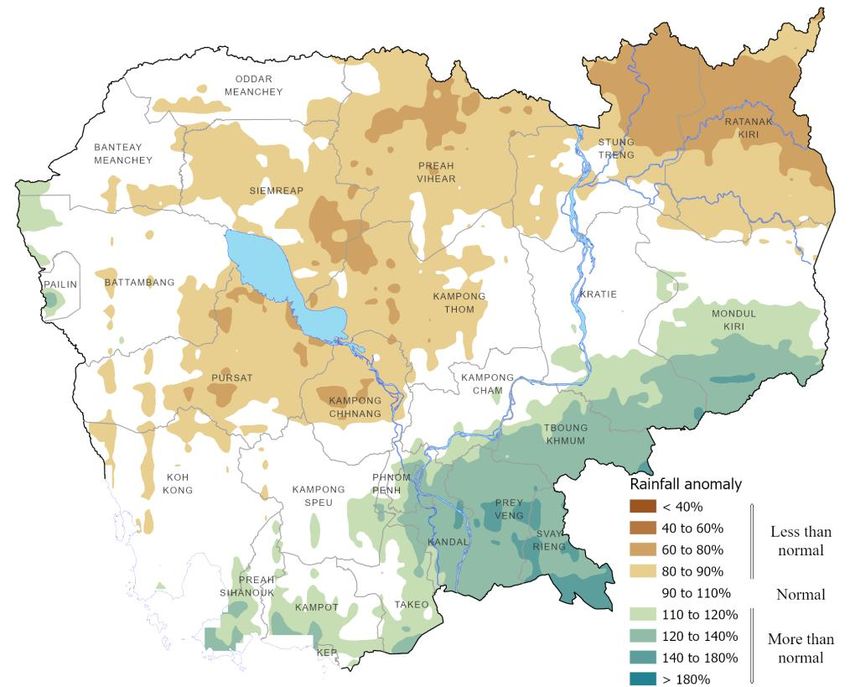
Market Update – June 2021

 Key findings
             COVID-19 & Environmental                          National Food Price Trend Analysis                       Sub-national Monthly Food
             Factors Influencing Prices                        (January 2020 – June 2021)                               Price Change (June 2021)

The COVID-19 pandemic continues to spread          Since January 2020, domestic food prices have                 In June 2021, the average retail prices for
and impact economic activities across the          remained stable for most key food commodities,                mixed rice and pork in rural areas were
world. The World Bank has estimated that           though spikes in March and October were observed.             slightly higher than in urban areas while the
economic activity in Cambodia contracted by        The March spike resulted largely from disruptions             average retail prices of snakehead fish, duck
3.1% in 2020 due largely to the impacts of         related to the increase of COVID-19 cases and                 eggs, vegetable oil, and morning glory in rural
COVID-19 but is expected to grow 4% in 2021.       subsequent border closures. Price fluctuations in             areas were lower than in urban areas.
                                                   October and November 2020 were mainly linked to the
The Government officially announced the                                                                          One-month price changes for all key food
                                                   large-scale floods. Since January 2021, the national
extension of financial support to poor and                                                                       commodities (except pork) in rural and urban
                                                   average retail prices for duck eggs, morning glory and
vulnerable families and a tax exemption for                                                                      areas followed the same direction (increased).
                                                   snakehead fish have mostly remained lower than 2020
key economic sectors (garment, tourism, civil                                                                    The price trend of snakehead fish and
                                                   while prices for rice, pork and vegetable oil are higher.
aviation, transportation and logistics) until                                                                    morning glory account for the highest
September 2021 to help the country cope with       The cost of a balanced food basket spiked twice in 2020       increase in rural and urban areas,
the impact of COVID-19 pandemic on socio-          – in March and October/November 2020 – to                     respectively.
economic, trade and investment conditions          approximately 110,000 riels/person/month. The cost
                                                                                                                 At provincial level, Koh Kong, Phnom Penh,
(Minister Cabinet, 29 June 2021).                  has remained relatively stable in first five months of
                                                                                                                 and Kampong Chhnang province had the
                                                   2021 before increasing moderately in June to
Through the first six months of 2021,                                                                            highest reported prices for several key food
                                                   107,406 riels/person/month. The June 2021 cost is 7.4%
Cambodia exported 280,450 MT of milled rice,                                                                     commodities such as rice, duck eggs,
                                                   above the cost as measured in June 2020 (see Annex 3
a decrease by 29% compared to the same                                                                           snakehead fish and vegetable oil.
                                                   for methodology).
period last year.

Conclusion:
In June 2021, national average retail prices for most key food commodities showed modest changes. Month-on-month price increases, especially those observed in
urban markets, suggest that the ongoing lockdowns in various provinces due to COVID-19 might be beginning to have some impact on supply chains. Customer
traffic at markets began to drop again after showing some improvement in May. Since June 2020, approximately 652,400 IDPoor households (or approximately
2.58 million people) have received Government cash transfers totaling an estimated USD 351 million. The Government has also officially extended the cash transfer
programme to September 2021. The Post-lockdown Cash Transfer Programme has identified about 275,000 eligible garment workers from 513 factories in Phnom
Penh municipality, Krong Ta Khmau, and Krong Preah Sihanouk, as of June 2021. In addition, the Government has also registered 120,953 households countrywide
for the one-off Social Assistance Cash Transfer for Post Lockdown.                                                                                                3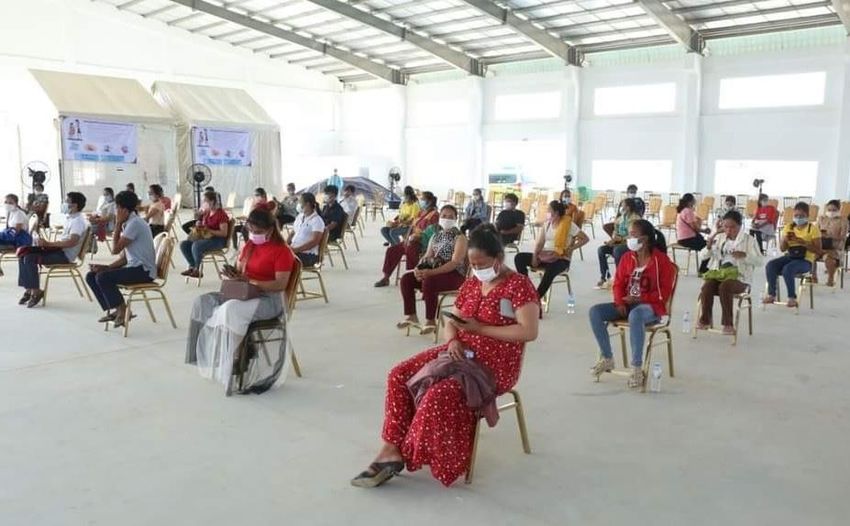
Market Update – June 2021

Market functionality
In the 45 markets monitored across the country, market chiefs were interviewed on the availability and supply of food in the market, market functionality
and accessibility, and the number of customers visiting their respective markets in the first and third weeks of the month. In June 2021, markets in a
number of provinces were closed due to increasing local cases of COVID-19. Within the remaining surveillance markets, the number of customers
dramatically dropped again in the first week of June 2021 but recovered somewhat in the third week. About one-fourth of markets (23%), however,
reported facing an increase in supply prices in the first week of June 2021, a sign that supply chains have not yet completely normalised since the February
2021 community outbreak.

                    May-Jun 2020: Slowdown          17-21 Aug           16-18 Sep     7 Oct 2020:          28 Nov 2020:                   20 Feb 2021:         14-16 Apr 2021: Khmer New Year
                    in new COVID-19 cases;          2020: Major         2020: Major   Start of             1st COVID-19                   2nd COVID-19         14-28 Apr 2021 to 05 May 2021:
                    schools begin reopening         holiday             holiday       flash floods         community                      community            Lockdown in PNH and Ta Khmau
                                                                                                           transmission                   transmission

              180

              160
  Increased

              140

              120

No Change 100
               80
  Decreased

               60

               40

               20

               -
                    W3    W1   W3   W1    W3   W1         W3   W1   W4     W1   W4    W1   W3   W1     W3      W1    W3   W1         W3   W1   W3    W1    W3     W1    W3     W1   W3   W1     W3

                    Apr    May         Jun          Jul           Aug        Sep       Oct           Nov          Dec          Jan          Feb          Mar          Apr        May       Jun

                                                                    2020                                                                                       2021

                                                                    Change in Customers Visiting Markets
                                                                                                                                                                                                         4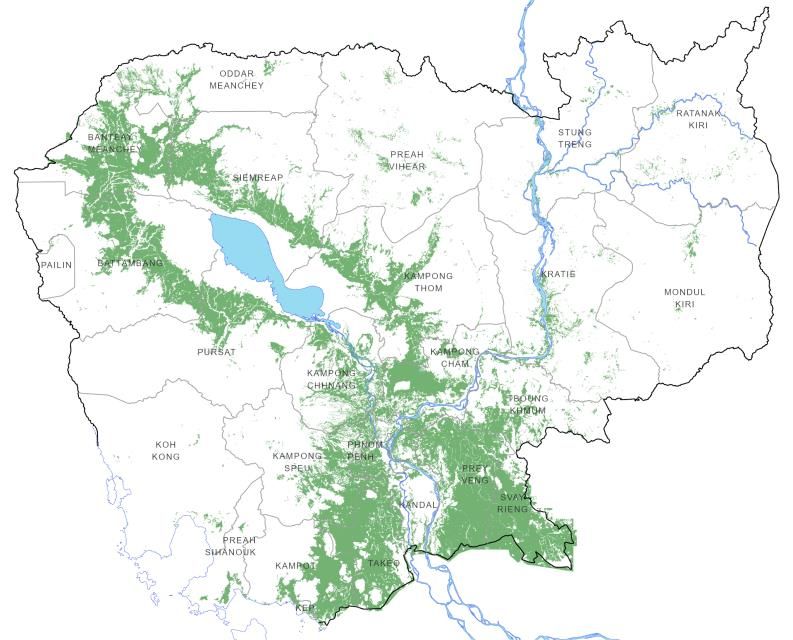
Market Update – June 2021

National: Price trends of mixed rice, duck eggs, and morning glory
National average retail prices for three commonly consumed food commodities (mixed rice, duck eggs and morning glory1) all increased in June 2021,
following a relatively stable period observed since the price spikes during the October 2020 floods. In June 2021, the national average retail price of mixed
rice was 2,196 Riels/kg: +2.6% month-on-month (MoM) and +9.6% year-on-year (YoY). The price of mixed rice in 2021 has remained above the 2020 price
for the first six months of the year. The national average retail price for morning glory was 2,646 Riels/kg: +11.6% MoM and +6.8% YoY. The price for duck
eggs was 4,846 Riels/10eggs: +5.2% MoM and –4.1% YoY. See Annex 1 and 2 for additional prices.

                                             20 Feb 2021: 2nd COVID-     7 Mar 2020: Confirmed      14-16 Apr 2021: Khmer New Year                 17-21 Aug         16-18 Sep           7 Oct 2020: Start     28 Nov 2020: 1st COVID-
                                             19 community                COVID 19 cases rise        14-28 Apr 2021 to 05 May 2021:                 2020: Major       2020: Major         of flash floods       19 community
                                             transmission                                           Lockdown in PNH and Ta Khmau                   holiday           holiday                                   transmission

                                         6,000

                                         5,500

                                                                                                                               4,846 riels
    Average National Prices (Riels/kg)

                                         5,000

                                         4,500

                                         4,000

                                         3,500

                                         3,000
                                                                                                                               2,646 riels

                                         2,500
                                                                                                                               2,196 riels

                                         2,000

                                         1,500             2             2              3               4                  4
                                                     Jan           Feb            Mar             Apr                May        Jun          Jul             Aug              Sep            Oct             Nov           Dec

                                                                                    អង្ករចម្រុះ/ Mixed Rice - 2020                                      អង្ករចម្រុះ/ Mixed Rice - 2021
                                                                                    ស៊ុតទា / Duck egg (Riels/10 eggs) - 2020                            ស៊ុតទា / Duck egg (Riels/10 eggs) - 2021
                                                                                    មតកួន / Morning glory - 2020                                        មតកួន / Morning glory - 2021

1 Morning glory is commonly eaten in Cambodia and its price trend does not always indicate price fluctuations of other vegetables in the Annexes.
2 Food prices in 2020 were remotely collected in the first week of the month in only 14 markets.
3 Food prices in 2020 were remotely collected in the first week of the month in only 14 markets and face-to-face collected by AMO in the third week of the month in 31 additional markets.
4 Food prices in 2020 were remotely collected in the first week of the month in only 14 markets and in the third week of the month in 45 markets. However, because of market closures during the lockdown from mid-April

2021, food price data in the 3rd week of April and 1st and 3rd weeks of May from the sentinel markets in Phnom Penh, Kandal and Preah Sihanouk were not available for analysis.                                                          5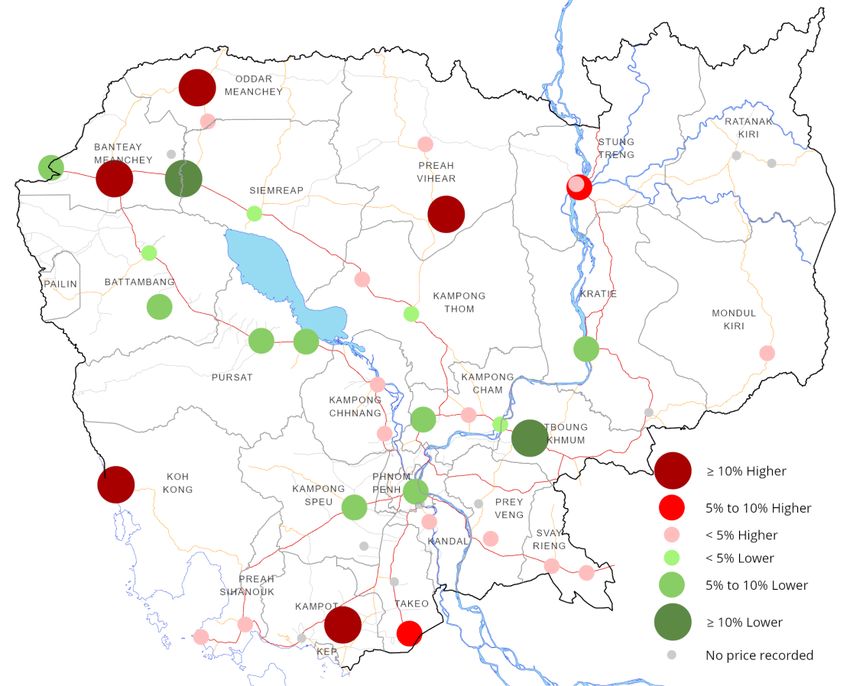
Market Update – June 2021

National: Price trends of snakehead fish, pork, and vegetable oil
National average retail prices of another three commonly consumed food commodities (snakehead fish, pork and vegetable oil) were also above their
2020 averages. In June 2021, the national average retail price for snakehead fish was 10,140 Riels/kg: +7.7% month-on-month (MoM) and +9.7% year-on-
year (YoY). National average retail price for pork was 21,655 Riels/kg: -0.5% MoM but +4.1% YoY. National average retail price for vegetable oil was 26,196
Riels/5 litres: +3.0% MoM and +35.0% YoY. See Annex 1 and 2 for additional prices.

                                             20 Feb 2021: 2nd COVID-         7 Mar 2020: Confirmed       14-16 Apr 2021: Khmer New Year                     17-21 Aug          16-18 Sep             7 Oct 2020: Start     28 Nov 2020: 1st COVID-
                                             19 community                    COVID 19 cases rise         14-28 Apr 2021 to 05 May 2021:                     2020: Major        2020: Major           of flash floods       19 community
                                             transmission                                                Lockdown in PNH and Ta Khmau                       holiday            holiday                                     transmission

                                         30,000

                                                                                                                                       26,196 riels

                                         25,000
    Average National Prices (Riels/kg)

                                                                                                                                       21,655 riels

                                         20,000

                                         15,000

                                                                                                                                       10,140 riels
                                         10,000

                                          5,000
                                                            1                1              2                3              3
                                                      Jan              Feb            Mar              Apr                May           Jun           Jul             Aug              Sep               Oct             Nov          Dec

                                                                                        មតីផ្ទក់(រស់) / Snakehead fish (Live) - 2020                               មតីផ្ទក់(រស់) / Snakehead fish (Live) - 2021
                                                                                        សាច់មរូក៣ជាន់ / 3-layer pork/Pork with fat - 2020                          សាច់មរូក៣ជាន់ / 3-layer pork/Pork with fat - 2021
                                                                                        ប្មេង្ឆា / Vegetable Oil - 2020                                            ប្មេង្ឆា / Vegetable Oil - 2021

1 Food prices in 2020 were remotely collected in the first week of the month in only 14 markets.
2 Food prices in 2020 were remotely collected in the first week of the month in only 14 markets and face-to-face collected by AMO in the third week of the month in 31 additional markets.
3 Food prices in 2020 were remotely collected in the first week of the month in only 14 markets and in the third week of the month in 45 markets. However, because of market closures during the lockdown from mid-April

2021, food price data in the 3rd week of April and 1st and 3rd weeks of May from the sentinel markets in Phnom Penh, Kandal and Preah Sihanouk were not available for analysis.
                                                                                                                                                                                                                                                     6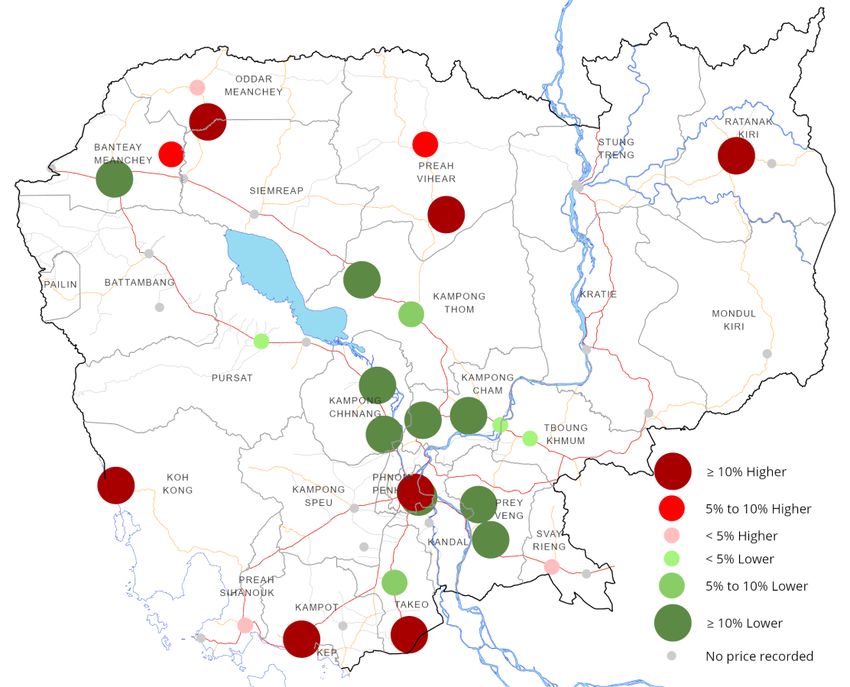
Market Update – June 2021

            National: Cost of a balanced food basket
         The cost of a balanced food basket1 was calculated to assist with interpreting the impact of monthly food commodity price changes on the cost of a healthy
         diet consumed in Cambodia. The average cost of a balanced food basket spiked in March and October/November 2020 to 110,000 riels/person/month,
         reflecting price disruptions resulting from the initial impacts of COVID-19 and large-scale flooding, respectively. Since January 2021, the average cost of a
         balanced food basket has remained relatively stable; however, reflecting increases in underlying food prices, the cost experienced a moderate increase in
         June 2021, with the average cost of a balanced food basket of 107,403 riel/person/month, +4.6% MoM and +7.4% YoY.

                                                   20 Feb 2021: 2nd COVID-        7 Mar 2020: Confirmed        14-16 Apr 2021: Khmer New Year                      17-21 Aug          16-18 Sep           7 Oct 2020: Start         28 Nov 2020: 1st COVID-
                                                   19 community                   COVID 19 cases rise          14-28 Apr 2021 to 05 May 2021:                      2020: Major        2020: Major         of flash floods           19 community
                                                   transmission                                                Lockdown in PNH and Ta Khmau                        holiday            holiday                                       transmission

                                           115,000
Cost of Food Basket (Riels/Person/Month

                                           110,000
                                                                                                                                           107,403 riels

                                           105,000

                                           100,000

                                             95,000

                                             90,000
                                                             Jan            Feb             Mar             Apr             May              Jun             Jul            Aug             Sep              Oct              Nov            Dec

                                                                                                                                        2020             2021

                                          1 Balanced food basket consists of key commodities such as mixed rice, snakehead fish, pork, duck egg, vegetable oil, sweet potato and morning glory which contribute to the minimum energy requirement of 1,937
                                          kcal per person per day. The minimum energy requirement was adopted from WFP’s Minimum Expenditure Basket (MEB) study in Cambodia. See Annex 3 for more details on the methodology.
                                                                                                                                                                                                                                                              7
Market Update – June 2021

Sub-national: Price differences and changes in urban and rural areas
In June 2021, the average retail prices for mixed rice and pork in rural areas were slightly higher                            Table 1: Retail prices (riels) in rural and urban areas
than in urban areas while the average retail prices of snakehead fish, duck eggs, vegetable oil, and                                                                    Urban            Rural
morning glory in rural areas were lower than in urban areas (Table 1). Between May and June 2021,                              Mixed rice (kg)                             2,185            2,209
the average retail price for mixed rice, snakehead fish, duck egg, vegetable oil, and morning glory in
rural and urban areas followed the same direction of change (increased). Prices of snakehead fish,                             Snakehead fish (Live) (kg)                 10,263            9,928

duck egg, mixed rice, vegetable oil, and morning glory increased by 8.2%, 5.6%, 2.6%, 1.6% and                                 Pork with fat (kg)                         21,458           21,928
1.1% MoM in rural areas, respectively and 7.5%, 5.5%, 2.5%, 3.8%, and 18.5% MoM in urban areas,
                                                                                                                               Duck egg (10 eggs)                          4,938            4,742
respectively. Prices of pork increased by 2.2% MoM in rural areas but declined by 2.2% MoM in
urban areas.                                                                                                                   Vegetable oil (5 liters)                   26,361           25,900

                                                                                                                               Morning glory (kg)                          2,719            2,546

                                                  Monthly change (%) in retail prices of key food commodities
                                                                    May 2021 vs June 2021
                                                  រនេទ / Rural                                                                                    ទីមេរ៊ុុំរន / Urban

      មតី ផ្ទក់ (រស់)                                                                                  មតកួ ន
 Snakehead fish (Live)
                                                                        8.2%                                                                                                                     18.5%
                                                                                                   Morning glory

                 ស៊ុតទា                                                                        មតី ផ្ទក់ (រស់)
               Duck egg
                                                               5.6%                                                                                            7.5%
                                                                                           Snakehead fish (Live)

              អង្ករចម្រុះ                                                                                 ស៊ុតទា
              Mixed rice
                                                    2.6%                                                                                                5.5%
                                                                                                        Duck egg

       សាច់ មរូក៣ជាន់                                                                                  ប្មេង្ឆា
         Pork with fat
                                                   2.2%                                                                                          3.8%
                                                                                                   Vegetable oil

              ប្មេង្ឆា                                                                                 អង្ករចម្រុះ
          Vegetable oil
                                                1.6%                                                                                       2.5%
                                                                                                       Mixed rice

              មតកួ ន                                                                            សាច់ មរូក៣ជាន់
          Morning glory
                                               1.1%                                                                    -2.2%
                                                                                                  Pork with fat

                            -5%        0%                 5%                 10%   15%   20%                         -5%         0%              5%               10%              15%           20%

NB: Data is from all 45 markets. See the Methods section for more details.
                                                                                                                                                                                                    8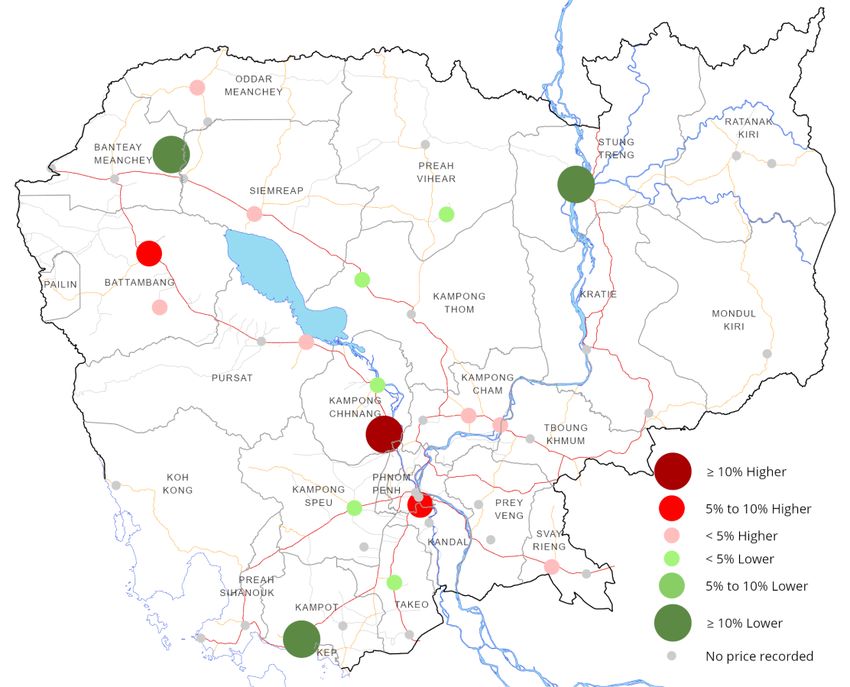
Market Update – June 2021

Sub-national: Price variation for mixed rice and duck eggs
In June 2021, the national average retail price for mixed rice was                   In June 2021, the national average retail price for duck eggs was
2,196 Riels/kg. The highest price was 3,000 Riels in Dang Tong market in             4,846 Riels/10 eggs. The highest price was 5,500 Riels and was reported
Koh Kong province, which was 37% higher than the national average. The               in Ou Russey market in Phnom Penh (13% higher than the national
lowest price was 1,900 Riels in Kralanh market in Siem Reap province,                average). The lowest price (4,000 Riels) was in Boeung Chhouk market in
13% lower than the national average. Percentage of price deviation                   Battambang (17% lower than the national average). Percentage of price
in other markets can be found in the map below.                                      deviation in other markets can be found in the map below.

   Mixed rice prices by province vs national                                                  Duck egg prices by province vs national
          average prices (June 2021)                                                                average prices (June 2021)

                                                            Deviation from Average                                                              Deviation from Average
                                                            National Price                                                                      National Price

                                                                                                                                                                    9
Market Update – June 2021
Sub-national: Price variation for snakehead fish and vegetable oil
In June 2021, the national average retail price of snakehead fish In June 2021, the national average retail price of vegetable oil was
(live) was 10,140 Riels/kg. The highest price (15,000 Riels) was found in 26,196 Riels/5 liters. The highest price (30,000 Riels) was in Sala 5
Ou Russey market in Phnom Penh province (48% higher than the national market in Kampong Chhnang province (15% higher than the national
average). The lowest price (8,000 Riels) was found in Pha Oav market in average). The lowest price (22,000 Riels) was found in Phnom Srok
Kampong cham province (21% lower than the national market in Banteay Meanchey province (16% lower than the national
average). Percentage of price deviation in other markets can be found in average). Percentage of price deviation in other markets can be found in
the map below. the map below.
Snakehead fish prices by province vs national Vegetable oil prices by province vs national
average prices (June 2021) average prices (June 2021)
Deviation from Average Deviation from Average
National Price National Price
10Market Update – June 2021
Trade and local production
Despite the continuing impact of COVID-19 on the Cambodian economy in 2021,
Milled rice exports, as of June 2021,
aggregate statistics of trade and agricultural production remain favorable.
According to the first semester report from the Ministry of Agriculture, Forestry by destination
and Fisheries (MAFF) released 7 July 2021, through June 2021 the cultivated area of
wet season paddy was 1,983,045 hectares, about 11% higher than 2020. In Other
addition, horticulture cultivation reached 43,202 hectares, 2% higher than 2020. countries
15%
In the first six months of 2021, exports of agricultural production totaled more
than 4.4 million MT (equivalent to USD 2.57 billion), about 85% higher than the
same period last year (Official Facebook Page of H.E. Veng Sakhon, Minister of ASEAN
MAFF). Cambodia had exported approximately 1.69 million MT of paddy rice to Countries
Vietnam and United Arab Emirates, 72% higher than the same period last year. 10% 280,450 China
In addition, milled rice exports were 280,450 MT (equivalent to USD 202.67 million),
Tonnes 51%
a decrease of about 29% compared to the same period last year (Cambodia Rice
Federation, 4 July 2021). China continues to be the main destination of milled rice
exports (51%), followed by the European Union (24%), ASEAN countries (10%) and European
other countries (15%) accounting for the remainder (MAFF’s First Semester report). Union
24%
In the first six months of 2021, Cambodia also exported other key agricultural
products, including 1.23 million MT of dry cassava (+19% compared last year),
358,800 MT of fresh cassava (-12%), 15,903 MT of cassava powder (+16%), 0.84 Source: MAFF’s First Semester Situation report, 7 July 2021
million MT of cashew nut (+336%), 140,670 MT of corn (+176%), 18,580 MT of mung
bean (+586%), 17,750 MT of soybean (+100%), 159,770 MT of fresh mango (+246%),
24,400 MT of oil palm (+9%), 14,560 MT of pepper (+399%), 880 MT of tobacco (-
56%) and 45 MT of mixed vegetable (-29%) (MAFF’s First Semester report).
11Market Update – June 2021
Policy response
Social policy response
The Government's COVID-19 economic recovery plan includes several
social protection measures. Since 24 June 2020, the Government has
implemented a nationwide cash transfer programme for poor and
vulnerable households during the pandemic. According to the Ministry of
Social Affairs, Veterans and Youth Rehabilitation (MoSAVY), about 652,484
IDPoor households (approximately 2.6 million people) received the latest
round of cash transfers between 25 May 2020 to 24 June 2021. Since June
2020, the Government has distributed an estimated USD 351.77 million to
IDPoor households. The government has officially announced the
continuation of the programme for another three months from July to
September 2021.
In addition, the Government has identified and registered another
120,953 households countrywide for the one-off Social Assistance Cash
Transfer for Post Lockdown Program (IDPoor Department of the Ministry
of Planning, July 2021).
According to the Ministry of Labour and Vocational Training, as of 22 June 275,000 Garment workers, living in lockdown area of Phnom Penh municipality,
2021, more than 275,000 garment workers from 513 factories are eligible Krong Ta Khmau and Krong Preah Siheanouk will receive 160,000 riels from one-
and will receive 160,000 riels from the one-off Social Assistance Cash off Social Assistance Cash Transfer for Post Lockdown Program, implementing by
Transfer for Post Lockdown Program in Phnom Penh, Takhmau and Preah MoSAVY.
Sihanouk. Source: Facebook Page of Social Protection in Cambodia, 22 June 2021,
COVID-19 vaccination
According to the Ministry of Health, the Government aims to vaccinate a
total of 10 million people in Cambodia. As of 30 June 2021, more than 4.2
million people (of which about 2 million women) had received at least the
1st dose. Among them, around 3 million people (of which about 1.4 million
women) have received their 2nd dose. The vaccination progress was
around 42% of the plan.
12Market Update – June 2021
Methods and market locations
In November 2019, WFP began
monitoring food prices in selected
markets using a call center. Trained
operators called traders once a month
to collect data on 36 food commodities
in 14 urban and rural markets in
Battambang, Kampong Chhnang,
Kampong Thom, Otdar Meanchey, Siem
Reap, Preah Vihear and Stung Treng.
In March 2020, WFP, in collaboration
with the Agricultural Marketing Office
(AMO) of the Ministry of Agriculture,
Forestry and Fisheries (MAFF),
conducted a market survey in 31
additional markets to collect baseline
data and expand the geographic
coverage of markets. In these markets,
the price of 16 key food commodities
and information on market
functionality is also collected.
From mid-April 2020, WFP expanded
remote market monitoring to all 45
markets and increased the frequency
to twice a month (i.e., the first and third
weeks of the month).
Agricultural Marketing Office United Nations World Food Programme
Department of Planning and Statistics, Vulnerability Analysis and Mapping (VAM) Unit
Ministry of Agriculture, Forestry and Fisheries Aaron Wise aaron.wise@wfp.org , Yav Long yav.long@wfp.org , Chanvibol Choeur
Meach Yady meachyady@gmail.com chanvibol.choeur@wfp.org , Vannareth Huoy vannareth.huoy@wfp.org
Website: https://www.amis.org.kh/ Website: https://www.wfp.org/countries/cambodia 13Market Update – June 2021
Food Commodity Unit Average retail Change of retail Change of retail Change of retail
prices of prices compared prices compared prices compared
current month to last month to last 3 months to same month,
last year
1.1. អង្ករចម្រុះ/ Mixed Rice Riels/Kg 2,196 u 2.6% u 0.7% p 9.6%
2.1. មតីផ្ទក់(រស់)/ Snakehead fish (Live) Riels/Kg 10,140 p 7.7% p 20.4% p 9.7%
2.2. មតីមា(រស់)/ Trey Pra (Live) Riels/Kg 6,741 u -0.7% p 5.1% u -1.6%
2.3. មតីអណ្តែង្(រស់)/ Cat fish (Live) Riels/Kg 7,730 p 7.3% p 10.0% u 3.6%
Annex 1
2.4. មតីផ្ទក់ប្ង្ៀត/ Dried snake fish Riels/Kg 25,094 u -0.7% p 5.6% u -1.2%
3.1. សាច់មរូក៣ជាន់/ 3-layer pork/Pork with fat Riels/Kg 21,655 u -0.5% u -1.2% u 4.1%
Change in
4.1. ស៊ុតទា/Duck egg (Riels/10 eggs) Riels/10 eggs 4,846 p 5.2% p 9.7% u -4.1%
4.2. ស៊ុតទាប្មេ/Salty/Fermented duck egg Riels/10 eggs 6,110 u -3.4% u 0.4% q -5.2%
retail prices
5.1. ប្មេង្ឆា/ Vegetable Oil: Saji ឬ Mongsay ឬ Cailan Riels/ 5 litre 26,196 u 3.0% p 7.2% p 35.0%
6.1. អុំេិល្៉ត់អ៊ុីយូត/ Iodized salt Riels/Kg 1,241 p 8.6% u 3.6% p 7.5%
(June 2021)
7.1. សណ្តែកដី/ Ground Nut* Riels/Kg 9,536 u -2.5% u -4.5% u -2.1%
8.1. មតកួន/ Morning glory Riels/Kg 2,646 p 11.6% p 8.3% p 6.8%
8.2. ការត ៉៊ុ / Carrot* Riels/Kg 3,484 u 4.0% p 10.6% u -3.6%
8.3. សលឹកាស/ Ivy gourd leave* Riels/Kg 4,271 u 0.8% q -23.0% q -8.9%
8.4. សលឹកម្រុំ/ Moringa leaves* Riels/Kg 4,981 q -8.3% p 28.1% p 30.0%
8.5. ប្សៃមកញាញ់/ Chinese spinach* Riels/Kg 4,357 p 18.3% p 38.2% p 5.6%
8.6. ប្សៃប្តឿ/ Pak Choi* Riels/Kg 4,840 p 18.5% p 40.1% u 4.9%
8.7. ប្សៃចង្កឹុះ/Chinese flowering cabbage Riels/Kg 3,690 p 11.6% p 19.7% p 10.6%
8.8. ប្សៃប្ ៀវ/Mustard Greens* Riels/Kg 3,667 p 21.1% p 14.5% p 8.6%
8.9. ផ្ទីដូង្/ Amaranthus* Riels/Kg 3,139 u 3.6% q -11.8% q -5.8%
8.10. សលឹកង្េ់/ Ngob leaves* Riels/Kg 5,067 p 12.5% q -8.8% p 8.7%
8.11. មតួយប្ពៃ/ Pumpkin leaves* Riels/Kg 4,833 p 57.4% p 9.3% p 7.2%
8.12. ណ្ផ្លប្ពៃ/ Pumpkin fruit* Riels/Kg 1,775 p 13.1% q -24.5% q -37.8% Change in the price compared to last
8.13. ប្លលក/ Bottle gourd* Riels/Kg 2,440 p 77.5% p 36.2% p 39.4% month and last year:
8.14. មតឡាច/ Wax gourd Riels/Kg 2,826 p 47.8% p 51.3% u 0.9% Increase when % > 5
8.15. មតេ់ណ្វង្/ Long eggplants Riels/Kg 2,809 p 30.2% p 27.8% u 4.7% Stable when % between 5 and -5
8.16. មតេ់ស្សួយ/ Round eggplants* Riels/Kg 2,819 p 47.9% p 24.7% q -25.7% Decrease when % < -5
8.17. ប្េ៉ង្ប្ា៉ ុះ/ Tomatoes* Riels/Kg 4,017 p 11.1% p 79.0% p 10.7%
8.18. នប្ោង្្ូល/ Spong gourd Riels/Kg 2,805 p 23.5% p 31.2% u 1.3% * Prices for these food commodities
8.19. នប្ោង្មររង្/ Ridge Gourd* 3,407 p 58.3% p 47.6% p 7.9%
are only collected in markets in
Riels/Kg
8.20. លហ៊ុង្ ី/ច Green papaya* 1,426 2.5% -16.5% 22.7%
provinces where home-grown school
Riels/Kg u q p
8.21. សណ្តែកគួរ/ Long bean
feeding is implemented.
Riels/Kg 4,982 p 32.0% p 66.7% p 7.1%
8.22. មតយូង្ប្ចក/ Banana flower* Riels/Kg 2,773 u 1.3% q -9.9% q -29.9%
8.23. ផ្កកខាត់ណា/ Cauliflower* Riels/Kg 6,833 u 1.5% p 64.5% p 5.6%
8.24. ប្ដើ្ខាត់ណា/ Chinese Kale* Riels/Kg 5,258 p 9.9% p 53.4% q -16.7%
8.25. ដុំឡូង្ពត៍ប្លឿង្/ Orange-flesh Sweet Potatoes* Riels/Kg 2,075 u -1.5% q -22.2% q -14.1%
14Market Update – June 2021
Food Commodity Unit Average Change of Change of Change of
wholesale wholesale prices wholesale prices wholesale prices
prices of compared to last compared to last compared to
current month month 3 months same month, last
year
1.1. អង្ករចម្រុះ/ Mixed Rice Riels/Kg 2,078 u 2.5% u 0.4% p 10.6%
2.1. មតីផ្ទក់(រស់)/ Snakehead fish (Live) Riels/Kg 9,186 p 6.7% p 20.3% p 8.8%
2.2. មតីមា(រស់)/ Trey Pra (Live) Riels/Kg 6,042 u -1.5% u 5.0% u -3.8%
2.3. មតីអណ្តែង្(រស់)/ Cat fish (Live) Riels/Kg 6,991 p 10.2% p 10.2% u 0.9%
Annex 2
2.4. មតីផ្ទក់ប្ង្ៀត/ Dried snake fish Riels/Kg 23,141 u 0.7% u 4.1% u -3.2%
3.1. សាច់មរូក៣ជាន់/ 3-layer pork/Pork with fat Riels/Kg 20,191 u -0.6% u -2.6% u 4.3%
Change in
4.1. ស៊ុតទា/Duck egg (Riels/10 eggs) Riels/10 eggs 4,368 u 4.6% p 9.1% q -6.6%
4.2. ស៊ុតទាប្មេ/Salty/Fermented duck egg Riels/10 eggs 5,612 u -3.6% u -0.2% q -6.8%
wholesale prices
5.1. ប្មេង្ឆា/ Vegetable Oil: Saji ឬ Mongsay ឬ Cailan Riels/ 5 litre 25,384 u 2.0% p 6.3% p 34.0%
6.1. អុំេិល្៉ត់អ៊ុីយូត/ Iodized salt Riels/Kg 1,015 p 7.6% u 0.0% u 1.3%
(June 2021)
7.1. សណ្តែកដី/ Ground Nut* Riels/Kg 9,089 u -4.6% u -0.5% u -1.7%
8.1. មតកួន/ Morning glory Riels/Kg 2,086 p 11.9% p 6.7% u 2.0%
8.2. ការត ៉៊ុ / Carrot* Riels/Kg 2,863 u 1.1% p 8.4% u -4.7%
8.3. សលឹកាស/ Ivy gourd leave* Riels/Kg 3,177 q -6.0% q -28.2% q -11.9%
8.4. សលឹកម្រុំ/ Moringa leaves* Riels/Kg 4,130 q -20.1% p 19.3% p 23.9%
8.5. ប្សៃមកញាញ់/ Chinese spinach* Riels/Kg 3,512 p 13.9% p 34.7% p 6.1%
8.6. ប្សៃប្តឿ/ Pak Choi* Riels/Kg 3,994 p 15.5% p 39.3% u 4.7%
8.7. ប្សៃចង្កឹុះ/Chinese flowering cabbage Riels/Kg 3,094 p 10.7% p 18.5% p 11.4%
8.8. ប្សៃប្ ៀវ/Mustard Greens* Riels/Kg 3,037 p 25.7% p 14.4% p 18.6%
8.9. ផ្ទីដូង្/ Amaranthus* Riels/Kg 2,287 p 5.9% q -12.7% q -5.9%
8.10. សលឹកង្េ់/ Ngob leaves* Riels/Kg 3,900 u -4.0% q -17.4% q -6.7%
8.11. មតួយប្ពៃ/ Pumpkin leaves* Riels/Kg 3,898 p 59.1% u 0.2% p 6.0%
8.12. ណ្ផ្លប្ពៃ/ Pumpkin fruit* Riels/Kg 1,228 p 18.3% q -32.4% q -49.0% Change in the price compared to last
8.13. ប្លលក/ Bottle gourd* Riels/Kg 1,600 p 36.2% p 7.3% p 6.7% month and last year:
8.14. មតឡាច/ Wax gourd Riels/Kg 2,281 p 45.0% p 59.8% u -4.3% Increase when % > 5
8.15. មតេ់ណ្វង្/ Long eggplants Riels/Kg 2,257 p 27.3% p 31.1% u -0.2% Stable when % between 5 and -5
8.16. មតេ់ស្សួយ/ Round eggplants* Riels/Kg 2,179 p 52.5% p 26.7% q -31.3% Decrease when % < -5
8.17. ប្េ៉ង្ប្ា៉ ុះ/ Tomatoes* Riels/Kg 3,349 p 17.2% p 91.1% p 12.1%
8.18. នប្ោង្្ូល/ Spong gourd Riels/Kg 2,188 p 22.0% p 25.2% q -7.5% * Prices for these food commodities
8.19. នប្ោង្មររង្/ Ridge Gourd* 2,563 p 54.0% p 43.3% u -1.7%
are only collected in markets in
Riels/Kg
8.20. លហ៊ុង្ ី/ច Green papaya* 1,061 5.0% -22.5% 20.1%
provinces where home-grown school
Riels/Kg p q p
8.21. សណ្តែកគួរ/ Long bean
feeding is implemented.
Riels/Kg 4,217 p 34.1% p 72.8% p 6.4%
8.22. មតយូង្ប្ចក/ Banana flower* Riels/Kg 2,312 q -5.9% q -11.0% q -35.9%
8.23. ផ្កកខាត់ណា/ Cauliflower* Riels/Kg 6,042 u 0.5% p 66.1% p 5.6%
8.24. ប្ដើ្ខាត់ណា/ Chinese Kale* Riels/Kg 4,394 p 6.1% p 57.1% q -23.1%
8.25. ដុំឡូង្ពត៍ប្លឿង្/ Orange-flesh Sweet Potatoes* Riels/Kg 1,542 q -14.9% q -33.5% q -21.2%
15Market Update – June 2021
Annex 3: Cost of a balanced food basket
The development of the balanced food basket Table 2. Summary of inputs for calculation of balanced food basket
presented in this report draws heavily from WFP’s 4 4
Minimum Expenditure Basket (MEB) analyses in Food Food Food commodity kcal/person/ g/person/day Riels/g Riels/person/
2 3 2 2 4
category commodity day month
Cambodia. To construct the food basket used in those
analyses, a reference cohort from the 2014 Cambodia Cereals Rice 1.1. អង្ករចម្រុះ/ Mixed 1,470.23 413.0 2.20 27,587
Rice
Socioeconomic Survey (CSES) dataset was established
based on the following criteria: Fish Mud fish 2.1. មតីផ្ទក់(រស់)/ 76.47 91.0 10.14 28,077
Snakehead fish (Live)
i. Household total monthly expenditures fall between
Meat Pork 3.1. សាច់មរូក៣ជាន់/ 3- 77.75 40.7 21.65 26,811
the 2nd and 4th quintiles; layer pork/Pork with fat
ii. Household has adequate food security (acceptable Egg Duck egg 4.1. ស៊ុតទា/Duck egg 21.92 11.8 7.75 2,794
food consumption scores);
Diary Milk ---NA--- 7 12.0 --- ---
iii. Household did not utilize any negative coping
strategies. 5.1. ប្មេង្ឆា/ Vegetable
Oil Vegetable oil Oil: Saji ឬ Mongsay ឬ 115.36 12.8 5.76 2,247
Cailan
A food basket for this reference cohort was then
established to understand if the consumption patterns Veg Morning Glory 8.1. មតកួន/ Morning glory 34.76 231.7 2.65 18,651
were in line with what would be expected of a
household to live a healthy and active life.1 To do this, 8.25. ដុំឡូង្ព័តប្លឿង្/
Tuber Sweet Potato Orange-flesh Sweet 19.21 19.6 2.08 1,237
certain food items were identified to represent the Potatoes
categories captured in the food expenditure module Soybean,
Pulses ---NA--- 8 21.6 --- ---
(see Table 2 for the full list). The kilocalories of each green bean
food were identified and the quantities were derived
Fruit Banana ---NA--- 91 96.4 --- ---
from the CSES 2014 expenditure data to determine if
the calories in the basket were in line with what one Total 1,937 950.6 --- 107,403
would expect of a person living a healthy and active life
from a rights-based perspective.
Because the WFP market monitoring system does not capture prices for a few food commodities used in the MEB analyses, these had to be dropped for
the balanced food basket tracked in this report. Nevertheless, the dietary pattern reflected by the food items (and their weights, as captured in the
g/person/day values) serve as a useful proxy for the cost of a balanced, healthy diet in Cambodia.
1 The balanced food basket described and used in this market update should not be confused or conflated with the food basket used by the Ministry of Planning National Institute of Statistics (NIS) to construct national
poverty lines. The basket in this report is constructed differently and is useful primarily as a proxy for food prices.
2 Cambodia Socioeconomic Survey 2014. National Institute of Statistics, Cambodia.
3 Estimating Minimum Expenditure Baskets And Expenditure Gaps In Cambodia. Technical Report, June 2020. WFP Cambodia.
4 Cambodia Market Update, June 2021. WFP Cambodia. 16Market Update – June 2021
Annex 4: Rainfall anomaly, seasonal Population Distribution
calendar, population distribution and
paddy cultivation areas
3-Month Rainfall Anomaly, as of June 2021
Population density
(Persons/km2)
Source: LandScan™ Global, Oak Ridge National Laboratory, 2019
Paddy Rice Cultivation Area
Seasonal Calendar
Dry
Land prep
season Growing Harvesting
& sowing
rice
Wet
Land prep
season Harvesting Transplanting/growing Harvesting
and sowing
rice
Jan Feb Mar Apr May Jun Jul Aug Sep Oct Nov Dec
Dry Season Wet Season Dry Season
Source: Preliminary Rainfall from CHIRPS and analysis by WFP Cambodia Source: Ministry of Land Management, Urban Planning and Construction, 2008
17You can also read