Massachusetts Restaurant Promotion Commission March 2020 - The Massachusetts Restaurant Industry
←
→
Page content transcription
If your browser does not render page correctly, please read the page content below
Report to the Legislature
                     Regarding
      The Massachusetts Restaurant Industry

Massachusetts Restaurant Promotion Commission
                  March 2020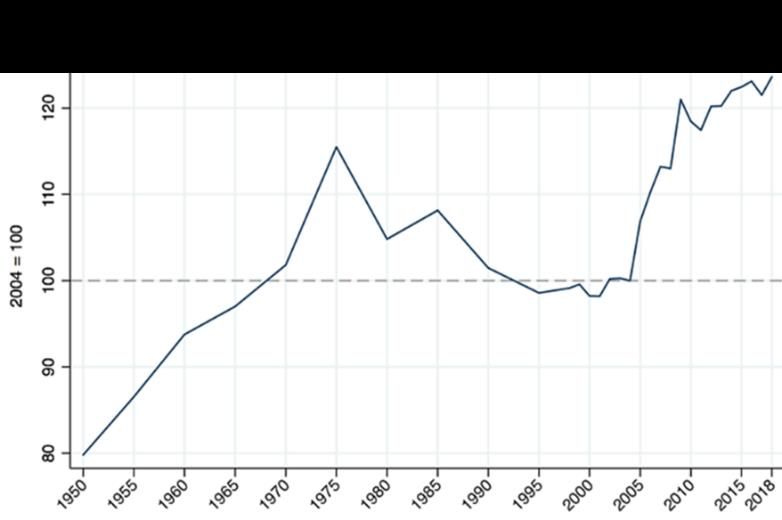
Table of Contents
Statutory Charge ........................................................................................................................................... 2
Massachusetts Restaurant Promotion Commission ..................................................................................... 3
Executive Summary ....................................................................................................................................... 4
Methodology ................................................................................................................................................. 9
Background ................................................................................................................................................. 10
Analysis ....................................................................................................................................................... 11
   Key Finding #1: Industry Profitability Headwinds ................................................................................... 12
   Key Finding #2: Disproportionate Regional Impact ................................................................................ 21
   Key Finding #3: Barriers to Opening a Restaurant .................................................................................. 23
Draft Recommendations for Consideration ................................................................................................ 27
Appendix ..................................................................................................................................................... 30

                                                                                1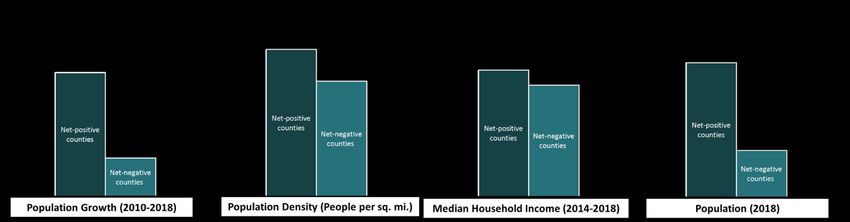
Statutory Charge
Chapter 49 of the Acts of 2019

There shall be a special commission, known as the restaurant promotion commission, to review and
develop recommendations and best practices for the promotion and continued growth and vitality of the
restaurant industry in the commonwealth. The commission shall consist of the following 11 members: the
house and senate chairs of the joint committee on tourism, arts and cultural development; 3 persons to be
appointed by the speaker of the house of representatives; 3 persons to be appointed by the president of
the senate; 1 person to be appointed by the minority leader of the house of representatives; 1 person to
be appointed by the minority leader of the senate; and the executive director of the Massachusetts office
of travel and tourism, or their designee, who shall serve as chair of the commission.

The commission shall examine ways to increase promotion of and visitation to restaurants operating in
the commonwealth, including but not limited to: challenges to maintaining and operating restaurants,
including issues related to the training, development and retention of the industry’s workforce; barriers to
establishing new restaurants; licensing and permitting issues impacting emerging business models;
strategies for increased marketing to attract visitors to the commonwealth’s restaurants; and strategies
for cross-promotional partnerships, including but not limited to partnerships with the hospitality,
agriculture and seafood industries. The commission shall consider successful programs and national and
local best practices.

The commission shall recommend programs for the use of the funds available in item 7008-1024. The
commission shall hold its first meeting not later than 30 days after the effective date of this act and shall
meet not less frequently than monthly thereafter. The commission shall hold meetings in various
geographic regions of the commonwealth. The chair of the commission shall work to facilitate information
and data requests of the commission members, ensure that the work of the commission incorporates
feedback from the industry statewide and coordinate interagency cooperation. The commission shall
submit a report of its review and its recommendations, if any, together with drafts of legislation necessary
to carry those recommendations into effect by filing the same with the clerks of the house of
representatives and the senate not later than January 31, 2020.

The legislature subsequently amended this session law on two occasions:

    1) Chapter 142 of the Acts of 2019:
       SECTION 81. Subsection (c) of section 2 of chapter 49 of the acts of 2019 is hereby amended by
       striking out the words “January 31, 2020” and inserting in place thereof the following:- March
       16, 2020.

    2) Chapter 124 of the Acts of 2020:
       SECTION 78. Subsection (a) of section 2 of chapter 49 of the acts of 2019 is hereby amended by
       striking out, each time it appears, the word “promotion”, and inserting in place thereof, in each
       instance, the following words:- promotion and recovery.
       SECTION 79. Subsection (c) of said section 2 of said chapter 49 is hereby amended by striking
       out “March 16, 2020”, inserted by section 81 of chapter 142 of the acts of 2019, and inserting in
       place thereof the following:- December 1, 2020.

                                                     2
Massachusetts Restaurant Promotion Commission
State Senator Julian Cyr

Tiffani Faison, Owner, Big Heart Hospitality

Rebecca Gullo, Owner, The Gallows Group

Chris Jamison, CEO, COJE Management Group

State Senator Edward Kennedy

Pat Lee, Owner, Horseshoe Grille

Bob Luz, President/CEO, Massachusetts Restaurant Association

State Representative Paul McMurtry

Keiko Matsudo Orrall, Chair of the Commission and Executive Director, Massachusetts Office of Travel and
Tourism

Kathi Turner, Owner and CFO, Turner’s Seafood

Ted Twinney, Owner, Start Line Brewing Co.

                                                   3
DISCLAIMER: Please know the commission drafted this report in early 2020 in line with the statutory
    charge ahead of March 2020 deadline. This report does not contemplate the previously imaginable
                            disruptions caused by the COVID-19 Pandemic.

Executive Summary
The Massachusetts Legislature established in July 2019, pursuant to Chapter 49 of the Acts of 2019, the
Massachusetts Restaurant Promotion Commission with the stated mandate “to review and develop
recommendations and best practices for the promotion and continued growth and vitality of the
restaurant industry in the Commonwealth.”

This report is the culmination of the Commission’s extensive work over a six month period that
incorporates learnings from the eight Commission meetings across the Commonwealth (from October
2019 through March 2020), individual interviews with all 11 commissioners, more than 20 interviews with
restaurant operators, state and local regulatory agency representatives, food service supplier executives,
and various industry advocacy groups, a statewide anonymous online survey of Massachusetts restaurant
customers 1 , employees 2 , owners and operators 3 , six focus groups conducted with 39 restaurant
representatives from six different regions of the State, and comprehensive industry research and data
analysis on the restaurant industry.

As mandated by the session law, the report examines barriers to establishing new restaurants, identifies
challenges to maintaining and operating restaurants, and provides recommendations for consideration
including legislative changes and strategies for more effective promotion of Massachusetts restaurants.

Restaurants are an integral part of the economic and social fabric in both the U.S. and the Commonwealth.
Massachusetts has recently witnessed closings of highly-visible restaurants, such as L’Espalier and Durgin
Park, and Top of the Hub announced that it would close its doors in April 2020. The net change in the
number of Massachusetts restaurants was negative in 2018 for the first time since 2011, with 76 net
closings, and the seven-year compounded annual growth rate of Massachusetts restaurants from 2011 to
2018, at 0.75%, was below the national average compounded annual growth rate of 2.0% over the same
period4.

The below-average restaurant growth trend stands out given the overall health and growth of
Massachusetts economy. Furthermore, a survey of Massachusetts restaurant customers across the State
that inquired about restaurant food quality, service, and atmosphere indicates that customer satisfaction
is high. More than 90% of survey respondents attested that restaurants in Massachusetts were on par
with or better than those in comparable locations in other states5.

Evidence from subject matter interviews, focus groups, online surveys, and industry research converges
on three key findings and their respective drivers that shed light on the root causes of below-average
growth of restaurants in Massachusetts:

1
  RPC Customer Survey sample size: 415
2
  RPC Employee Survey sample size: 186
3
  RPC Owner and Operator Survey sample size: 128
4
  Analysis of Bureau of Labor Statistics data (see NAICS code 72251)
5
  RPC Customer Survey

                                                         4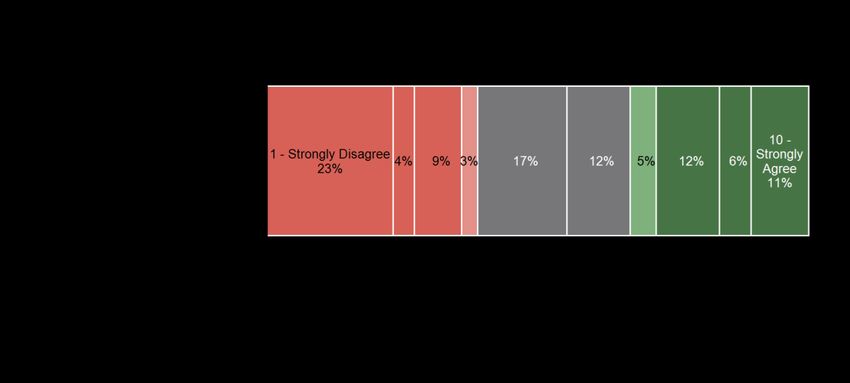
1. The restaurant industry in Massachusetts, in alignment with national trends, is in a transition
period that is defined by downward pressure on restaurant profitability.
This transition period is characterized first by a shift in demographics and an ensuing
change in customer preferences: millennials are the largest segment of the U.S.
population as of 2019 6 , and they exhibit particular preferences in their food choices,
which, in the short-term, reduce restaurant operating margins. For example, millennials
are more likely to order restaurant delivery7. In turn, delivery services, when provided by
a third party, dampen restaurant profitability as food delivery app companies charge on
average 15% to 30% of the overall check amount8. Furthermore, millennials’ preference
for natural and locally-sourced ingredients increases food costs at restaurants, as
evidenced by a 2019 industry survey9.
Changes in restaurant customer preferences enable non-restaurant competitors to enter
the industry and, as a result, reduce overall profitability. As mentioned previously, food
delivery app companies are the clear beneficiaries of the change: online food delivery
revenue nationally is projected to grow at a compounded annual growth rate of 5.8%
from 2019 to 2024 10 , growing faster than on-site consumption. Furthermore,
supermarkets and grocery stores offering prepared food and addressing the convenience
trend compete increasingly with restaurants on customer share of wallet: in-store dining
and takeout of prepared foods from grocers grew nearly 30% from 2008 through 201511.
Workforce-related legislation approved in Massachusetts over the past six years also
impacts profitability. Analysis suggests that the estimated impact of the Employer
Medical Assistance Contribution, Earned Sick Time, Minimum Tipped Wage and Paid
Family Medical Leave regulations on a 50-seat restaurant is a reduction of 1-2% in
operating margins by 2023. Considering that the 2018 national median operating margin
for a restaurant in the U.S. is only 6%12, this reduction is equivalent to 15-35% of the
median bottom line.
The customer preference changes identified above and the resulting increase in
competition coincide with a historically low unemployment rate in Massachusetts
(2.9%)13. The tight labor market further compounds the negative impact on restaurant
profitability. Limited workforce availability and workforce skill shortages negatively
impacted 81% and 70% of restaurant owners’ operations, respectively (scores 1-3 on a
10-point scale)14. It should be noted that the national employee turnover rate for the food
service sector is at 75%15. Massachusetts restaurant employee survey respondents also
6
Pew Research Center tabulations of U.S. Census Bureau population projections released Dec 2014 and 2016
population estimates
7
RPC Customer Survey; 2019 State of the Restaurant Industry, National Restaurant Association
8
“Restaurants are Arm-Twisting Delivery Companies to Lower Fees”, Wall Street Journal, June 23, 2019
9
RPC Owner and Operator Survey; Owner and Operator Focus Groups
10
Statista
11
Information Resources Inc. (IRi) industry research
12
National Restaurant Association, 2018
13
Bureau of Labor Statistics. Note: the unemployment rate is projected to be 2.8% in December 2019
14
RPC Owner and Operator Survey
15
Bureau of Labor Statistics, 2018
5
cited poor management, compensation, and limited advancement opportunities as
drivers of attrition16.
Quickly rising rental costs, particularly in metropolitan areas, are the fifth factor identified
contributing to declining industry profitability. For example, at a time when the Consumer
Price Index was at 2.1% in Boston (2019)17, rental rates per square foot rose 12% from Q2
2018 to Q4 2019, outpacing the equivalent increases in Chicago and Los Angeles18. The
increase in rental costs implies a commensurate reduction in margin for restaurateurs
who do not own their own commercial real estate spaces.
2. Various regions of the State experience this transition period differently and the impact on
certain counties is more severe than on others.
Seven counties recorded net closings of restaurants from 2017 to 2018: Essex, Hampden,
Norfolk, Berkshire, Bristol, Barnstable and Hampshire counties19.
A cluster analysis of counties with net closings against the remaining seven counties with
net openings over the same period indicated that the cluster of net-negative counties are
less populous, have lower population growth rates, lower population densities and
slightly lower median household incomes.
Demographic shifts may not be reversible. As visitors also boost demand for restaurants,
it is important to explore the potential impact of visitor spending on the industry. A by-
cluster comparison of 2018 visitor spending in these two groups indicated that net-
negative counties have generated on average only 35% of the average tourist spending
generated by net-positive counties20. These findings are also supported by focus group
input from restaurant operators in six regions of the State21.
3. It is challenging for a small business owner to start a restaurant in Massachusetts.
Specific barriers to opening a restaurant in Massachusetts include limited access to capital
for first-time operators, rising construction costs, and complex licensing and permitting
processes. These barriers also limit innovation in the industry as they prevent
entrepreneurs from testing their innovative ideas in an affordable manner.
Only 9% of restaurant operator survey respondents strongly agreed that it was easier to
open a new restaurant in Massachusetts now than it was when they started their business
and less than one third (29%) agreed or strongly agreed that it was easier to access
funding now for a restaurant than it was five years ago 22 . Similarly, focus group
participants stated that banks are often unwilling to lend to restaurants and that aspiring
restaurateurs in Massachusetts are dependent on personal funds to launch their
enterprises23.
16
RPC Employee Survey
17
Bureau of Labor Statistics, Consumer Price Index data
18
United States Office Outlook Reports, JLL (commercial real estate firm)
19
Bureau of Labor Statistics, 2017-2018
20
The Economic Impact of Travel on Massachusetts Counties 2018, MOTT report
21
Owner and Operator Focus Groups
22
RPC Owner and Operator Survey
23
Owner and Operator Focus Groups
6 Rising construction costs constitute an additional barrier to opening a new restaurant in
Massachusetts. Boston, for example, now ranks as the sixth most expensive U.S. city in
which to build24.
Lastly, state and local licensing and permitting processes are currently not streamlined.
Supporting this finding, almost 90% of restaurant operator respondents disagreed that
the licensing process required to open and maintain a restaurant was straightforward and
efficient25. In contrast, for example, New York City and Washington, D.C. either provide
online portals to facilitate such processes or offer accelerated processing to alleviate the
complexity associated with regulatory requirements.
To mitigate the impact of these key findings where possible, recommendations for consideration based
on direct input from industry subject matter experts are provided below:
Short-Term Recommendations
Consider conducting studies to inform future legislative changes facilitating the transition
period for restaurants, evaluating potential impacts of recent workforce legislation on industry
operating margins, and exploring innovative wage models to expand the workforce pool.
Streamline licensing and permitting processes statewide potentially partnering with
municipalities to establish a statewide online portal to centralize relevant information on
requirements for applicants and encouraging local authorities to opt-in to such a model.
Explore options to reduce operating costs for restaurants, including evaluating credit card
service fees, enabling tip pool sharing between ‘front of the house’ and ‘back of the house’
employees, and other measures to enable restaurants to equally compensate staff, such as tax-
exempt check surcharges for ‘back of the house’ employees.
Foster effective marketing of the restaurant industry and increase traffic to restaurants, by
inviting to Massachusetts globally-recognized restaurant reviewers such as the Michelin Red
Guide. The Massachusetts Office of Travel and Tourism could assist in such an effort as part of its
ongoing travel and tourism economic development mission.
Longer-Term Recommendations
Make it easier for restaurants to hire and retain their workforce, potentially including
encouraging closer collaboration between the industry and academic institutions with culinary
programs (building on on-going efforts such as the Career Technical Initiative) and evaluating the
potential benefits associated with employee loyalty programs and employee ownership models.
Improve awareness across the restaurant industry on key matters impacting industry viability,
potentially including forming an industry-wide consortium of stakeholders such as restaurant
operators, supplier advocacy groups, and regulatory agencies to address rising supply chain and
marketing costs, and better leveraging the collective purchasing power across the industry.
24
R.S. Means Construction Cost Data, analyzed by BuildZoom
25
RPC Owner and Operator Survey
7 Enhance operator business acumen and encourage innovation to establish and test new
restaurant models addressing changes in consumer behavior by potentially developing an online
“Restaurant MBA 101” training program to educate current restaurant owners and aspiring
restaurateurs on the organizational, financial, and operational challenges in the industry,
encouraging entrepreneurs in the restaurant industry to develop, test, and establish innovative
models that could address shifting customer preferences, workforce shortages, and rising
operating costs, and expanding mentorship programs targeted at first-time restaurant owners
and operators to increase their likelihood of success.
8Methodology
Commission Meetings: 10/15/19 Boston, 11/26/19 Newton, 12/17/19 Boston, 1/6/20 Holyoke,
1/28/20 Lowell, 2/11/20 Worcester, 2/24/20 Dennis, 3/9/20 Boston, and 3/16/20 Boston.
Interviews with Commissioners: Senator Julian Cyr; Tiffani Faison, Owner, Big Heart Hospitality;
Rebecca Gullo, Owner, The Gallows Group; Chris Jamison, CEO, COJE Management Group; Senator
Edward Kennedy; Pat Lee, Owner, Horseshoe Grille; Bob Luz, President/CEO, Massachusetts
Restaurant Association (MRA); Representative Paul McMurtry; Keiko Orrall, Executive Director,
Massachusetts Office of Travel and Tourism (MOTT); Kathi Turner, Owner and CFO, Turner’s Seafood;
and Ted Twinney, Owner, Start Line Brewing Co.
Interviews with Subject Matter Experts: We interviewed numerous individuals with expertise relating
to the restaurant industry, including Annie Thompson, Budget Director, Executive Office of Housing
and Economic Development (EOHED); Benita Oehlke, Program Coordinator, Department of
Agricultural Resources (DAR); Beth Casoni, MA Seafood Marketing Commission; Bill Kelly, Former
General Counsel, Alcoholic Beverages Control Commission; Brad Mitchell, Deputy Executive Director,
Massachusetts Farm Bureau Federation; Bruce Grindy, Vice President and Chief Economist, NRA;
Charlie Perkins, Founder, The Boston Restaurant Group; Daniela Decaro, Special Projects Manager,
MOTT; Kathleen Joyce, Chairwomen, Boston Licensing Board; Kaitlin Passafaro, Director of Policy,
Mayor’s Office of Economic Development (OED); Kim Thai, Director of Policy, Boston Inspectional
Services Department (ISD); Lesley Hawkins, Executive Secretary, Boston Licensing Board; MaryAnn
McHugo, Office Manager, Boston Fire Department; Mary Jordan, Director, Division of Agricultural
Markets; Ralph Sacramone, Executive Director, Alcoholic Beverages Control Commission; Rory
O’Hanlon, Legislative Director and Deputy Director of Policy, EOHED; Steve Clark, VP Government
Affairs, MRA; Suzanne Condon, Former Associate Commissioner, Department of Public Health (DPH);
Taylor Connolly, Communications Manager, OED; and Tonia Scalcione, Director of External
Affairs/Regulatory Ombudsman, EOHED, Chuck Fraser and Steven Cifrino, Sysco; Richard Querci, US
Foods, Joe Milano, UOH.
Anonymous Online Surveys: We fielded three surveys and analyzed the responses of the
Massachusetts Restaurant Customer Survey (Sample size as of 2/24/20: 399); Massachusetts
Restaurant Employee Survey (Sample size as of 2/24/20: 157); and Massachusetts Restaurant
Owner/Operator Survey (Sample size as of 2/24/20: 102).
Focus Groups: We conducted six focus groups across the Commonwealth comprised of 39
participants. These meetings were held in Boston, North Reading, Northampton, Worcester,
Hopkinton, and Plymouth. A seventh focus group in Nantucket was facilitated by Senator Cyr.
Research and Benchmarking: We conducted extensive research, reviewing and analyzing documents
and data including the National Restaurant Association (NRA) 2019 Technology Report, NRA
Restaurant Operations Report 2016, Occupational Employment Statistics (OES) Wage and
Establishment Statistics, State of the Restaurant Industry 2019 report, MA Restaurant Industry at a
Glance 2018, An Act to Create Economic Vitality in Boston Neighborhoods, 2019 Restaurant Success
Report, NYC Permitting and Licensing Division Documents, Chicago Liquor License Guide, San
Francisco Liquor License Process Handout, US Retail Industry Outlook 2020, Intrix Most Congested
Cities Analysis, The Boston Globe articles, US Census Data, Statista Delivery Companies Report, Bureau
of Labor Statistics data, Statista Data and Reports, NRA Restaurant Industry 2030 Report, MA
Department of Revenue (DOR) data, Bureau of Economic Analysis (BEA) data.
9Background
Restaurants are an integral part of the economic and social fabric in both the U.S. and the Commonwealth.
The National Restaurant Association (NRA) estimated that the U.S. restaurant industry employed 15
million individuals in 2019 and that restaurant sales reached almost $900 billion accounting for 4% of the
U.S. GDP26. In Massachusetts, the equivalent numbers were nearly 250,000 individuals employed27, with
the industry accounting for more than 3% of the state GDP28 and generating more than $1 billion in sales
taxes and $140M in local option meal taxes.29
According to the Bureau of Labor Statistics (BLS), the number of restaurants and other eating places in the
U.S. (NAICS code 72251) increased at a compounded annual growth rate (CAGR) of 2.0% from 2011 to
2018. The equivalent growth rate in the same period for Massachusetts and the other states is as follows:
The Massachusetts restaurant industry, along with those of other New England states except Connecticut,
recorded a below-average location growth, with a CAGR of 0.75% in this period.30 Over the same period,
the Massachusetts restaurant industry employment growth (CAGR) also slightly underperformed the
national average, growing 2.6% versus 3.0% nationally. In contrast, state industry real wage growth at
5.3% (CAGR) was slightly higher than the national average of 5.0%.
This legislative report analyzes the following two key questions:
1. What are the root causes of below-average restaurant growth in Massachusetts?
2. What could be done to address this trend (i.e. recommendations)?
26
National Restaurant Association
27
Bureau of Labor Statistics data
28
2019 State of the Restaurant Industry, National Restaurant Association
29
DOR Local Options Meal Tax Data, FY16-FY19
30
Furthermore, from 2017 to 2018, the net change in the number of Massachusetts restaurant locations was
negative for the first time since 2011, with 76 net closings.
10Analysis
This report documents the root causes of below-average growth in Massachusetts from four different
perspectives: restaurant customers, owner and operators, employees, and regulators in the industry. It
also incorporates the perspectives of restaurant suppliers and supplier advocacy groups in the
Commonwealth.
Based on the study, the major root causes have been grouped into three key findings. The first two key
findings identified are relevant to both operating an existing restaurant and opening a new operation,
while the third is focused primarily on starting a restaurant business:
I. Across Massachusetts, as elsewhere in the U.S., the restaurant industry is undergoing a transition,
driven primarily by changing customer preferences. This transition places downward pressure on
restaurant profitability. Additional factors affecting restaurant profitability include new non-
restaurant entrants into the industry, a tight labor market and high employee turnover rates,
recently introduced workforce regulation, and quickly rising rental costs, particularly in
metropolitan areas.
II. The trends identified above are affecting certain regions in the Commonwealth
disproportionately, and have resulted in net closing of restaurants in recent years, particularly in
counties with smaller population sizes, below-average population growth, low population density,
lower-than-average annual median household income, and relatively low visitor spending.
III. It is challenging for a small business owner to start a restaurant in Massachusetts. Specific barriers
include limited access to capital for first-time operators, rising construction costs, and complex
licensing and permitting processes.
11Key Finding #1: Industry Profitability Headwinds
A 2016 NRA industry report estimated that the median operating margin for a full-service restaurant was
only 6% nationally.31 Overall profitability in the Massachusetts restaurant industry has been declining for
the past 3-5 years. This perspective was confirmed by both participant feedback in the restaurant owner
focus groups across the state as well as by respondent input in the anonymous online restaurant
owner/operator survey.
More specifically, one focus group participant summarized his view on declining profitability by stating
that “years ago, my profit margins were around 24% and now I’m at 6%.” Supporting this view, only 29%
of respondents in the online restaurant owner survey strongly agreed with the statement that “my
business is healthier and more profitable now than it was five years ago” (scores 8-10 on a 10-point scale).
It is important to note that the Massachusetts economy has exhibited solid growth over the past 3-5 years
and GDP growth rates do not explain lower industry profitability.32
To analyze the drivers of declining industry profitability, an evaluation tested whether there was a
structural or a systemic customer satisfaction issue in the Massachusetts restaurant market:
31
Restaurant Operations Report 2016 Edition, NRA and Deloitte
32
US Bureau of Economic Analysis data, 2000 to 2018
12The 2018 industry composition in Massachusetts, based on Bureau of Labor Statistics data, is comparable
to the national industry composition, refuting the hypothesis of a possible structural cause.
Of equal importance, Massachusetts restaurant patrons indicated in the anonymous online survey of
restaurant customers that they are satisfied with the restaurant service, atmosphere, and food quality
they receive at state restaurants:
81% agree or strongly agree they are satisfied with the service they receive in restaurants
they frequent
75% agree or strongly agree they are satisfied with the atmosphere of the restaurants
they frequent
79% agree or strongly agree they are satisfied with the quality of food they receive in
restaurants they frequent.
93% of customers indicate restaurants in Massachusetts towns and cities are on par with
or better than those in comparable locations in other states
13 88% of customers believe Boston’s restaurants are on par with or better than those of its
peer major cities
That said, it is important to highlight that nearly half of survey respondents do not indicate satisfaction
with the prices at the restaurants they frequent, a finding indirectly confirming concern about rising costs
in the industry.
If potential structural or customer satisfaction issues do not explain declining industry profitability either,
what other factors may be contributing to this trend? Five elements were identified that have been
leading to lower profit margins at Massachusetts restaurants, most of which are consistent with national
trends, and, in the aggregate, place significant downward pressure on restaurant operating margins:
1. Changing customer preferences,
2. New non-restaurant entrants into the restaurant industry,
3. A tight labor market and high employee turnover rates,
4. Recently introduced workforce regulation,
5. Quickly rising rental costs, particularly in metropolitan areas.
141. Changing customer preferences
According to the U.S. Census Bureau, as of 2019, millennials constitute the largest segment of the
U.S. population.33
This new largest segment of the population exhibits particular preferences, which, in the short-
term, negatively impact restaurant profitability:
Millennials place greater emphasis on convenience than previous generations. Specifically, 55%
of millennials cite convenience as a top driver in their food purchase decisions. Moreover,
millennials indicate they are more likely to order restaurant delivery now compared to two years
ago,34 a trend also confirmed in the customer survey. This increased interest in convenience opens
the door to new non-restaurant entrants into the industry, such as food delivery app companies,
which in turn dilute restaurant margins in this market transition period. To illustrate, in the
restaurant operator survey, 71% of respondents indicated that the proliferation of food delivery
apps did not have a positive impact on their business (score of 5 or lower on a 10-point scale).
Millennials also show a preference for natural, local, and sustainable ingredient sourcing, as
voiced by many of the restaurant owner focus group participants across the state35. While these
food preferences enable Massachusetts restaurants to offer a more varied menu to their patrons,
they drive food ingredient costs upward, as also evidenced by a 2019 industry survey in which
more than half of restaurants owners singled out rising food costs as a major challenge facing the
industry36.
Finally, millennials rely extensively on social media for sharing their views with their peers. As the
restaurant operator focus group participants indicated consistently, while positive restaurant
reviews on social media platforms may be helpful in marketing their operations, addressing
negative reviews and maintaining an online brand presence often necessitates the deployment of
a full-time resource, translating into additional expense, further eroding operating margins.
33
Pew Research Center tabulations of U.S. Census Bureau population projections released Dec 2014 and 2016
population estimates
34
2019 State of the Restaurant Industry, National Restaurant Association
35
RPC Owner and Operator Survey; Owner and Operator Focus Groups
36
Restaurant Success in 2019 Industry Report, Toast, Inc.
152. New non-restaurant entrants into the restaurant industry
As illustrated in the previous section about changing customer preferences, millennials’ increased
focus on convenience invites new entrants to the restaurant industry, that directly compete with
existing restaurants for customer share of wallet and profit margins. The restaurant focus group
participants identified food delivery companies and grocers with prepared food departments as
relatively new competitors impacting their profitability.
Multiple third-party food delivery companies started their operations in the 2013-2015 timeframe.
Online food delivery revenue nationally is projected to grow at a CAGR of 5.8% from 2019 to 2024,
according to Statista, rising faster than on-site consumption revenue. While at first sight, this trend
may imply a positive impact on overall restaurant sales, three aspects of online food delivery (when
executed by third party players) suppress industry profitability:
First, food delivery companies typically require a 15%-30% share of the overall check for their
services.37 This is a burdensome impact for an industry operating at a median margin of 6% as
mentioned above. Secondly, online food delivery orders typically exclude beverages, particularly
alcoholic beverages, a source of higher margins for on-site consumption.38 This exclusion further
erodes the restaurant bottom line. Finally, online food delivery orders eliminate the contribution of
tip income to the restaurant workforce. While it is fair to assume that restaurant owners will align
their workforce levels with an increase in off-site consumption over time, in the short run, the
immediate impact of lower tips on restaurant operating margins are negative.
In addition to competition from food delivery companies, restaurants are increasingly facing
challenges from supermarkets and grocery stores offering prepared foods. Nearly 80% of US
consumers made a purchase from the deli prepared foods department in 2018, worth $12.5B in
sales, and in-store dining and takeout of prepared foods from grocers has grown nearly 30% from
2008 to 2015.39 Moreover, supermarkets’ share of revenue from prepared foods has been rising
recently. Nielsen reported that prepared foods led grocer’s categories in sales growth, at 140% in
2017.40 This evolution of supermarket sales is a direct response to millennials and other shoppers
37
“Restaurants are Arm-Twisting Delivery Companies to Lower Fees”, Wall Street Journal, June 23, 2019
38
Restaurant Operations Report: 2016 Edition, Deloitte and National Restaurant Association
39
Information Resources Inc. (IRi) industry research
40
Progressive Grocer July 2018
16seeking convenience around their food choices, which places downward pressure on restaurant
revenue and consequently on industry margins.
3. A tight labor market and high turnover rates
According to BLS, unemployment in Massachusetts, at 2.9%, is currently at its lowest level since
December of 2000, nearly two decades41. While this is a positive trend from the perspective of the
Commonwealth’s economy, this record-low unemployment results in a tight labor market and
drives up workforce costs for employers including restaurants.
Specifically, in its 2019 survey of restaurant owners, the NRA identified hiring (and training) as major
challenges facing the industry. 42 Similarly, in the survey of Massachusetts restaurant operators,
more than 81% of respondents indicated that workforce availability had a severely negative impact
on their operations (defined as a score of 1-3 on a 10-point scale).
In the same survey, 70% of operators also expressed that shortages of skilled workforce were
severely hurting their businesses (scores 1-3). According to the NRA, the biggest recruiting challenge
is finding applicants for “back-of-the-house” positions including chefs, cooks, and other culinary
staff.43
These workforce trends are also impacted by growth in gig economy44 jobs as illustrated in the chart
below. Intuit estimates 34% of working Americans participated in the gig economy (including
traditional freelancers) in 2016, and projects an increase to 43% by 2020.45 In 2016, nearly one-
quarter of Americans reported earnings from the “digital platform economy” during the previous
year.12 One of the restaurant operators who took part in the focus groups highlighted that “we lose
many employees to Uber and Lyft,” employment opportunities that did not exist as explicitly prior
to the proliferation of the gig economy. Customers responding to the consumer survey also
recognized this trend, stating that “a server can just walk out the door and get comparable work.”
41
Bureau of Labor Statistics, unemployment rate 12/2000 – 12/2019
42
2019 State of the Restaurant Industry, National Restaurant Association
43
2019 State of the Restaurant Industry, National Restaurant Association
44
Defined by The Oxford Dictionary as a labor market characterized by the prevalence of short-term contracts or
freelance work as opposed to permanent jobs.
45
“Intuit: Gig economy is 34% of US workforce”, Patrick Gillespie, CNN Money, May 2017
17Low unemployment, limited culinary skill availability, and competing employment opportunities created
by the gig economy all converge and drive turnover rates in the industry, estimated at 75% in 2018,
according to data from the Bureau of Labor Statistics’ Job Openings and Labor Turnover (JOLTS) program.
On another note, the anonymous online restaurant employee survey revealed that Massachusetts
restaurant staff across the state identified poor management, inadequate compensation, and limited
advancement opportunities as the top three drivers of high employee turnover in restaurants. Restaurant
employee respondents also emphasized that the labor pool does not currently perceive the restaurant
industry to provide a long-term career path: “Turnover is due to the perception that it’s not a career and
is typically a second job.” Another respondent mentioned that working in restaurants is “not looked at as
a career anymore,” and another reported that there is “a general downshift in desire to provide true
hospitality.”
In addition to low unemployment and an increasingly competitive market to attract workforce talent for
restaurants, employees cite limited housing (especially on Cape Cod) and transportation availability as
compounding causes of churn: “a combination of rising cost of living and insufficient public transportation
are among the many factors that contribute to this issue [attrition].” Similarly, restaurant operator focus
group participants on Cape Cod and the Islands highlighted affordable housing for workforce as a major
barrier in their operations.
184. Recently introduced workforce regulation
Over the past six years, the Massachusetts approved new workforce-related legislation including:
Employer Medical Assistance Contribution in 2014
Earned Sick Time in 2015
Minimum Wage and Minimum Tipped Wage in 2018
Paid Family Medical Leave Law in 2019
Analysis suggests that the impact of these regulations over the next three years will be a reduction
of 1-2% in operating margins, equivalent to 15-35% of the bottom line on average. This impact is
echoed by restaurant operator input in the survey, with 80% of respondents indicating that both
minimum wage and tipped minimum wage regulations as well as other workforce benefits
legislation will severely negatively (scores 1-3) impact their operations.
Restaurant operators who participated in the focus groups attested that workforce cost changes
have directly impacted operational decisions from shifting operating hours to reducing staffing.
Respondents to the customer survey also acknowledged the potential implications of workforce
cost changes on restaurants, with one respondent suggesting that “the $15 per hour minimum wage
will close a lot of smaller mom and pop shops.”
195. Quickly rising rental costs, particularly in metropolitan areas
In addition to rising food-ingredient, workforce, and turnover costs, rental costs increasingly constitute a
significant financial burden, particularly for restaurant operations based in metropolitan areas. Research
indicates that rental costs in metropolitan areas have been rising. For example, Boston, along with New
York City and San Francisco, has seen a double-digit (12%) increase in per-square foot rental cost over the
past year and a half as illustrated below:46
This rental cost increase is much faster than the 2019 CPI increase in the Boston metropolitan area (2.1%)
and places significant margin pressure on those restaurateurs who do not own their own commercial
spaces.47 While primarily observed in metropolitan areas, this trend is not applicable to only Boston and
Worcester. Restaurant operator focus group participants in Western Massachusetts and the North Shore
also voiced concern about rental cost increases.
46
United States Office Outlook Reports, JLL (commercial real estate firm)
47
Bureau of Labor Statistics, Consumer Price Index data
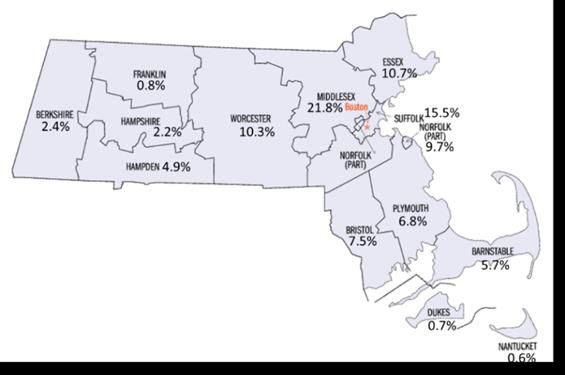
20Key Finding #2: Disproportionate Regional Impact
According to 2018 BLS data, the distribution of 13,702 restaurant and eating locations in Massachusetts
by county is as follows:
The five profitability factors captured in Key Finding #1 above appear to impact restaurants across the
state disproportionately. Again, according to 2017-2018 BLS data, in seven Massachusetts counties, the
net change in the number of restaurants was negative, equivalent to a reduction of 1% to 5% in restaurant
volume in these regions as illustrated below:
21To determine the potential factors correlated with net openings and closings across the state, a cluster
analysis was conducted in which the seven counties with net openings and the remaining seven with net
closings from 2017 to 2018 were grouped separately. For these two clusters, average population growth
(2010-2018), average population density per square mile, average median household income, and
average population were compared based on U.S. Census data. The findings are summarized in the chart
below:
The average population in counties with a net-negative change was 433K, whereas in the
remaining counties it was 28% higher at 553K.
In the net-negative counties, the average population growth was 1.9%, 5.3% slower than the
equivalent growth in the other seven net-positive counties.
On average, the median household income in net-negative counties was $9,396 less than the
median household income in net-positive counties.
Also, compared to the net-negative counties, the net-positive counties were 2.9x more densely
populated.
As tourist spending constitutes a significant part of income in the food and hospitality industry, in addition
to these demographic trends, an analysis of average annual visitor spending by county based on data from
the Massachusetts Office of Travel and Tourism (MOTT) indicates that the average 2018 visitor spending
captured by MOTT for the counties with a net-negative change was $700 million, only 35% of the average
spend of $2.1 billion across the seven counties with a positive net change.48
Based on this comparative analysis, it becomes clear that population size, growth, density, median
household income, and average visitor spending are correlated with customer demand and indirectly
affect restaurant closings. It is important to emphasize that demographic trends not only drive restaurant
demand but also impact the industry’s ability to hire in a tight labor market, a key factor impacting
profitability as explained previously. Supporting this observation, many of the focus group participants
from Western Massachusetts and Cape Cod re-iterated the limitations that a shrinking population in these
regions place on their ability to recruit and to grow their businesses. Many of them, particularly from
Cape Cod, emphasized their reliance on workers with H-2B and J-1 visas to make up for workforce
shortages in their often seasonal operations.
48
The Economic Impact of Travel on Massachusetts Counties 2018, MOTT report
22Key Finding #3: Barriers to Opening a Restaurant
Massachusetts is home to the nation’s oldest continuously operating restaurant. Restaurants have
historically been a relatively low-barrier-to-entry field in which higher education and other resources were
not prerequisites to success and one’s passion to cook and serve were rewarded. Yet as one of the
restaurant operators focus group participants stated, “passion and strong work ethics are no longer
sufficient to start and succeed in the restaurant business.” Similarly, a respondent in the restaurant
employee survey commented that “it is a difficult industry. Even in places with good management and
strong earnings, you have to be on your feet all the time.”
The median start-up cost for a restaurant nationally is nearly $400,000 today (53% construction, 25%
equipment, 22% other pre-opening expenses), excluding liquor license costs, which, in some
municipalities, may more than double this start-up estimate.49 The challenges associated with opening a
new restaurant in Massachusetts are illustrated by the findings below from the restaurant owner and
operator survey:
Only 36% of respondents strongly agree (scores 8-10) that the business climate in Massachusetts
for restaurants has improved over the past five years.
Only 9% strongly agree (scores 8-10) that it is easier to open a new restaurant now than it was
when they started their business.
Only 6% strongly agree (scores 8-10) that it is easier to maintain a restaurant in Massachusetts
now than it was when they started their business.
Given these sentiments, the following data from the same survey shed light on potential barriers to
opening a new restaurant in Massachusetts:
Only 15% of respondents strongly agree (scores 8-10) that it is easier to access funding now for a
restaurant business than it was five years ago.
Only 10% strongly agree (scores 8-10) that the licensing process required to open and maintain a
restaurant is straightforward and efficient.
49
Independent Restaurant Cost to Open Survey by RestaurantOwner.com
23 And a mere 6% of respondents strongly agree (scores 8-10) that the Legislature in Massachusetts
fully understands the issues facing the restaurant industry and is proactively addressing them.
In this section, the report builds on these observations and elaborates on three specific barriers to opening
a new restaurant in Massachusetts, in addition to declining industry profitability as described in Key
Finding #1 above:
1. Limited access to capital, particularly for first-time entrepreneurs;
2. Rising construction costs; and
3. Complex licensing and permitting processes.
1. Limited access to capital, particularly for first-time entrepreneurs
As the authors of the 2020 Zagat NYC survey state: "In the restaurant world, few entities last a decade.
Even fewer last several decades.” Given the high closing rates in the industry, it is not surprising that
lenders have always been reluctant to fund new restaurant operations, particularly for aspiring
restaurateurs. Participants in the restaurant operator focus groups comment on this topic:
“Banks don’t lend to restaurants often, especially if it’s your first restaurant, or you don’t already
have a successful concept out there.”
“If we hadn’t had a family loan to get our feet in the door, I truly don’t know how we would have
done it.”
“How can we entrepreneurs opening independent or homegrown restaurants compete with large
national chains, especially when I pay hundreds of thousands for a liquor license next to a
restaurant in a developer-led property with an umbrella liquor license and differential ability to
compensate employees?”
An aspiring restaurateur in Massachusetts today is almost entirely dependent on personal or family and
friend financial resources.
242. Rising construction costs
As illustrated below, U.S. real construction costs in cities have been rising expeditiously since 2010. To
make matters worse, Boston is 14% more expensive than the average U.S. city in which to build, ranking
number six on a list of most expensive cities.50
Supporting this finding, the operator focus group participants observe:
“The cost of buildout is astronomical.”
“The cost per square foot to build a new venue is outrageous.”
“It takes you almost as long as your lease to pay off the start-up costs.”
Admittedly, constructions costs are market-driven and may not be actionable. Yet, educating aspiring
restaurateurs on the implications of this trend may minimize failure rates in the long run.
3. Complex licensing and permitting processes
In Massachusetts, licensing and permitting for restaurants is controlled primarily by local authorities. The
main observations on this topic are listed below:
There is considerable variability in licensing and permitting requirements across the state. For
example, the City of Boston may require more than a dozen permits to open a restaurant
depending on the type of restaurant while other cities have less onerous requirements.
These varying requirements across localities are typically not well-documented and not
streamlined. In contrast, as an example, New York City and Portland, ME provide both a well-
crafted road map and an online portal for a more user-friendly application and renewal process.
Similarly, Barnstable County in Massachusetts has a step-by-step guide and a streamlined
permitting process that could constitute the basis of statewide standardization.
50
R.S. Means Construction Cost Data, analyzed by BuildZoom
25 At any particular local level, multiple entities have authority regarding license requirements, and
these entities do not always communicate effectively, creating additional challenges for
applicants.
Certain licenses are prohibitively costly. In particular, liquor licenses in localities with license caps
constitute a significant barrier to entry. This has made liquor license changes contentious as
devaluing licenses through new regulation would have an adverse effect on current licensees.
Currently, a fair hearing process that could mediate disagreements between applicants and
approving authorities is not in place.
These three barriers, in aggregate, limit the ability of new businesses to mitigate their start-up risks and
build new and innovative restaurant models. Standardizing the licensing and permitting processes across
the State would have a beneficial impact on the restaurant industry.
26Draft Recommendations for Consideration
The Massachusetts restaurant industry has been adjusting proactively to the challenges identified in this
report: new restaurant models that accommodate shifting customer preferences are being launched
across the state, creative staffing approaches are being tested, and new collaboration initiatives among
industry partners (such as suppliers and restaurants) are being implemented.
Below, the Commission proposes recommendations for consideration that may alleviate pressure during
this challenging transition period and enhance the sustainability of the restaurant industry for years to
come.
Short-Term Recommendations
Conduct studies to inform future legislative changes facilitating the transition period for restaurants
We recommend conducting a detailed study to explore innovative wage models that could
help expand the workforce pool and enhance the affordability of labor in the restaurant
industry. The study could focus on attracting younger employees and underrepresented
populations into the restaurant workforce.
We recommend conducting a detailed study to analyze quantitatively the impact of recent
workforce legislation on Massachusetts’ restaurant industry operating margins over the next
3-5 years.
Streamline licensing and permitting statewide
We recommend that the State, in collaboration with other state agencies and the
Massachusetts Restaurant Association, consider partnering with municipalities to create a
statewide online portal to streamline licensing and permitting processes at all levels. The
purpose of such a portal would be to centralize relevant information on requirements for
applicants and to increase visibility for all stakeholders. At minimum, identifying a series of
best practices relative to the licensing and permitting process could serve local governments
and industry well.
Foster effective marketing of the restaurant industry and increase traffic to restaurants
We recommend that the Massachusetts Office of Travel and Tourism prioritize inviting to
Massachusetts globally-recognized restaurant reviewers, such as the Michelin Red Guide, to
promote greater visibility for restaurants in Massachusetts. Massachusetts already has
multiple James Beard-winning chefs, but as of yet, no Michelin-starred restaurants. According
to Michelin, their Guide now rates 30,000 establishments globally, and more than 30 million
Michelin guides have been sold worldwide51.
Explore options to reduce operating costs for restaurants
We recommend that the Legislature consider developing legislation that would thoughtfully
enable tip pool sharing between ‘front of the house’ and ‘back of the house’ restaurant
employees.
51
Michelin Guide Website “About Us” Section
27 We recommend that the Legislature consider developing legislation that would enable
restaurants to more equally compensate ‘back of the house’ and ‘front of the house’
employees and to support the dignity of the workforce through various measures, such as
tax-exempt check surcharges for the ‘back of the house’ staff.
We recommend that the Legislature consider evaluating credit card service fees and the
impacts those fees have on the bottom-line of restaurants.
Longer-Term Recommendations
Make it easier for a restaurant to hire and retain its workforce
We recommend considering launching a workforce campaign to make it easier to attract, hire,
train, and retain staff for both front-of-house and back-of-house restaurant positions. Such a
campaign could include close collaboration with community colleges and vocational schools
that currently offer culinary curricula and could build on on-going efforts such as the Career
Technical Initiative, the Massachusetts Restaurant Association Apprenticeship Program, and
the Executive Office of Labor and Workforce Development Apprenticeship Advisory Group’s
Apprenticeship Expansion Strategic Plan as part of the Regional Workforce Skills Planning
Initiative.
We recommend that Massachusetts community colleges, vocational schools, and high schools
consider forming partnerships with culinary organizations such as the American Culinary
Federation (ACF) and the Culinary Institute of America and ideally incorporate accreditation
by such institutions into their degree offerings to attract more candidates into their programs.
Currently, Holyoke Community College is the only community college institution that offers
an ACF-accredited culinary program in Massachusetts.
We recommend that restaurant operators, in collaboration with Massachusetts Restaurant
Association, evaluate the potential benefits associated with employee loyalty programs and
employee ownership models.
We recommend that the Legislature continue to collaborate with federal authorities and
make the H-2B visa application process less time- and cost-intensive for employers.
Improve awareness across the restaurant industry on key matters impacting industry viability
We recommend that the restaurant operator community, in collaboration with the
Massachusetts Restaurant Association, consider developing approaches to better leverage
the collective purchasing power of the restaurant industry to protect industry operating
margins, including reducing healthcare insurance and supply chain costs.
Continue to address state-level matters impacting the restaurant industry
We recommend that the State enable the restaurant workforce (and restaurant customers)
to more easily access restaurants by continuing to address state-level issues such as traffic
congestion, public transportation availability, and housing affordability. The housing
challenge is particularly dire on Cape Cod and the Islands for restaurant staff, where
operations are typically seasonal.
Foster effective marketing of the restaurant industry and increase traffic to restaurants
We recommend considering cultivating a closer partnership between the Massachusetts
Office of Travel and Tourism and the restaurant industry as part of MOTT’s economic
development mission.
28You can also read