Material Structural Aspects of Variable Annuities Vs. Mutual Funds - TIAA
←
→
Page content transcription
If your browser does not render page correctly, please read the page content below
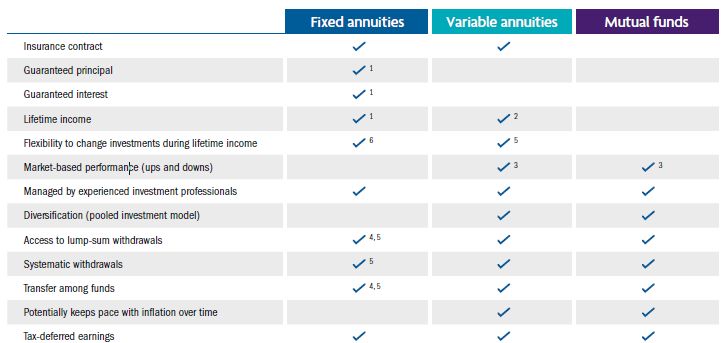
Material Structural Aspects of Variable Annuities Vs.
      Mutual Funds
There are material differences between mutual funds and CREF variable accounts. Mutual fund capital-gain distributions or dividends paid are added to the number of shares owned (number of
shares increase). CREF account capital-gain distributions or dividends are added to the unit value (number of units stay constant). Our mutual fund and variable annuity products are subject to
various fees and expenses, including but not limited to management, administrative, and distribution fees; our variable annuity products have an additional mortality and expense (M&E) risk
charge.
A variable annuity is an insurance contract and includes underlying investments whose value, similar to a mutual fund, is tied to market performance.** When markets are up, you can capture the
gains, but you may also experience losses when markets are down. When you retire, you can choose to receive lifetime income payments for you and/or your partner or spouse, if so desired. The
amount of each payment can go up or down based on the performance of the underlying account. CREF also provides the opportunity for income through systematic withdrawals or a lump-sum
withdrawal.
A mutual fund pools money from many investors to purchase a collection of stocks, bonds or other securities which are managed in one fund. When markets are up, you can capture the gains,
but you may also experience losses when markets are down. Some or all of your assets can be transferred among funds or converted to cash at retirement with ease.

1. Guarantees provided under fixed annuities are subject to the issuing company’s claims-paying ability. 2. Income from variable annuities will fluctuate based on the performance of the
underlying investments. 3. Keep in mind, there are risks associated with investing in securities, including possible loss of principal. 4. Withdrawal/Transfer charges may apply based on the type of
annuity contract. 5. Dependent on annuity contract. 6. TIAA Traditional income can only be transferred into one of the Five (5) CREF Equity investments which includes CREF Stock, CREF Social
Choice, CREF Global Equities, CREF Equity Index, and the CREF Growth. Transfers to CREF are over a 5-year period and may be stopped at any time.
**There are risks associated with investing in securities including possible loss of principal. Guarantees are subject to the claims-paying ability of the issuing company. Investment, insurance and

annuity products are not FDIC insured, are not bank guaranteed, are not deposits, are not insured by any federal government agency, are not a condition to any banking service or activity, and
may lose value.
The net expense ratio represents expenses after reimbursement and waivers, if applicable, and is what participants actually pay; while the gross expense ratio represents the expense ratio
before consideration for reimbursements and/or waivers are applied. CREF is an at-cost product, which means its net and gross expenses are the same. Due to CREF being an at-cost product,
CREF’s expense ratios increase/decrease depending on changes in net assets and/or total expenses. Total annual expense deductions, which include investment advisory, administrative, and
distribution (12b-1) expenses, and mortality and expense risk charges, are estimated each year based on projected expense and asset levels. Differences between actual expenses and the
estimate are adjusted quarterly and are reflected in current investment results. Historically, adjustments have been small. The Account’s total annual expense deduction appears in the Account's
prospectus, and may be different than that shown herein due to rounding. Please refer to the prospectus for further details.
                                                                                                                                                                                           1
CREF Equity Index Account Investment Product Commentary
For the quarter-to-date ending March 31, 2022
Account Performance Highlights a series of Fed rate hikes designed to cool red-hot inflation. Despite strong U.S.
economic data, the index declined further in February (-2.5%) in the face of surging
In the first quarter of 2022, the CREF Equity Index Account produced negative
energy prices and heightened geopolitical risk due to Russia’s invasion of Ukraine.
returns and slightly trailed its benchmark, the Russell 3000® Index. Performance
In March, equity investors generally shrugged off the escalation of the war and the
deviations from the index were due primarily to the effects of expenses. The
Fed’s more hawkish outlook, helping lift the Russell 3000 for the month (+3.2%)
Account has a risk profile similar to that of the Russell 3000 Index.
and trim its full-quarter loss to -5.3%.
The U.S. economy began the quarter in the throes of the Omicron variant of
Of the Russell 3000’s 11 sectors, eight produced negative returns, with
COVID-19, which disrupted businesses by exacerbating supply chain bottlenecks
communication services, consumer discretionary and information technology
and staff shortages. In late February, with the virus in retreat, Russia’s invasion of
faring the worst. Only energy, which rallied hard thanks to the spike in oil prices,
Ukraine fueled sharper increases in the already rising costs of oil and other
and utilities, a sector that often proves resilient during “risk-off” quarters, finished
commodities, pushing consumer price inflation up to levels not seen since 1982.
in positive territory. Materials ended the quarter flat. Based on respective Russell
Despite these challenges, the U.S. economy remained resilient throughout the
indexes, large caps (-5.1%) topped mid caps (-5.7%) and small caps (-7.5%), while
period. Healthy household balance sheets and rapid job creation supported
value (-0.9%) handily outperformed growth (-9.3%).
consumer spending. Meanwhile, housing starts and building permits (a leading
indicator of future homebuilding) surged, as did home prices.
At its March meeting, the Federal Reserve raised interest rates for the first time
Positioning
since December 2018, lifting the target federal funds rate by 25 basis points The CREF Equity Index Account seeks to replicate the Russell 3000 Index to
(+0.25%), to a range of 0.25%–0.50%. The move came as no surprise amid create a portfolio that closely matches the overall investment characteristics of
significantly higher levels of inflation and falling unemployment. The Fed’s that index.
“dot plot” showed six 25-basis-point hikes over the course of its six remaining
meetings this year, with another three to four on tap in 2023, until the fed funds
rate reaches 2.75%.
In its economic forecasts, the Fed projected GDP growth will slow to 2.8% this
year, a decline from the 4% it anticipated at its December meeting. Regarding
inflation, the Fed expects the core PCE index, its preferred inflation barometer, to
drop to 4.1% at the end of 2022 and to 2.6% in 2023. These levels, while lower
than the most-recent 5.4% reading, are still above the Fed’s 2% target.
U.S. equities, as measured by the Russell 3000 Index, jumped out to a record
high to begin the quarter but were unable to sustain their momentum in a period
punctuated by substantial intraday volatility. January marked the index’s worst
one-month return (-5.9%) since the onset of the pandemic, as investors braced for
The sectors referenced in the relative performance commentary above are based on the Global Industry Classification Standard (GICS®). The Global Industry Classification Standard (GICS)
was developed by MSCI, a premier independent provider of global indexes and benchmark-related products and services, and Standard & Poor’s (S&P), an independent international
financial data and investment services company and a leading provider of global equity indexes. You cannot invest directly in any index. Unlike mutual funds, index returns do not reflect a
deduction for fees or expenses.CREF Equity Index Account Investment Product Commentary
For the quarter-to-date ending March 31, 2022
Average Annual Return
Estimated Gross Latest Since
Ticker Annual Expenses² Inception Quarter 1 Year 3 Year 5 Year 10 Year Inception
CREF Equity Index Account – R1 QCEQRX 0.38% 4/29/1994 -5.33 -5.33 11.61 17.79 14.92 13.79
CREF Equity Index Account – R21 QCEQPX 0.22% 4/24/2015 -5.29 -5.29 11.78 17.99 15.13 N/A
CREF Equity Index Account – R31 QCEQIX 0.17% 4/24/2015 -5.28 -5.28 11.83 18.06 15.20 N/A
Russell 3000® Index -5.28 -5.28 11.92 18.24 15.40 N/A
Top 10 Holdings
Issuer % of Net Assets
Apple Inc. 5.97%
Microsoft Corp. 5.15%
Amazon.com Inc. 3.14%
Tesla Inc. 1.99%
Alphabet Cl A 1.85%
Alphabet Cl C 1.71%
NVIDIA Corp. 1.45%
Berkshire Hathaway Inc. Cl B 1.43%
Meta Platforms Inc. 1.14%
United Health Group Inc. 1.06%
The performance data quoted represents past performance and does not predict or guarantee future results. Your returns and the principal value of your investments will fluctuate so that your shares or
accumulation units, when redeemed, may be worth more or less than their original cost. Current performance may be lower or higher than the performance quoted. For performance current to the most recent
month-end, visit TIAA.org or call 877-518-9161.
1
Effective April 24, 2015, additional classes are available with different eligibility requirements. The performance TIAA-CREF Individual & Institutional Services, LLC, Member FINRA, distributes securities products.
shown that is prior to the inception date for Class R2 and Class R3 is based on the Account’s Class R1. The This variable annuity is issued by College Retirement Equities Fund (CREF), New York, NY. Each TIAA entity is solely
inception date of the Account’s Class R1 is shown in the table above. The performance for these periods has not responsible for its own financial condition and contractual obligations.
been restated to reflect the lower expenses of Class R2 and Class R3. If these lower expenses had been reflected,
Investment, insurance and annuity products are not FDIC insured, are not bank guaranteed, are not deposits, are not
the performance of Class R2 and Class R3 for these periods would have been higher. Please visit the account’s
insured by any federal government agency, are not a condition to any banking service or activity, and may lose value.
prospectus at TIAA.org for more information.
2
Total annual expense deductions, which include investment advisory, administrative, and distribution (12b-1) You should consider the investment objectives, risks, charges and expenses carefully before
expenses, and mortality and expense risk charges, are estimated each year based on projected expense and asset investing. Please call 877-518-9161 or go to www.TIAA.org/prospectuses for current product and
levels. Please visit the account’s prospectus at TIAA.org for more information. fund prospectuses that contain this and other information. Please read the prospectuses carefully
The Russell 3000® Index measures the performance of the largest 3000 U.S. companies representing approximately before investing.
98% of the investable U.S. equity market. This material is for informational or educational purposes only and does not constitute fiduciary investment advice under
The Account is subject to market, company risk, index risk, large-cap risk and small- and mid-cap risk. Please ERISA, a securities recommendation under all securities laws, or an insurance product recommendation under state
consider all risks carefully prior to investing. insurance laws or regulations. This material does not take into account any specific objectives or circumstances of any
Top ten holdings are subject to change and may not be representative of the Account’s current or future investments. The particular investor, or suggest any specific course of action. Investment decisions should be made based on the investor’s own
holdings listed only include the Account’s long-term investments. Money market instruments and/or futures contracts, and objectives and circumstances.
index products used for cash management or to provide temporary exposure to a particular stock or country, as applicable, ©2022 Teachers Insurance and Annuity Association of America-College Retirement Equities Fund, 730 Third Avenue,
are excluded. The holdings may not include the Account’s entire investment portfolio and should not be considered a New York, NY 10017
recommendation to buy or sell a particular security.
2123267 (04/22)CREF Global Equities Account Investment Product Commentary
For the quarter-to-date ending March 31, 2022
Account Performance Highlights Positioning
In the first quarter of 2022, the CREF Global Equities Account underperformed its Entering the second quarter, we remain constructive on global equities overall,
benchmark, the MSCI All-Country World Index. Fair valuing had a negative effect on while recognizing the need to be selective given the crosscurrents of inflation,
the Account’s return during the quarter.* likely higher-for-longer energy prices and elevated geopolitical risks. In the U.S.,
economic data has remained healthy, supporting healthy but modestly slower
Global equity market returns were broadly negative in the first quarter of 2022.
growth, and earnings estimates for 2022 are positive. Outside the U.S., oversold
The period was marked by heightened geopolitical volatility amid Russia’s invasion
conditions, particularly in the EM space, have made valuations more attractive.
of Ukraine, surging energy prices and persistently high inflation, especially in the
U.S. and eurozone. In the U.S., fears of a slowing economy and uncertainty over The Account’s individual sub-strategies are managed independently; however, the
the Federal Reserve’s increasingly hawkish monetary policy weighed on equities as general theme of the portfolio is to provide attractive long-term return potential
well. Overseas stock markets also fell in aggregate during the period, with results without undue risk. We believe the Account’s multimanager approach enhances
comparable to those of most major U.S. indexes. On a regional basis, returns in our ability to find distinct, compelling investment opportunities globally, while
Latin America and emerging markets ex-China were substantially more resilient providing diversification across investment styles.
than in Europe.
The Global Equities Account allocates its assets across three independently
operated sub-strategies — two actively managed sub-strategies as well as an
active research portfolio — in addition to a small index component for liquidity
purposes. To provide broad diversification, each discipline offers a unique
investment style and approach in its stock selection process.
For the quarter, the Account’s underperformance relative to its benchmark was due
primarily to lagging returns in the fundamental active international growth portfolio.
Additionally, slight underperformance by the fundamental active core global and
global research portfolios detracted modestly.
At the aggregate level, the financials and information technology sectors detracted
the most from the Account’s first-quarter relative performance, reflecting unfavorable
stock selection within those sectors. An overweight position in Japanese human
resources outsourcing company Recruit Holdings Co. Ltd. was the largest stock-
specific detractor. On the plus side, energy was the top contributor from a sector
perspective. In terms of individual names, the leading contributor was an
underweight in Facebook’s parent company, Meta Platforms Inc., whose shares
underperformed during the period.
* T he Account’s return may sometimes diverge from the return of its benchmark index more than would be expected. This may be the result of a fair-value pricing adjustment. Many
foreign exchanges close before the Account’s daily unit value is calculated (generally 4 p.m. ET). In the intervening hours, the value of foreign securities can change, and these
changes are not reflected immediately in the Account’s benchmark index. They may, however, be reflected in the calculation of the Account’s unit value for that day.
The sectors referenced in the relative performance commentary above are based on the Global Industry Classification Standard (GICS®). The Global Industry Classification Standard
(GICS) was developed by MSCI, a premier independent provider of global indexes and benchmark-related products and services, and Standard & Poor’s (S&P), an independent
international financial data and investment services company and a leading provider of global equity indexes.CREF Global Equities Account Investment Product Commentary
For the quarter-to-date ending March 31, 2022
Average Annual Returns
Estimated Gross Latest Since
Ticker Annual Expenses2 Inception Quarter 1 Year 3 Year 5 Year 10 Year Inception
CREF Global Equities Account–R1 QCGLRX 0.42% 5/01/1992 -6.39 4.61 14.29 11.59 10.23 8.11
CREF Global Equities Account–R21 QCGLPX 0.27% 4/24/2015 -6.35 4.77 14.48 11.80 N/A 9.06
CREF Global Equities Account–R31 QCGLIX 0.22% 4/24/2015 -6.33 4.82 14.54 11.86 N/A 9.13
MSCI All-Country World Index -5.36 7.28 13.75 11.64 10.00 N/A
Security Selection Effects Sector Effects on Top 10 Holdings
on Account Performance Account Performance Issuer % of Net Assets
Top Contributing Securities Top Contributing Sectors n Consumer Staples Microsoft Corp. 3.88%
Equinor ASA Energy n Health Care Apple Inc. 3.75%
n Consumer Discretionary Amazon.com Inc. 2.49%
Meta Platforms, Inc. Communication Services
n Energy
Freeport-McMoRan, Inc. Health Care n Industrials Taiwan Semiconductor Mfg. 1.53%
n Information Technology Alphabet Inc. Cl C 1.34%
Top Detracting Securities Top Detracting Sectors n Materials Tesla Inc. 1.17%
Recruit Holdings Co., Ltd. Financials n Financials
n Communications Services Alphabet Inc. Cl A 1.08%
ING Groep NV Information Technology
n Utilities Broadcom Inc. 1.05%
Sony Group Corporation Industrials n Real Estate United Health Group Inc. 1.01%
n Contribution n Detraction Mastercard Inc. 0.93%
The performance data quoted represents past performance and does not predict or guarantee future results. Your returns and the principal value of your investments will fluctuate so that your shares or
accumulation units, when redeemed, may be worth more or less than their original cost. Current performance may be lower or higher than the performance quoted. For performance current to the most recent
month-end, visit TIAA.org or call 877-518-9161.
1
Effective April 24, 2015, additional classes are available with different eligibility requirements. The performance shown cash management or to provide temporary exposure to a particular stock or country, is applicable, are excluded. The holdings may not
for Class R2 and Class R3 that is prior to its inception date is based on the Account’s Class R1. The inception date of the include the account’s entire investment portfolio and should not be considered a recommendation to buy or sell a particular security.
Account’s Class R1 is shown in the table above. The performance for these periods has not been restated to reflect the lower TIAA-CREF Individual & Institutional Services, LLC, Member FINRA, distributes securities products.
expenses of the Class R2 and Class R3. If these lower expenses had been reflected, the performance of the Class R2 and
Diversification cannot ensure a profit nor eliminate market risk.
Class R3 for these periods would have been higher. Please visit the account’s prospectus at TIAA.org for more information.
This variable annuity is issued by College Retirement Equities Fund (CREF), New York, NY. Each TIAA entity is solely
2
Total annual expense deductions, which include investment advisory, administrative, and distribution (12b-1)
responsible for its own financial condition and contractual obligations.
expenses, and mortality and expense risk charges, are estimated each year based on projected expense and asset
levels. Please visit the account’s prospectus at TIAA.org for more information. Investment, insurance and annuity products are not FDIC insured, are not bank guaranteed, are not deposits, are not
insured by any federal government agency, are not a condition to any banking service or activity, and may lose value.
The Account is subject to certain risks, such as market and investment style risk. Please consider all risks carefully
prior to investing. Please note investments in foreign securities are subject to special risks, including currency You should consider the investment objectives, risks, charges and expenses carefully before
fluctuation and political and economic instability. investing. Please call 877-518-9161 or go to www.TIAA.org/prospectuses for current product and
The MSCI ACWI (All Country World Index) is a free float-adjusted market capitalization weighted index that is designed to measure fund prospectuses that contain this and other information. Please read the prospectuses carefully
the equity market performance of developed and emerging markets. The MSCI ACWI consists of 46 country indexes comprising before investing.
23 developed and 23 emerging market country indexes. The developed market country indexes included are: Australia, Austria, This material is for informational or educational purposes only and does not constitute fiduciary investment advice under
Belgium, Canada, Denmark, Finland, France, Germany, Hong Kong, Ireland, Israel, Italy, Japan, Netherlands, New Zealand, Norway, ERISA, a securities recommendation under all securities laws, or an insurance product recommendation under state
Portugal, Singapore, Spain, Sweden, Switzerland, the United Kingdom and the United States. The emerging market country indexes insurance laws or regulations. This material does not take into account any specific objectives or circumstances of any
included are: Brazil, Chile, China, Colombia, Czech Republic, Egypt, Greece, Hungary, India, Indonesia, Korea, Malaysia, Mexico, particular investor, or suggest any specific course of action. Investment decisions should be made based on the investor’s own
Peru, Philippines, Poland, Qatar, Russia, South Africa, Taiwan, Thailand, Turkey* and United Arab Emirates. objectives and circumstances.
Top ten holdings are subject to change and may not be representative of the account’s current or future investments. The holdings listed ©2022 Teachers Insurance and Annuity Association of America-College Retirement Equities Fund, 730 Third Avenue,
only include the account’s long-term investments. Money market instruments and/or futures contracts, and index products used for New York, NY 10017
2123177 (04/22)CREF Growth Account Investment Product Commentary
For the quarter-to-date ending March 31, 2022
Account Performance Highlights In a reversal of the prior three quarters, large cap growth stocks (-9.0%) lagged
large cap value (-0.7%), based on respective Russell indexes. Within the Account’s
In the first quarter of 2022, the CREF Growth Account underperformed its
benchmark, all but one of 11 sectors posted negative returns, with communication
benchmark, the Russell 1000® Growth Index.
services, materials and real estate faring the worst. Only energy, which rallied hard
The U.S. economy began the quarter in the throes of the Omicron variant of thanks to the spike in oil prices, finished in positive territory.
COVID-19, which disrupted businesses by exacerbating supply chain bottlenecks
Performance of the CREF Growth Account is driven by bottom-up stock selection in two
and staff shortages. In late February, with the virus in retreat, Russia’s invasion
fundamental, actively managed portfolio “sleeves.” Both sleeves underperformed the
of Ukraine fueled sharper increases in the already rising costs of oil and other
benchmark during the quarter.
commodities, pushing consumer price inflation up to levels not seen since 1982.
Despite these challenges, the U.S. economy remained resilient throughout the The primary detractor from the Account’s relative performance was unfavorable
period. Healthy household balance sheets and rapid job creation supported stock selection in the information technology, health care and consumer
consumer spending. Meanwhile, housing starts and building permits (a leading discretionary sectors. These negative results were partly offset by positive stock
indicator of future homebuilding) surged, as did home prices. selection in communication services, an overweight allocation to energy and an
overweight for much of the quarter in financials.
In its economic forecasts, the Federal Reserve projected GDP growth will slow
to 2.8% this year, a decline from the 4% it anticipated at its December meeting.
Regarding inflation, the Fed expects the core PCE index, its preferred inflation Positioning
barometer, to drop to 4.1% at the end of 2022 and to 2.6% in 2023. These levels, The CREF Growth Account is an actively managed, diversified U.S. large-cap equity
while lower than the most-recent 5.4% reading, are still above the Fed’s 2% target. variable annuity, emphasizing low relative risk. The Account seeks to generate
The Russell 1000 Growth Index began the quarter at a record high but was unable excess return by leveraging the skills and experience of two fundamental active
to sustain its momentum in a period punctuated by substantial intraday volatility. growth portfolio managers.
January marked the Russell 1000 Growth’s worst one-month return (-8.6%) since the In the U.S., solid economic momentum is running into tighter financial conditions
onset of the pandemic, as investors braced for a series of Fed rate hikes designed and elevated energy prices. The result is likely to be slower GDP growth, from
to cool red-hot inflation. Despite strong U.S. economic data, the index declined 5.7% in 2021 to 2.5%–3% in 2022, still a quite respectable number. Consumer
further in February (-4.2%) in the face of surging energy prices and heightened spending, which makes up about 70% of GDP, should stay healthy, as people are
geopolitical risk due to Russia’s invasion of Ukraine. In March, equity investors able to draw down accumulated savings and are having little trouble finding
generally shrugged off the escalation of the war and the Fed’s more hawkish outlook, better-paying jobs. Regarding the Federal Reserve, following March’s “rate liftoff,”
helping lift the Russell 1000 Growth for the month (+3.9%) and trim its full-quarter markets anticipate nearly 225 basis points of additional interest-rate hikes over
loss to -9.0%. Despite this partial rebound, the index suffered its first down quarter the course of its six remaining meetings in 2022, implying that the Fed could hike
in two years. by 50 basis points at several of those meetings.
The sectors referenced in the relative performance commentary above are based on the Global Industry Classification Standard (GICS®). The Global Industry Classification Standard (GICS)
was developed by MSCI, a premier independent provider of global indexes and benchmark-related products and services, and Standard & Poor’s (S&P), an independent international
financial data and investment services company and a leading provider of global equity indexes. You cannot invest directly in any index. Unlike mutual funds, index returns do not reflect a
deduction for fees or expenses.CREF Growth Account Investment Product Commentary
For the quarter-to-date ending March 31, 2022
Average Annual Returns
Estimated Gross Latest Since
Ticker Annual Expenses² Inception Quarter 1 Year 3 Year 5 Year 10 Year Inception
CREF Growth Account–R1 QCGRRX 0.39% 4/29/1994 -11.54 4.74 18.84 18.12 15.44 9.92
CREF Growth Account–R21 QCGRPX 0.24% 4/24/2015 -11.50 4.90 19.04 18.35 N/A 14.64
CREF Growth Account–R31 QCGRIX 0.19% 4/24/2015 -11.49 4.96 19.11 18.41 N/A 14.72
Russell 1000® Growth Index -9.04 14.98 23.60 20.88 17.04 N/A
Security Selection Effects Sector Effects on Top 10 Holdings
on Fund Performance Fund Performance Issuer % of Net Assets
Microsoft Corp. 10.53%
Top Contributing Securities Top Contributing Sectors n Consumer Staples
Netflix, Inc. Real Estate n Health Care Amazon.com Inc. 6.88%
n Consumer Discretionary Apple Inc. 5.55%
Home Depot, Inc. Financials
n Energy Alphabet Inc. Cl A 3.89%
Palo Alto Networks, Inc. Communication Services n Industrials
n Information Technology Tesla Inc. 3.33%
Top Detracting Securities Top Detracting Sectors n Materials NVIDIA Corp. 3.16%
Apple Inc. Information Technology n Financials Visa Inc. Cl A 2.62%
Align Technology, Inc. Health Care
n Communications Services
n Utilities Alphabet Inc. Cl C 2.60%
PayPal Holdings, Inc. Consumer Discretionary n Real Estate Costco Wholesale Corp. 2.51%
n Contribution n Detraction Meta Platforms Inc. 2.46%
The performance data quoted represents past performance and does not predict or guarantee future results. Your returns and the principal value of your investments will fluctuate so that your shares or
accumulation units, when redeemed, may be worth more or less than their original cost. Current performance may be lower or higher than the performance quoted. For performance current to the most recent
month-end, visit TIAA.org or call 877-518-9161.
¹ Effective April 24, 2015, additional classes are available with different eligibility requirements. The performance shown TIAA-CREF Individual & Institutional Services, LLC, Member FINRA, distributes securities products.
for Class R2 and Class R3 that is prior to its inception date is based on the Account’s Class R1. The inception date of the This variable annuity is issued by College Retirement Equities Fund (CREF), New York, NY. Each TIAA entity is solely
Account’s Class R1 is shown in the table above. The performance for these periods has not been restated to reflect the lower responsible for its own financial condition and contractual obligations.
expenses of the Class R2 and Class R3. If these lower expenses had been reflected, the performance of the Class R2 and
Class R3 for these periods would have been higher. Please visit the account’s prospectus at TIAA.org for more information. You should consider the investment objectives, risks, charges and expenses carefully before investing.
² Total annual expense deductions, which include investment advisory, administrative, and distribution (12b-1)
Please call 877-518-9161 or go to www.TIAA.org/prospectuses for current product and fund prospectuses
expenses, and mortality and expense risk charges, are estimated each year based on projected expense and asset that contain this and other information. Please read the prospectuses carefully before investing.
levels. Please visit the account’s prospectus at TIAA.org for more information. Investment, insurance and annuity products are not FDIC insured, are not bank guaranteed, are not deposits, are not
The Account is subject to certain risks, such as market and investment style risk and risks of growth investing, which insured by any federal government agency, are not a condition to any banking service or activity, and may lose value.
include potentially higher volatility than value stocks. Please consider all risks carefully prior to investing. Diversification cannot ensure a profit nor eliminate market risk.
The Russell 1000® Index measures the performance of the large cap segment of the U.S. equity universe which includes This material is for informational or educational purposes only and does not constitute fiduciary investment advice under
approximately 1000 of the largest securities based on a contribution of their market cap and current index measurement. ERISA, a securities recommendation under all securities laws, or an insurance product recommendation under state
Top ten holdings are subject to change and may not be representative of the account’s current or future investments. The insurance laws or regulations. This material does not take into account any specific objectives or circumstances of any
holdings listed only include the account’s long-term investments. Money market instruments and/or futures contracts, and particular investor, or suggest any specific course of action. Investment decisions should be made based on the investor’s own
index products used for cash management or to provide temporary exposure to a particular stock or country, is applicable, objectives and circumstances.
are excluded. The holdings may not include the account’s entire investment portfolio and should not be considered a ©2022 Teachers Insurance and Annuity Association of America-College Retirement Equities Fund, 730 Third Avenue,
recommendation to buy or sell a particular security. New York, NY 10017
2123233 (04/22)CREF Social Choice Account Investment Product Commentary
For the quarter-to-date ending March 31, 2022
Account Performance Highlights Positioning
In the first quarter of 2022, the CREF Social Choice Account underperformed the The CREF Social Choice Account is a balanced portfolio with equity and fixed-income
-5.40% return of its weighted composite benchmark (42% Russell 3000® Index for components that incorporate environmental, social, and governance (ESG) criteria.
U.S. equities; 18% MSCI EAFE+Canada Index for international equities; and 40% The equity component uses a quantitative approach to attempt to match, to the
Bloomberg U.S. Aggregate Bond Index for U.S. investment-grade fixed income). extent possible given the eligible investment universe, the risk characteristics of its
The Russell 3000 suffered its worst quarter in two years, returning -5.3% against respective U.S. and international equity benchmarks. Some stocks that are included
a backdrop of increasingly hawkish monetary policy, higher-than-expected inflation, in the indexes are not part of the Account’s eligible universe. As a result, some
surging energy prices and heightened geopolitical risk due to Russia’s invasion of individual securities in the eligible universe may be either overweighted or
Ukraine. The MSCI EAFE+Canada Index also lost ground, returning -4.8% in U.S. underweighted relative to the benchmark.
dollar terms. In U.S. fixed-income markets, the Bloomberg U.S. Aggregate Bond The entire fixed-income sleeve is actively managed and subject to ESG and impact
Index returned -5.9% amid rising and volatile interest rates. Account performance criteria. It includes holdings identified through our proprietary impact framework,
was mixed. The U.S. equity and fixed income sleeves lagged their respective which are public fixed-income securities that seek competitive risk-adjusted returns
benchmarks, while the international equity sleeve outperformed. along with direct and measurable social and environmental benefits in key thematic
In the U.S. equity portion, the information technology sector drove underperformance; areas: affordable housing; community and economic development; renewable energy
health care and consumer discretionary were the next-largest detractors. In contrast, and climate change; and natural resources. Most impact holdings are not in the
communication services, utilities and energy were the largest contributors. Among Account’s benchmark.
individual stocks, not owning Berkshire Hathaway, Exxon Mobil or Apple hurt the Our continued overweight in spread products included asset-backed securities,
most. None of these companies is eligible for inclusion in the Account based on ESG commercial mortgage-backed securities, corporate credit and taxable municipals.
criteria. The top contributors included not owning Meta Platforms (not eligible due to Significant underweights included U.S. Treasuries and agency mortgage-backed
ESG criteria), and positions in ConocoPhillips and Marathon Oil. securities. Credit selection favored higher-quality sectors and securities, and our
In the international sleeve, communication services, industrials and financials duration was shorter than the benchmark’s.
aided returns the most, while consumer staples, consumer discretionary and Responsible investing incorporates Environmental Social Governance (ESG)
materials were the top-detracting sectors. As for specific names, Teck Resources, factors that may affect exposure to issuers, sectors and industries, limiting the
Nutrien and Equinor provided the biggest lifts. The biggest detractions came from type and number of investment opportunities available, which could result in
not owning Shell, BHP Group or Canadian Natural Resources, none of which is excluding investments that perform well.
eligible for investment due to the Account’s ESG criteria.
Fixed-income underperformance was driven by sector allocation, including
overweights in corporates and municipals. Security selection partially offset
these negative effects, notably in municipals and corporates. Yield-curve
positioning was additive to results.
The sectors referenced in the relative performance commentary above are based on the Global Industry Classification Standard (GICS®). The Global Industry Classification Standard
(GICS) was developed by MSCI, a premier independent provider of global indexes and benchmark-related products and services, and Standard & Poor’s (S&P), an independent
international financial data and investment services company and a leading provider of global equity indexes. You cannot invest directly in any index. Unlike mutual funds, index returns
do not reflect a deduction for fees or expenses.CREF Social Choice Account Investment Product Commentary
For the quarter-to-date ending March 31, 2022
Average Annual Returns
Estimated Gross Latest Since
Ticker Annual Expenses2 Inception Quarter 1 Year 3 Year 5 Year 10 Year Inception
CREF Social Choice Account–R1 QCSCRX 0.40% 3/01/1990 -6.20 3.04 9.82 8.58 7.91 8.29
CREF Social Choice Account–R21 QCSCPX 0.25% 4/24/2015 -6.16 3.20 10.00 8.78 N/A 7.25
CREF Social Choice Account–R31 QCSCIX 0.20% 4/24/2015 -6.14 3.25 10.06 8.84 N/A 7.33
CREF Social Choice Account Composite Index -5.19 2.26 8.88 8.02 7.35 N/A
Morningstar Moderate Target Risk Index -5.40 3.84 10.08 8.81 8.28 N/A
Security Selection Effects on Account Performance Sector Effects on Account Performance Top 10 Holdings
CREF Social Choice CREF Social Choice CREF Social Choice CREF Social Choice CREF Social Choice Issuer % of Net Assets
Domestic International Domestic International Fixed Income Microsoft Corp. 2.35%
Tesla Inc. 1.04%
Top Contributing Securities Top Contributing Sectors
Fixed Income Clearing Corp. 0.85%
Meta Platforms, Inc. Teck Resources Limited Communication Services Communication Services Treasuries
NVIDIA Corp. 0.81%
ConocoPhillips Nutrien Ltd. Utilities Industrials MBS
U.S. Treasury Note 1.875%, 02/28/27 0.80%
Marathon Oil Corporation Equinor ASA Energy Financials Others
U.S. Treasury Note 1.875%, 02/15/32 0.67%
Top Detracting Securities Top Detracting Sectors U.S. Treasury Bond 2.250%, 02/15/42 0.63%
Berkshire Hathaway Inc. Shell plc Information Technology Consumer Staples Corporates FNMA TBA 3.00%, 04/25/52 0.55%
Exxon Mobil Corporation BHP Group Limited Health Care Consumer Discretionary Municipals Procter & Gamble Co. 0.54%
Apple Inc. Canadian Natural Resources Limited Consumer Discretionary Materials Govt Rel.– Credit Mastercard Inc. 0.49%
The performance data quoted represents past performance and does not predict or guarantee future results. Your returns and the principal value of your investments will fluctuate so that your shares or accumulation units, when redeemed, may
be worth more or less than their original cost. Current performance may be lower or higher than the performance quoted. For performance current to the most recent month-end, visit TIAA.org or call 877 518-9161.
1
Effective April 24, 2015, additional classes are available with different eligibility requirements. The performance shown The CREF Social Choice Account Composite Benchmark is a weighted average of unmanaged benchmark indices that
for Class R2 and Class R3 that is prior to its inception date is based on the Account’s Class R1. The inception date of the represent the market sectors in which the Account invests. The Composite Index provides a more relevant benchmark for
Account’s Class R1 is shown in the table above. The performance for these periods has not been restated to reflect the lower the Account’s performance as compared to the Account’s unmanaged broad-based market indices. You cannot invest
expenses of the Class R2 and Class R3. If these lower expenses had been reflected, the performance of the Class R2 and directly in any index. Index returns do not reflect a deduction for fees or expenses. The Morningstar Moderate Target Risk
Class R3 for these periods would have been higher. Please visit the account’s prospectus at TIAA.org for more information. Index seeks approximately 60% exposure to global equity markets.
2
Total annual expense deductions, which include investment advisory, administrative, and distribution (12b-1) Investment, insurance and annuity products are not FDIC insured, are not bank guaranteed, are not deposits, are not
expenses, and mortality and expense risk charges, are estimated each year based on projected expense and asset insured by any federal government agency, are not a condition to any banking service or activity, and may lose value.
levels. Please visit the account’s prospectus at TIAA.org for more information. This variable annuity is issued by College Retirement Equities Fund (CREF), New York, NY. Each TIAA entity is solely
The Account is subject to certain risks, such as market and investment-style risks. Please consider all risks carefully responsible for its own financial condition and contractual obligations.
prior to investing. Because its social screens exclude some investments, the account may not be able to take advantage You should consider the investment objectives, risks, charges and expenses carefully before investing.
of the same opportunities or market trends as accounts that do not use such criteria. Investments in small- to medium-
Please call 877-518-9161 or go to www.TIAA.org/prospectuses for current product and fund prospectuses
sized corporations are more vulnerable to financial risks and other risks than larger corporations and may involve a
higher degree of price volatility than investments in the general equity markets. that contain this and other information. Please read the prospectuses carefully before investing.
Top ten holdings are subject to change and may not be representative of the account’s current or future investments. The This material is for informational or educational purposes only and does not constitute fiduciary investment advice
holdings listed only include the account’s long-term investments. Money market instruments and/or futures contracts, and under ERISA, a securities recommendation under all securities laws, or an insurance product recommendation under
index products used for cash management or to provide temporary exposure to a particular stock or country, is applicable, state insurance laws or regulations. This material does not take into account any specific objectives or circumstances
are excluded. The holdings may not include the account’s entire investment portfolio and should not be considered a of any particular investor, or suggest any specific course of action. Investment decisions should be made based on the
recommendation to buy or sell a particular security. investor’s own objectives and circumstances.
TIAA-CREF Individual & Institutional Services, LLC, Member FINRA, distributes securities products. ©2022 Teachers Insurance and Annuity Association of America-College Retirement Equities Fund, 730 Third Avenue,
New York, NY 10017
2123247 (04/22)CREF Stock Account Investment Product Commentary
For the quarter-to-date ending March 31, 2022
Account Performance Highlights portfolio detracted modestly. In the non-U.S. portion of the Account, the European
research portfolio outperformed, but its positive contribution was countered by the
In the first quarter of 2022, the CREF Stock Account underperformed the
lagging returns of the actively managed sub-strategies. On the plus side, the
Morningstar Aggressive Target Risk Index as well as the Account’s composite
Account’s actively managed EM portfolio delivered a strong quarter, exceeding its
benchmark, which consists of a 65% allocation to the Russell 3000® Index (U.S.
benchmark. The Account’s two global sub-strategies underperformed marginally.
markets) and a 35% allocation to the MSCI All-Country World ex-USA Investable
Market Index (non-U.S. developed and emerging markets).* Fair valuing had a
negative effect on the Account’s net return relative to the composite.** Positioning
Global equity market returns were broadly negative in the first quarter of 2022. The The CREF Stock Account is a broadly diversified, global equity variable annuity
period was marked by heightened geopolitical volatility amid Russia’s invasion of emphasizing low relative risk versus the market. Intended as a complete equity
Ukraine, surging energy prices and persistently high inflation, especially in the U.S. and holding, the Account provides exposure to all major equity market segments,
eurozone. In the U.S., fears of a slowing economy and uncertainty over the Federal including large-, mid- and small-cap stocks, both domestically and within
Reserve’s increasingly hawkish monetary policy weighed on equities as well. Overseas international developed and emerging markets. Secular, professional asset
stock markets also fell in aggregate during the period, with results comparable to allocation takes a long-term view on portfolio positioning to assist participants in
those of most major U.S. indexes. On a regional basis, returns in Latin America and planning for retirement. The multi-manager approach leverages the skills and
emerging markets ex-China were substantially more resilient than in Europe. experience of fundamental active portfolio managers, active equity research
analysts, and quantitative portfolio managers, to generate multiple, uncorrelated
The CREF Stock Account’s underperformance versus the Morningstar index was sources of excess return.
driven primarily by a relative overweight allocation to the U.S., in addition to lagging
returns from underlying portfolio strategies. These detractions offset a positive Entering the second quarter, we remain constructive on global equities overall,
contribution from the Account’s style allocation within the U.S. The non-U.S. while recognizing the need to be selective given the crosscurrents of inflation,
portion of the Account also trailed the index, mainly due to underperformance in likely higher-for-longer energy prices and elevated geopolitical risks. In the U.S.,
developed international and all-country ex-U.S. mandates. In emerging markets economic data has remained healthy, supporting healthy but modestly slower
(EM), an underweight position and strong outperformance by underlying portfolios growth, and earnings estimates for 2022 are positive. Outside the U.S., oversold
proved beneficial, while the Account’s global allocation detracted. Lastly, the conditions, particularly in the EM space, have made valuations more attractive.
Account’s lack of exposure to fixed income contributed modestly, as bonds broadly As always, we are committed to the CREF Stock Account’s investment approach:
underperformed equities during the period. combining a high level of diversification by geography, market-cap, and investment
Relative to the Account’s composite benchmark, favorable results from the U.S. style to provide attractive long-term return potential without undue risk.
quantitative small-cap and fundamental dividend growth strategies were offset by
underperformance by the fundamental large-cap strategies. The U.S. research
* As of October 1, 2021, the Account’s composite benchmark has moved to a 65% allocation to the Russell 3000 Index and a 35% allocation to the MSCI All-Country World ex-US Investable
Market Index.
** The Account’s return may sometimes diverge from the return of its benchmark index more than would be expected. This may be the result of a fair-value pricing adjustment. Many foreign
exchanges close before the Account’s daily unit value is calculated (generally 4 p.m. ET). In the intervening hours, the value of foreign securities can change, and these changes are not
reflected immediately in the Account’s benchmark index. They may, however, be reflected in the calculation of the Account’s unit value for that day.
The sectors referenced in the relative performance commentary above are based on the Global Industry Classification Standard (GICS®). The Global Industry Classification Standard (GICS)
was developed by MSCI, a premier independent provider of global indexes and benchmark-related products and services, and Standard & Poor’s (S&P), an independent international
financial data and investment services company and a leading provider of global equity indexes. You cannot invest directly in any index. Unlike mutual funds, index returns do not reflect a
deduction for fees or expenses.CREF Stock Account Investment Product Commentary
For the quarter-to-date ending March 31, 2022
Average Annual Returns
Estimated Gross Latest Since
Ticker Annual Expenses2 Inception Quarter 1 Year 3 Year 5 Year 10 Year Inception
CREF Stock Account–R1 QCSTRX 0.45% 7/31/1952 -6.18 5.56 13.74 11.60 10.82 9.92
CREF Stock Account–R21 QCSTPX 0.29% 4/24/2015 -6.14 5.72 13.94 11.81 N/A 9.67
CREF Stock Account–R31 QCSTIX 0.24% 4/24/2015 -6.13 5.77 14.00 11.87 N/A 9.74
Morningstar Aggressive Target Risk Index -4.85 5.66 12.35 10.92 10.16 N/A
CREF Stock Account Composite Index -5.38 7.47 14.95 12.76 11.69 N/A
Security Selection Effects Sector Effects on Top 10 Holdings
on Account Performance Account Performance Issuer % of Net Assets
Top Contributing Securities Top Contributing Sectors n Consumer Staples Microsoft Corp. 3.63%
AbbVie Inc. Energy n Health Care Apple Inc. 3.46%
n Consumer Discretionary Amazon.com Inc. 2.23%
AstraZeneca PLC Health Care n Energy
ConocoPhillips N/A n Industrials Alphabet Inc. Cl C 1.25%
n Information Technology Alphabet Inc. Cl A 1.17%
Top Detracting Securities Top Detracting Sectors n Materials Tesla Inc. 1.08%
Exxon Mobil Corporation Information Technology n Financials
n Communications Services NVIDIA Corp. 0.93%
Berkshire Hathaway Inc. Financials n Utilities United Health Group Inc. 0.81%
ING Groep NV Consumer Staples n Real Estate Taiwan Semiconductor Mfg. 0.74%
n Contribution n Detraction Mastercard Inc. 0.73%
The performance data quoted represents past performance and does not predict or guarantee future results. Your returns and the principal value of your investments will fluctuate so that your shares or accumulation units, when
redeemed, may be worth more or less than their original cost. Current performance may be lower or higher than the performance quoted. For performance current to the most recent month-end, visit TIAA.org or call 877-518-9161.
1
Effective April 24, 2015, additional classes are available with different eligibility requirements. The performance shown You should consider the investment objectives, risks, charges and expenses carefully before investing.
for Class R2 and Class R3 that is prior to its inception date is based on the Account’s Class R1. The inception date of the Please call 877-518-9161 or go to www.TIAA.org/prospectuses for current product and fund prospectuses
Account’s Class R1 is shown in the table above. The performance for these periods has not been restated to reflect the lower
expenses of the Class R2 and Class R3. If these lower expenses had been reflected, the performance of the Class R2 and that contain this and other information. Please read the prospectuses carefully before investing.
Class R3 for these periods would have been higher. Please visit the account’s prospectus at TIAA.org for more information. The CREF Composite Benchmark is a weighted average of unmanaged benchmark indices that represent the market sectors in
2
Total annual expense deductions, which include investment advisory, administrative, and distribution (12b-1) expenses, and which the Account invests. The Composite Index provides a more relevant benchmark for the Account’s performance as compared
mortality and expense risk charges, are estimated each year based on projected expense and asset levels. Please visit the to the Account’s unmanaged broad-based market indices. You cannot invest directly in any index. Index returns do not reflect a
account’s prospectus at TIAA.org for more information. deduction for fees or expenses. The Morningstar Aggressive Target Risk Index represents a portfolio of global equities, bonds
and traditional inflation hedges such as commodities and TIPS. This portfolio is held in a static allocation appropriate for U.S.
The Account is subject to certain risks, such as market and investment style risk. Please consider all risks carefully prior investors who seek above-average exposure to equity market risk and returns. The Morningstar Aggressive Target Risk Index seeks
to investing, the account is subject to allocation risk and the risks of foreign investing. approximately 95% exposure to global equity markets.
Top ten holdings are subject to change and may not be representative of the account’s current or future investments. The Investment, insurance and annuity products are not FDIC insured, are not bank guaranteed, are not deposits, are not
holdings listed only include the account’s long-term investments. Money market instruments and/or futures contracts, and insured by any federal government agency, are not a condition to any banking service or activity, and may lose value.
index products used for cash management or to provide temporary exposure to a particular stock or country, if applicable,
are excluded. The holdings may not include the account’s entire investment portfolio and should not be considered a Diversification cannot ensure a profit nor eliminate market risk.
recommendation to buy or sell a particular security. This material is for informational or educational purposes only and does not constitute fiduciary investment advice under ERISA,
TIAA-CREF Individual & Institutional Services, LLC, Member FINRA, distributes securities products. a securities recommendation under all securities laws, or an insurance product recommendation under state insurance laws or
regulations. This material does not take into account any specific objectives or circumstances of any particular investor, or suggest
This variable annuity is issued by College Retirement Equities Fund (CREF), New York, NY. Each TIAA entity is solely any specific course of action. Investment decisions should be made based on the investor’s own objectives and circumstances.
responsible for its own financial condition and contractual obligations.
©2022 Teachers Insurance and Annuity Association of America-College Retirement Equities Fund, 730 Third Avenue,
New York, NY 10017
2123241 (04/22)CREF Bond Market Account Investment Product Commentary
For the quarter-to-date ending March 31, 2022
Account Performance Highlights Interest rate positioning aided results including the Account’s shorter duration
than the benchmark, which made it less sensitive to higher rates. Yield curve
The CREF Bond Market Account slightly outperformed its benchmark, the
positioning was beneficial due to an underweight in shorter maturities offset by an
Bloomberg U.S. Aggregate Bond Index, in the first quarter of 2022.
overweight in longer maturities. Also, the Account’s underweight and security
Economic growth decelerated somewhat after a stronger-than-expected end to selection in agency MBS modestly contributed. Conversely, an overweight in
2021. Inflation continued to run high, exacerbated by rising oil prices due to spread sectors and corresponding underweight in Treasuries was the Account’s
Russia’s war on Ukraine, while the labor market tightened further with U.S. main detractor as growth and inflation concerns pushed spread sectors wider. An
unemployment falling to 3.6%. The Federal Reserve (Fed) vowed to take the overweight in corporate credit hurt results the most, followed by a more modest
necessary action to bring inflation under control beginning with a 25-basis-point negative impact from EM corporates and sovereigns. ABS and non-agency MBS
rate hike in March, while updating projections to imply six more rate increases this also detracted.
year. The Fed also indicated an earlier and more aggressive balance sheet runoff,
which is likely to start in May. This more hawkish stance caused the entire U.S.
Treasury curve to move higher in yield and flatten substantially, briefly inverting in
Positioning
the two-to-10-year segment. The 10-year Treasury yield rose 80 basis points to Although the Russia-Ukraine conflict has sent oil prices higher, we still anticipate
2.32%, while two-year Treasuries surged by twice as much. above-trend growth in the U.S. Europe faces a tougher near-term outlook, but we
expect the expansion to continue. While supply chain issues have begun to
As a result, fixed income returns were broadly negative. Mortgage rates increased dissipate, the overall level of disruption remains high. We expect inflation to
dramatically and volatility ramped up as the market tried to digest the pace of Fed moderate later this year, but from a higher peak than previously thought. Although
rate hikes and the timing and scale of balance sheet reductions. Spreads widened our analysis calls for decent fundamentals that should support spread assets, we
significantly and the mortgage-backed securities (MBS) segment returned -4.97%. have reduced the Account’s risk profile because we expect volatility to continue
Investment grade credit (-7.42%) recorded one of its worst yearly starts as the due to Fed hikes and the Ukraine conflict.
Ukraine invasion, surging inflation and tightening Fed drove a heavy dose of spread
volatility. High yield (-4.84%) was weighed down by the same issues, plus surging As such, we increased cash and Treasury exposure at the long end of the curve,
commodity/input costs, but recovered some losses following the first rate increase. while keeping duration modestly short of the benchmark. We continued to reduce
The entire securitized market also experienced elevated volatility and spread investment grade credit as valuations were not compelling. Non-agency MBS
widening with asset-backed securities (ABS) and commercial mortgage-backed exposure increased as we opted not to reinvest agency MBS paydowns and
securities (CMBS) returning -2.88% and -5.59%, respectively. Emerging market (EM) reduced investment grade credit. We continued to increase CMBS exposure as
debt declined sharply by -9.23%, rattled by unprecedented sanctions that followed that sector showed better relative value. The Account remains overweight in
Russia’s invasion, rapidly rising U.S. rates and slowing Chinese growth. spread sectors including investment grade and high yield corporates, ABS and
CMBS, and underweight agency MBS and Treasuries.
The sectors referenced in the relative performance commentary above are based on the Global Industry Classification Standard (GICS®). The Global Industry Classification Standard (GICS)
was developed by MSCI, a premier independent provider of global indexes and benchmark-related products and services, and Standard & Poor’s (S&P), an independent international
financial data and investment services company and a leading provider of global equity indexes. You cannot invest directly in any index. Unlike mutual funds, index returns do not reflect a
deduction for fees or expenses.You can also read